Blog Archive

Friday, January 15, 2010

Ken Levenson: Western Antarctic Ice Sheet (WAIS) Pine Island Glacier (PIG) passes tipping point

Dear Readers,

Here is some bad news, guaranteed not to cheer you up today. My apologies.

Tenney

avatar
0 0 votes

Western Antarctic Glacier Passes Tipping Point

The game changer that many feared is now unfolding in Antarctica. The Pine Island Glacier (PIG) is poised to suffer catastrophic collapse according to a new study by Richard Katz of the University of Oxford. The largest of the Western Antarctic Ice Sheet (WAIS), PIG has long been the focus of worried scientific attention. Joe Romm gave an exhaustive summary in August 2009 of the importance and tenuousness of PIG here.
Area of Pine Island Glacier
 
But now with this study, it seems Mr. Katz has identified PIG’s tipping point, and unfortunately, it seems, we’ve past it. 
 

As reported in New Scientist by Shanta Barley, the tipping point mechanism is a lip in the continental shelf. An extended excerpt to explain:
Climate change is warming the Amundsen Sea, which is at the southern margin of the Pacific Ocean. As rising sea levels push the warm water beneath the ice shelves, it melts them from below, pushing the grounding line higher up the continental shelf.
By raising sea levels, and therefore the grounding line, in their model, Katz’s team were able to find the point of no return beyond which the glacier would be unable to recover. That’s because the Antarctic sea bed has a small lip in it: it rises slowly up the continental shelf, then makes a slight dip before rising again to the shoreline. The researchers found that as long as the grounding line is on the outer rise of the sea bed, before the lip, small changes in climate lead to correspondingly small changes in the glacier’s ice volume.
But as soon as the grounding line moves over the lip and starts to move down into the dip in the sea bed, the situation changes critically. “Once the grounding line passes the crest, a small change in the climate causes a rapid and irreversible loss of ice,” says Katz.
So when will the grounding line pass the crest you ask? Try 1996!
Katz’ study estimates a 50% collapse by 2100 contributing about 24cm to sea rise. But by his own estimation they are being conservative and underestimating the potential melting.
Ominously, Barley reports:
This assumes that the grounding line does eventually stabilise, after much of PIG is gone. In reality, PIG could disappear entirely, says Hindmarsh. “If Thwaite’s glacier, which sits alongside PIG, also retreats, PIG’s grounding line could retreat even further back to a second crest, causing sea levels to rise by 52 centimetres.” The model suggests Thwaite’s glacier has also passed its tipping point.
Not good.

Link:  http://theenergycollective.com/TheEnergyCollective/56558

Tuesday, January 12, 2010

James Hansen: The People vs. Cap‐and‐Tax

The People vs. Cap‐and‐Tax
by James Hansen

The public is largely unaware of a momentous battle about to be fought in Washington. The stakes are enormous. Yet the public has not been well informed.

Ignorance of the matter derives in part from the fact that the conflict was initiated via the highly charged issue of climate change. Climate is complex. People have different opinions about the extent to which humans are causing climate change. Fundamental belief systems are involved and discussion can be emotional.

Yet the core issue can be defined independent of climate. It concerns how society can phase out its addictive use of fossil fuels and move on, in the most economically efficient and equitable way, to a clean energy future. Conservatives, independents and liberals should be united in this fight.

Washington could define a path that would lead the world toward a clean energy future. And, incidentally, it would solve the climate problem – without requiring anyone to agree that there even is a climate problem.

Yet Washington appears intent on choosing a path defined by corporate greed. Unless the public gets engaged, the present Administration may jam down the public’s throat just such an approach, which, it can be shown, is not a solution at all.

The frustrating thing to me is my inability to communicate these alternatives to the public. This feeling is consuming, because I believe with all my mind and heart that the well‐being of my children and grandchildren (and yours) depends upon whether the public becomes informed and interested. So far, it isn’t.

I had an opportunity on a recent David Letterman Show (http://www.youtube.com/watch?v=KiJJgC7B_KY), where I said that, for the sake of the people and the planet, the public must understand the difference between “cap‐and‐trade” and “fee‐and‐dividend.” Of course, I could not continue
with that topic there. But it is the heart of the matter. So how to proceed?

I decided to write an op‐ed for the New York Times. I got city‐slickered by the editors, as I will relate here. Perhaps this story can help people understand – it is not necessary to be a physicist or economist to  understand the basic issues – it is mostly common sense.

My op‐ed, which I submitted to the Times in early December, just prior to the UN climate meeting in Copenhagen, excoriated “cap‐and‐trade‐with‐offsets.” As I will explain, cap‐and trade with offsets is the approach taken in the Waxman‐Markey bill that narrowly passed the House of Representatives last June and the Kerry‐Boxer bill that is currently languishing in the Senate.

The four legislators whose names adorn those bills have been stalwart environmentalists for their entire long and honorable careers. Yet cap‐and‐trade, which is ostensibly designed to reduce carbon dioxide emissions and preserve global climate, has been a proven loser in Europe. And the cap‐and‐trade bills, which also have the support of the White House and its environmentalist allies, are even worse.

Cap‐and‐trade‐with‐offsets would benefit a handful of wealthy people, while consigning our children to a downhill slide toward a lower standard of living – on a planet whose wondrous life forms are being decimated. So how can it be the basis of legislation being pushed by the Democratic Administration in both the House and Senate?

Easy. The proposed bills in Congress are loaded with goodies for special financial and corporate interests. These bills would cheat the American public – again. Cap‐and‐trade was designed in part by Wall Street, which is eager to exploit a trading market expected to grow to two trillion dollars. The revolving door between Washington and Wall Street helped bring the scheme about.

My op‐ed [http://www.nytimes.com/2009/12/07/opinion/07hansen.html is the published version; http://www.columbia.edu/~jeh1/mailings/2009/20091207_SackGoldmanSachs.pdf is a saltier version] proposed an alternative approach, fee‐and‐dividend, designed to benefit the public rather than Wall Street. A carbon fee would be collected from the fossil fuel companies on the first sale of oil, gas and coal at the mine, wellhead or port of entry. One hundred percent of the collected fee would be given to the public monthly, deposited electronically in people’s bank accounts or debit cards, an equal amount to each household.

I titled my op‐ed “Sack Goldman Sachs’ Cap‐and‐Trade.” But editors can distort articles with titles of their choosing – and I know The Times tends to favor mainstream environmentalist ideology. So I asked the editors if they would retain my title. They refused to tell me. For good reason. If I had known their plans, I would have withdrawn the op‐ed.

Their published title: “Cap and Fade.” Not one person has offered a sensible explanation of that title. Worse, the editors added a subtitle indicating that “fee‐and‐dividend” was a tax, implying that cap‐and‐trade was not a tax. This is a case of calling black white and white black.

Cap‐and‐trade is a hidden tax. An accurate name would be cap‐and‐tax, because cap‐and‐trade increases the cost of energy for the public, as utilities and other industries purchase the right to pollute with one hand, adding it to fuel prices, while with the other hand they take back most of the permit revenues from the government. Costs and profits of the trading infrastructure are also added to the public’s energy bill.

Fee‐and‐dividend, in contrast, is a non‐tax. The fee collected at the first sale of oil, gas and coal in the country does increase the price of fossil fuel energy. But 100% of the fee is distributed monthly to the public as electronic deposits to the bank account or debit card of all legal residents, with half shares for children, up to two children per family.

The dividend keeps families whole while providing an economic stimulus to boot. By the time the fee reaches $115 per ton of carbon dioxide (equivalent to $1 per gallon of gasoline) the dividend will be $2,000‐$3,000 per legal resident per year ‐‐ $6000‐$9,000 for a family with two or more children.

People who keep their carbon footprint smaller than average will make money. The fee will rise gradually so people have a chance to choose more efficient vehicles, insulate their homes, and so on. The dividend will help people afford these investments. Jobs will be created as society retools the economy from high‐carbon to low.

Perhaps coincidentally, the Times published alongside my op‐ed an article by their columnist Paul Krugman (http://www.nytimes.com/2009/12/07/opinion/07krugman.html) extolling the merits of cap‐and‐trade. Krugman asserted that cap‐and‐trade provided the basis for a successful international agreement at Copenhagen on climate.

This one‐two punch, evisceration of my article via a nonsensical title and an opposing piece (http://krugman.blogs.nytimes.com/2009/12/07/unhelpful‐hansen/) by Nobel Prize winning Krugman, was not enough. By the time readers were ready for their second cup of coffee, at 10:45 a.m., an article “Unhelpful Hansen” appeared on Krugman’s heavily trafficked blog.

Krugman is one of my favorite columnists. I am amazed at his productivity, and I agree with most of his opinions. I am not suggesting that he was given prior knowledge of my piece by Times editors – I assume that he just works fast. My hope is that he is open to persuasion. Our aims are similar, and this matter is so important that it deserves careful reanalysis.

I also think the public can distinguish the forest from the trees. This topic is not rocket science. It is mostly a matter of common sense. And, contrary to Krugman’s insinuation, most economists are in closer agreement with my perspective than with his.

First we must recognize one basic fact. Then I will describe the three main issues on which Krugman and I disagree. Then you can make up your own mind.

Basic fact. As long as fossil fuels are the cheapest form of energy their use will continue and even increase.

Consider the Kyoto Protocol, which was negotiated at a prior UN climate meeting in 1997. National emissions of signatory countries were capped at some agreed levels. Nations evaded these limits by purchasing “offsets” – putative but often illusory reduction in greenhouse gas emissions from developing countries. Offsets destroy the effectiveness of the agreement, because the scientific requirement for stabilizing climate is that the fossil fuel emissions are phased down rapidly. And some nations just ignored the limits, because there was no realistic way to enforce them. However, the fundamental problem was that “Kyoto” did not increase the price of fossil fuels relative to non‐carbon energies.

The handful of nations that claimed to have reduced their carbon emissions were joshing their citizens and everybody else. They were just pretending to be “green.” Manufacture of products based heavily on fossil fuels simply moved to developing countries, which had no cap.

Then the products were flown to the developed countries, while burning aircraft fuel that is untaxed because of a 1940s agreement to support the fledgling airline industry.

Prior to “Kyoto” global fossil fuel emissions were increasing 1.5% per year. Afterwards, they increased 3% per year. Kyoto may not have caused the increase (although shifting production to developing countries, often by coal‐fired inefficient industries, with shipping to developed countries, did not help), but it certainly did not stop it.

Now let’s address the three main arguments of Krugman, common arguments wielded by proponents of cap‐and‐trade.

Krugman Argument #1. Cap‐and‐trade is the only way to get an effective agreement rapidly.
That is a myth. In fact, every cap‐and‐trade regime has taken many years to hammer out. Kyoto negotiations dragged on a decade and were not completed. Individual countries had to be bribed to participate, yet some still would not. And the result was not successful, as we have seen.

Proposed cap‐and‐trade within the United States would be even more complex than “Kyoto.”

The Waxman‐Markey and Boxer‐Kerry cap‐and‐trade bills in Congress are larded with 2,000 pages of give‐aways to special interests, soaking the public who must pay higher energy prices. Fee‐and‐dividend, in contrast, is defined by a single number: the fee (tax) rate that the fossil fuel companies must hand over at the first sale of oil, gas or coal. All the government must do is divide this collected revenue by the number of legal residents and punch a button monthly to deliver the dividend to the public.

What is the chance that a United States cap‐and‐trade law could be a precursor for a global agreement? Zero. There is no chance that China will accept a cap. Nor should they. They are still in the early phase of their economic development.

But would China be willing to place a carbon fee on their fossil fuels? Yes, for many reasons.

First, China wants to avoid, or at least minimize, the problems of fossil fuel addiction that plague the United States, such as the need for military protection of global supply lines. Second, China would be hit hardest by climate change, with several hundred million people living close to sea level and a still‐enormous agrarian population. Third, air and water pollution from fossil fuels are a huge problem in China.

China is taking the right steps. They are investing heavily in energy efficiency, renewable energy, and nuclear power, threatening to take over technical and economic leadership as the United States continues to dawdle. The Chinese government knows that replacement of fossil fuels with energy efficiency, renewable energies, and non‐carbon energies requires a price signal (in addition to other more‐targeted policies and investments).

Compare the difficulty of negotiating national carbon fee (tax) rates with the difficulty of convincing China that they should have Waxman‐Markey‐like cap‐and‐trade. Because of our historical energy profligacy, versus China’s energy penury, a U.S. cap — even expressed as a percentage reduction — has no moral standing in China. On the other hand, the Chinese leadership appears to be smart enough to realize that a rising carbon price is just what their country needs as the underpinning to policies aimed at a clean energy future.

International agreement requires principally that the United States and China agree to apply such internal fees across the board on fossil fuels at the mine or port of entry. Agreement on such action is in the best interests of both nations, making it far easier to reach than agreements on caps.

With the United States and China acting in concert on a carbon fee, Europe, Japan and other nations would surely follow. Import duties based on standard amounts of fossil fuels used in production could be applied to products from countries that did not have a carbon fee, removing any competitive disadvantage from the fee and providing strong incentive for participation in the carbon fee.

Krugman Argument #2. Cap‐and‐trade and fee‐and‐dividend are really equivalent.

Krugman says that the fee‐and‐dividend I propose is “essentially equivalent” to cap‐and‐trade. Here I may not have been clear. I do not dispute the economic theory that a cap and a fee are, in principle, equivalent. But cap‐and‐trade’s complexity allows special interests to take over, killing its effectiveness.

The devil is in the implementations, as I discuss in my book “Storms of My Grandchildren.” I believe lay people can appreciate the differences. Cap‐and‐trade’s complexity provides a breeding ground for special interests. A fee at the mine, wellhead or port of entry, with distribution of proceeds to the public, has a great advantage in simplicity. Let me note here its superiority in transparency and fairness.

One can appreciate the difference in transparency by comparing the 2,000‐page Waxman‐Markey cap‐and‐trade bill with the simplicity of a single fee (tax) rate on fossil fuels. With fee-and‐dividend we know who gets the money – equal amounts to all legal residents. But try reading the Waxman‐Markey 2,000‐page bill to figure out who would get the money! Why do those special interests deserve it anyhow?

Regarding fairness, I should note that there is a variant of fee‐and‐dividend preferred by Al Gore. He would use the money collected by the fee to reduce payroll taxes, rather than give U.S. residents a dividend. It seems to me that a payroll tax deduction fails the fairness test, because half of adults are not on payrolls, being either retired or out of work involuntarily.

However, some economists also prefer a payroll tax deduction. Their argument is that reducing taxes on employment creates jobs and stimulates the economy. It seems to me that dividends do the same, but I suppose that using half of the collected fee to reduce payroll taxes would be an acceptable compromise. However, it would be important to be certain that the payroll tax deduction is real and matches the fee collection. With a dividend it is easier to be sure that the government is coughing up the full amount.

Krugman Argument #3. Wall Street will not be involved in carbon trading

Krugman says that my suggestion that carbon trading will be an open invitation to Wall Street to again pillage the financial system “is bizarre.” What is bizarre, in my opinion, is his implicit presumption that government regulators can outwit Wall Street executives.

Congress can write a cap‐and‐trade bill that tries to exclude Wall Street. But to think that Wall Street will not get involved in carbon profits, directly or indirectly, is naïve. This is a free country. Wall Street banks can buy the companies most affected by carbon price.

Notice what happened after we bailed out the big banks? They decided the chump‐change in loans to home‐owners wasn’t worth their trouble. Instead they went to trading – in the stock market – making billions. Their secretive trading units are good – very good – there is a reason that they get big bonuses.

Wall Street and the big banks took us to the cleaners once – shame on them. If we allow Congress to pass cap‐and‐trade, letting the banks do it to us again – shame on us.

Trading schemes make sense only when they provide added value. Carbon trading provides mostly added cost. What we need is a transparent, honest approach that benefits the public.

The Fundamental Requirement

We can cure our fossil fuel addiction and in the process reduce emissions that cause climate change. It requires that we take actions for the public interest, not for special interests.

What we need is an approach that addresses the fundamental fact that keeps us addicted to fossil fuels: they are the cheapest form of energy, provided their prices do not have to include the damage they do to human health, the environment, and the future of our children.

For the sake of the people, especially young people, there should be a rising price on carbon emissions. The price should rise at a known economically sensible rate, so that businesses have time to plan their investments accordingly. The money collected should be put in the hands of the public, so they are able to make the purchases necessary to reduce their carbon footprint.

The money collected should not be used by Congress to invest in energy R&D. It has been shown time and again that Congress does not invest efficiently, and certainly not compared to the private sector. Private sector investments will be made if a rising price of carbon emissions is legislated through a carbon fee that makes the rising price explicit. The government already has resources to support research – it should not steal fee‐and‐dividend money from the public.

Contrary to claims of mainstream environmental groups and others politically invested in cap-and‐trade, the legislative train has not left the station. There is time to negotiate and pass a simple transparent bill that is in the interest of the public. It should be a bi‐partisan bill that can be supported by conservatives.

Congress is accustomed to working with special interests. There is a revolving door between Congress and lobbyists. Ex‐members know the Washington ropes. The lobbyists wrote most of the pages in the 2,000‐page bills in Congress.

We, the public, cannot allow politics‐as‐usual to steamroll this topic. It is too important for the health of our economy, our children, and the other life on the planet. Fortunately, there are members of Congress who are beginning to understand the problem and move in the direction to address it.

Congressman Larson’s bill, with a rising carbon fee, addresses half of the task. The rate at which the fee rises in this bill is perhaps too slow, but the important point is to provide the business community and the public some certainty that carbon prices will rise so they can make decisions and investments accordingly.

Senator Cantwell’s cap‐and‐dividend bill also addresses half of the solution – distributing 100% of the proceeds to the public as a dividend. However, it is just as important to dispense with the “cap” approach, still present in the Cantwell bill, as it is with the “trade” aspect.

A cap is more complex than a fee (dollars per ton of CO2, applied uniformly at the source), so a cap is more subject to jerry‐rigging by special interests. But the fundamental reasons to remain dead‐set against the cap approach are these:

(1) Caps inherently cause prices to fluctuate wildly. Even if legislators attempt to outsmart the market by building in limits on the fluctuations, there is still uncertainty in the impact on energy prices. Business people need to have confidence about how prices will change in the future.

Ditto, the public. If they expect prices to be fluctuating they are not as likely to make the lifestyle decisions that are needed to move us toward the cleaner future beyond fossil fuels.

(2) A cap‐and‐dividend approach is not a route to a global agreement. There is no way that developing countries such as China can accept a cap, given their state of development. The United States should be a global leader. The way to do that is to demonstrate an understanding of the global problem and provide a leadership example in solving it.

Postscript
One of the economists I consult with suggested alternative ways to address Krugman’s arguments. These suggestions are so extensive that I cannot incorporate them as if they were my own – but they provide additional insight. So I edited them a bit and put on my web site at http://www.columbia.edu/~jeh1/mailings/2010/20100112_PeoplePostscript.pdf. This discussion refers to two of arguments listed above, and to an addition argument (Cap‐and‐trade worked for acid rain, so it will work for climate change).

Letter
The letter delivered to the chairperson of the Carbon Trading Summit is at http://www.columbia.edu/~jeh1/mailings/2010/20100112_PeopleLetter.pdf
Link to pdf file of above article: http://www.columbia.edu/~jeh1/mailings/2010/20100112_PeopleVersusCap.pdf

Melbourne Swelters Through Hottest Night in a Century

Melbourne Swelters Through Hottest Night in a Century

by Robert Fenner, Bloomberg, January 12, 2010

Residents of Melbourne sweltered through the hottest night in more than a century as warm winds swept the city in Australia’s southeast, straining air conditioners and sending crowds to area beaches for relief.

Temperatures in Australia’s second-most populous city soared to as high as 43.6 °C (110.5 °F) yesterday, remaining above 30 °C throughout the night. The overnight low of 30.6 °C matched the previous record for Melbourne’s warmest night set on February 1, 1902, Stuart Coombs, duty forecaster for the Bureau of Meteorology, said in a telephone interview today.

The heat and winds drove Melbourne residents to swimming pools and air-conditioned shopping malls while thousands flocked to beaches on Port Phillip Bay. Cooler air is on the way, with temperatures forecast to reach 33 °C today.

Electricity demand in Victoria rose to a peak of 10,105 megawatts at 5 p.m. yesterday, compared with average summer peaks of about 6,500, according to the Australian Energy Market Operator, a grouping of energy industry bodies. A record peak of 10,494 megawatts was set on January 29 last year.

Metro Trains, which operates Melbourne’s suburban rail network, reported power failures and cancellations on 12 of its 17 lines early today. The operator canceled more than 140 services yesterday.

Paramedics responded to more than 100 heat-related cases yesterday, the Victorian ambulance service said on its Web site.

Bushfire Threat
The spike in temperatures is similar to last year when record highs across Australia’s southeast contributed to a rash of bushfires in the state of Victoria that killed 173.

A bushfire burned out of control today in the eastern Gippsland region of Victoria, the Country Fire Authority said on its Web site. The fire may threaten the town of Cann River this evening, the warning said.

The Australian bushfire season arrived early this summer, with some parts of New South Wales declared to be at danger in August, sooner than expected.

Parts of Western Australia state were designated disaster areas last month after heat fanned bushfires that destroyed 2,900 hectares (7,166 acres) of land and 30 homes. Sydney issued warnings in December as fires threatened properties near the nation’s largest city.

Fruit-Growing Region
The Goulburn Valley, Australia’s largest fruit-growing region about 200 kilometers (124 miles) north of Melbourne, has already experienced six days this month with temperatures above 40 °C, compared with a January average of four days.

Growers in central Victoria, where 85% of the nation’s pears are cultivated, may have to harvest earlier than usual as the heat accelerates ripening, said Rien Silverstein, president of horticulture at the Victorian Farmers Federation.

Some growers are using more overhead watering to lower temperatures while others are installing shading and spraying fruit with chalk to act as a sunscreen, Silverstien said in a telephone interview today from her family’s orchards in the central Victorian city of Shepparton.

“Sunburn is pretty frightful when it gets on fruit, it affects the apples the worst,” Silverstein said. “Last year’s heat literally cooked the fruit.”

The warm weather so far this year comes after Australia experienced its warmest decade since records began in 1910. Temperatures averaged 22.3 °C from 2000 to 2009 compared with 21.8 °C from 1961 to 1990, Dean Collins, a senior climatologist with the Australian Bureau of Meteorology, said in an interview last week.

Water Dams
Victorian water dams recorded their lowest inflows on record during the past decade, the state government said today. Some 3.9 billion liters of water entered storage during the period, compared with a previous low of 5 billion in the 1980s.

The heat is unlikely to affect the state’s wheat crop as most growers completed harvesting in December, said Andrew Broad, president of the Victorian Farmers Federation.

Global weather patterns are fluctuating widely this year, providing what scientists say is evidence of a changing climate. European transport has been delayed this week by snow in the U.K. and Germany, while China curbed power use because of extreme cold.

In Victoria, the Country Fire Authority has maintained bans on open-air fires across most of the state with Code Red bushfire warnings issued for areas in the state’s north.

The Code Red alert, the highest level, was activated for the first time yesterday after being introduced in the wake of last year’s bushfires.

To contact the reporter on this story: Robert Fenner in Melbourne rfenner@bloomberg.net

Link:  http://www.bloomberg.com/apps/news?pid=20601087&sid=ausuZoSSOv6A&pos=9

NOAA's National Weather Service's Climate Prediction Center's forecast for the Arctic Oscillation for the next 7-14 days, from January 12, 2010

NOAA's National Weather Service's Climate Prediction Center's forecast for the Arctic Oscillation for the next 7-14 days, from January 12, 2010


The daily AO indices are shown for the previous 120 days. The indices are standardized by standard deviation of the observed monthly AO index from 1979-2000.

The values at the upper left and right corner of each figure indicate the mean value of the AO index and the correlation coefficients between the observation and the forecasts, respectively.

 
GFS Arctic Oscillation Outlooks
 

Link:  http://www.cpc.noaa.gov/products/precip/CWlink/daily_ao_index/ao_index_mrf.shtml

Joseph Romm: Met Office’s Richard Betts incorrectly asserts “the dramatic decline in Arctic sea ice in 2007 … was then partly reversed in 2008 and 2009”

Met Office’s Richard Betts incorrectly asserts “the dramatic decline in Arctic sea ice in 2007 … was then partly reversed in 2008 and 2009.”

by Joseph Romm, Climate Progress, January 12, 2010

Memo to media, non-cryosphere scientists:  The peer-reviewed literature does not provide support for the view that the Arctic “recovered” in 2008 — and even what happened in 2009 has now been called into question (see below).   Don’t fall into the mindset of the anti-science disinformers, who all seem to think two dimensionally.


In July 2009, leading cryoscientists at JPL, the Polar Science Center at the University of Washington, and NASA published a major peer-reviewed article, “Thinning and volume loss of the Arctic Ocean sea ice cover: 2003–2008” (discussed here) and posted this figure of Arctic ice volume:


Not bloody much “recovery” or “reversal” from 2007 to 2008.
Now Andy Revkin has just posted a typical Goldilocks piece on Dot Earth — it’s not too hot, it’s not too cold.  I don’t want to rehash all of my problems with this approach, but I will say that since the observational evidence shows that warming of the climate system is “unequivocal” — and essentially the entire scientific community and every member government of the IPCC agrees with that analysis — it is clearly reasonable for the media to discuss certain very unique, extreme weather events predicted by climate science in the context of that warming — as Revkin himself once did in discussing the remarkable extremes in Australia last year [see CNN, ABC, WashPost, AP, blow Australian wildfire, drought, heatwave “Hell (and High Water) on Earth” story — never mention climate change].  Since we’re not in a cooling trend, of course, it would be illogical for a competent reporter to use a cold snap as evidence of such a non-existent trend.

I want to focus on a quote he got from Richard Betts, the head of the climate impacts division at Britain’s Met Office, which shows that even the most knowledgeable climate experts don’t follow the literature as closely as they should:

One classic example is the dramatic decline in Arctic sea ice in 2007, which was then partly reversed in 2008 and 2009. Although there is still definitely a declining trend in Arctic sea ice (2009 and 2008 were still the second and third lowest sea ice extents, after 2007) there was a lot of hype surrounding the 2007 minimum even though that was partly just natural variability in the Arctic climate.
Well, we’ve already seen that Betts was wrong abut the reversal in 2008.  He was focused on the two-dimensional Arctic ice coverage, and apparently missed the sharp drop in volume, which I dare say is “dramatic” and much more important.

The scientific literature has also weighed in on the cause of the 2007 decline (see “What drove the dramatic retreat of arctic sea ice during summer 2007?“). Let me quote from the Geophysical Research Letters (subs. req’d) analysis by four scientists from the Polar Science Center, Applied Physics Laboratory, College of Ocean and Fishery Sciences, University of Washington, Seattle:
A model study has been conducted of the unprecedented retreat of arctic sea ice in the summer of 2007. It is found that preconditioning, anomalous winds, and ice-albedo feedback are mainly responsible for the retreat. Arctic sea ice in 2007 was preconditioned to radical changes after years of shrinking and thinning in a warm climate.The Arctic Ocean lost additional (sic) 10% of its total ice mass in which 70% is due directly to the amplified melting and 30% to the unusual ice advection, causing the unprecedented ice retreat. Arctic sea ice has entered a state of being particularly vulnerable to anomalous atmospheric forcing.
So, yes, that minimum was partly due to natural variability, but in fact it was mostly due to warming. 
Arguably, absent the warming trend, there’d have been exceedingly little chance of anything like the 2007 decline.

Final question:  Did the ice recover from 2008 to 2009?  To answer, that you must read the new study, “Perennial pack ice in the southern Beaufort Sea was not as it appeared in the summer of 2009” (subs. req’d), which I discussed at length here:  “Where on Earth is it unusually warm? Greenland and the Arctic Ocean, which is full of rotten ice.”

That study concluded:
Our results are consistent with ice age estimates (Fowler & Maslanik, http://nsidc.org/news/press/20091005_minimumpr.html) that show the amount of MY sea ice in the northern hemisphere was the lowest on record in 2009 suggesting that MY sea ice continues to diminish rapidly in the Canada Basin even though 2009 areal extent increased over that of 2007 and 2008.
If it’s true that the amount of multiyear sea ice in the northern hemisphere was the lowest on record in 2009, then it is hard to say that there was any genuine recovery.

Second, the satellite and other measurements that suggested two-dimensional recovery of sea ice extent have been called into question.  It appears an unfortunate trick of Nature helped hide the decline of Arctic ice:
In September 2009 we observed a much different sea icescape in the Southern Beaufort Sea than anticipated, based on remotely sensed products. Radarsat derived ice charts predicted 7 to 9 tenths multi-year (MY) or thick first-year (FY) sea ice throughout most of the Southern Beaufort Sea in the deep water of the Canada Basin. In situ observations found heavily decayed, very small remnant MY and FY floes interspersed with new ice between floes, in melt ponds, thaw holes and growing over negative freeboard older ice. This icescape contained approximately 25% open water, predominantly distributed in between floes or in thaw holes connected to the ocean below. Although this rotten ice regime was quite different that the expected MY regime in terms of ice volume and strength, their near-surface physical properties were found to be sufficiently alike that their radiometric and scattering characteristics were almost identical.
Until the community of cryosphere scientists resolves this apparent overestimation of ice recovery by their standard measurement techniques, claims that the Arctic ice recovered even in 2009 are premature.  The stunning decline in Arctic ice volume in recent years remains very strong evidence of human-caused warming and something the media has every reason to continue to write about in the context of overall global warming stories.

Link:  http://climateprogress.org/2010/01/12/sciencerichard-betts-andy-revkin-dramatic-decline-in-arctic-sea-ice-in-2007-was-not-reversed-in-2008-2009-recovery/

Monday, January 11, 2010

Buffalo Beast censors own article on climate villain Roger Pielke, Jr., well-known climate science obfuscator

Now the Buffalo Beast, under pressure from the crack pot climate scientist (he's actually a political science guy), Roger Pielke, Jr., and his associates at the infamous Breakthrough Institute, known for its own crack pots and deniers, cloaked under the mantle of reason until you read past the first line of their articles.  What a load of bull they post on their home page, full of "no reason to change the way we live -- growth is good!" -- that kind of bull that we all know just ain't workin' out the way we'd like it.


What did the Buffalo Beast do?  They resected Mike Roddy's article on the 15 most heinous climate villains and suddenly the article became "The 14 most heinous climate villains."  If they had any balls, they would have gone all out and published a more complete list, but instead they just tucked their tails under and left the field.


Shame!


http://www.buffalobeast.com/?p=1237

Joseph Romm: Lindzen debunked again: New scientific study finds his paper downplaying dangers of human-caused warming is “seriously in error”


Lindzen debunked again: New scientific study finds his paper downplaying dangers of human-caused warming is “seriously in error”


Trenberth: The flaws in Lindzen-Choi paper "have all the appearance of the authors having contrived to get the answer they got."

by Joseph Romm, Climate Progress, January 11, 2010

Consistently being wrong and consistently producing one-sided analyses that are quickly debunked in the literature should lead scientific journals and the entire scientific community (and possibly the media) to start ignoring your work.

But when you are one of the last remaining “serious” professional scientists spreading global warming disinformation who retains a (nano)ounce of credibility because you are associated with a major university — M.I.T. — and your name is Richard Lindzen, apparently you can just keep publishing and repeating the same crap over and over and over again.

It’s not just that Lindzen’s popular disinformation tracts have been widely debunked — see RealClimate here.  Or that his one remaining big idea — that clouds are negative feedback — has been refuted in the literature [see Science: “Clouds Appear to Be Big, Bad Player in Global Warming,”an amplifying feedback (sorry Lindzen and fellow deniers)].   That idea of course meant ignoring the myriad observations that climate impacts are occurring faster, not slower, than the models had predicted, and that therefore the multiple strong amplifying feedbacks are overwhelming whatever few week negative feedbacks occur in the climate system — see Study: Water-vapor feedback is “strong and positive,” so we face “warming of several degrees Celsius” (and below).

At the Heartland conference of climate-change disinformers last year, Lindzen went from disinformation to defamation as he smeared the reputation of one of the greatest living climate scientists, Wallace Broecker (see “Shame on Richard Lindzen, MIT’s uber-hypocritical anti-scientific scientist“).

But still his shoddy work manages to make it through the peer review process of a few journals, and the antiscience crowd eat it up and regurgitates it over the blogosphere like a toddler with H1N1.  His latest nonsense is about to be thoroughly eviscerated in the literature, and RealClimate his multiple posts on how flawed Lindzen’s analysis was and how the peer review process failed.  You should start with “Lindzen and Choi Unraveled” by climate scientists John Fasullo, Kevin Trenberth and Chris O’Dell:

A recent paper by Lindzen and Choi in GRL (2009) (LC09) purported to demonstrate that climate had a strong negative feedback and that climate models are quite wrong in their relationships between changes in surface temperature and corresponding changes in outgoing radiation escaping to space. This publication has been subject to a considerable amount of hype, for instance apparently “[LC09] has absolutely, convincingly, and irrefutably proven the theory of Anthropogenic Global Warming to be completely false.” and “we now know that the effect of CO2 on temperature is small, we know why it is small, and we know that it is having very little effect on the climate”. Not surprisingly, LC09 has also been highly publicized in various contrarian circles.

Our initial reading of their article had us independently asking, how we could have missed such explicit evidence of the cloud feedback as shown in LC09? Why would such a significant finding have gone undiscovered when these feedbacks are widely studied and recognised as central to the projections of climate change? We discovered these common concerns at a meeting last year and then teamed up to address these questions.

With the hype surrounding the manuscript, one would think that the article provides a sound, rock solid basis for a reduced climate sensitivity. However, our examination of the study’s methods demonstrates that this is not the case. In an article in press (Trenberth et al. 2010 (sub. requ.), hereafter TFOW), we show that LC09 is gravely flawed and its results are wrong on multiple fronts. These are the major issues we found:
The LC09 results are not robust….
LC09 misinterpret air-sea interactions in the tropics….
More robust methods show no discrepancies between models and observations….
LC09 have compared observations to models prescribed with incomplete forcings….
LC09 incorrectly compute the climate sensitivity.
The paper itself is behind a firewall, but finds:
Atmospheric model results are explored and found to be consistent with observations.  From 1985 to 1999 the largest perturbation in TOA [top-of-atmosphere] radiative fluxes was from the eruption of Mount Pinatubo and clearly models which do not include that forcing will not simulate the effects. Consequently, regressions of radiation with SSTs in the tropics may have nothing to say about climate sensitivity….

As shown here, the approach taken by LC09 is flawed, and its results are seriously in error.  The LC09 choice of dates has distorted their results and underscores the defective nature of their analysis….
I’m shocked, shocked that Lindzen did shoddy, one-sided analysis and was wrong about feedbacks and sensitivity.

But, seriously, how could such crap make it into a serious journal?  Gavin Schmidt prints a long explanation from O’Dell:
Given the large number of comments on the peer-review process in general and in the LC09 case in particular, it is probably worthwhile to give a bit more backstory to our Trenberth et al. paper. On my first reading of LC09, I was quite amazed and thought if the results were true, it would be incredible (and, in fact, a good thing!) and hence warranted independent checking.
Very simple attempts to reproduce the LC09 numbers simply didn’t work out and revealed some flaws in their process. To find out more, I contacted Dr. Takmeng Wong at NASA Langley, a member of the CERES and ERBE science teams (and major player in the ERBE data set) and found out to my surprise that no one on these teams was a reviewer of LC09. Dr. Wong was doing his own verification of LC09 and so we decided to team up.

After some further checking, I came across a paper very similar to LC09 but written 3 years earlier – Forster & Gregory (2006) , hereafter FG06. FG06, however, came to essentially opposite conclusions from LC09, namely that the data implied an overall positive feedback to the earth’s climate system, though the results were somewhat uncertain for various reasons as described in the paper (they attempted a proper error analysis). The big question of course was, how is it that LC09 did not even bother to reference FG06, let alone explain the major differences in their results? Maybe Lindzen & Choi didn’t know about the existence of FG06, but certainly at least one reviewer should have. And if they also didn’t, well then, a very poor choice of reviewers was made.

This became clear when Dr. Wong presented a joint analysis he & I made at the CERES science team meeting held in Fort Collins, Colorado in November. At this meeting, Drs. Trenberth and Fasullo approached us and said they had done much the same thing as we had, and had already submitted a paper to GRL, specifically a comment paper on LC09. This comment was rejected out of hand by GRL, with essentially no reason given. With some more inquiry, it was discovered that:
  1. The reviews of LC09 were “extremely favorable”
  2. GRL doesn’t like comments and is thinking of doing away with them altogether.
  3. GRL wouldn’t accept comments on LC09 (and certainly not multiple comments), and instead it was recommended that the four of us submit a stand-alone paper rather than a comment on LC09.
We all felt strongly that we simply wanted to publish a comment directly on LC09, but gave in to GRL and submitted a stand-alone paper. This is why, for instance, LC09 is not directly referenced in our paper abstract. The implication of statement (1) above is that LC09 basically skated through the peer-review process unchanged, and the selected reviewers had no problems with the paper. This, and for GRL to summarily reject all comments on LC09 appears extremely sketchy.
In my opinion, there is a case to be made on the peer-review process being flawed, at least for certain papers. Many commenters say the system isn’t perfect, but it in general works. I would counter that it certainly could be better. For AGU journals, authors are invited to give a list of proposed reviewers for their paper. When the editor is lazy or tight on time or whatever, they may just use the suggested reviewers, whether or not those reviewers are appropriate for the paper in question. Also, when a comment on a paper is submitted, the comment goes to the editor that accepted the original paper – a clear conflict of interest.

So yes, the system may work most of the time, but LC09 is a clear example that it doesn’t work all of the time. I’m not saying LC09 should have been rejected or wasn’t ultimately worthy of publication, but reviewers should have required major modifications before it was accepted for publication.
It is typical for the few bad papers that make it through peer-review to fail to reference the multiple analyses in the literature that prove the opposite position.  The question is why journals allow that.

Shouldn’t the fact that it had Lindzen’s name on it wrung alarm bells that called for extra scrutiny.  Few people have been as consistently wrong as he has.

UPDATE:  I see climate scientist Tom Wigley commented on Gavin’s first post here:
You say “LC09 was not a nonsense paper – that is, it didn’t have completely obvious flaws that should have been caught by peer review." I beg to differ.

It is a priori obvious that one cannot determine the climate sensitivity from an incomplete energy balance over the tropics. LC09 ignores the fluxes of heat into and/or out of the region via the atmosphere, and the flux of heat into the ocean. As Trenberth et al. point out, these are large terms, and they simply cannot be ignored. This is a glaringly obvious error that any competent reviewer should have picked up. It undermines the whole analysis and makes it worthless. In my view, the other issues raised by Trenberth et al. are important, but secondary to this fundamental problem.
DotEarth’s Revkin interviewed Trenberth, who has some choice quotes:
In a telephone interview today, Dr. Trenberth told me that the flaws in the Lindzen-Choi paper “have all the appearance of the authors having contrived to get the answer they got.”
… I asked Dr. Trenberth to run the numbers on how much the difference in analysis amounts to in terms of warming from a doubling of the carbon dioxide concentration that long prevailed before the industrial revolution. He said that, if done correctly, the Lindzen-Choi analysis would have produced a 1.5 degree Fahrenheit warming instead of the 0.9 degree warming the paper initially contained. But rectifying an additional flaw — the paper’s selection of sea temperatures in a way that did not appear to be objective — produces a warming of 4.1 degrees, a level at the heart of what most climate simulations and other studies project. That did not include issues related to the original paper restricting its analysis to the tropics, he added.
And again, most climate models focus on the getting the fast-feedbacks right, like water vapor and polar amplification, but utterly neglect the ones that operate over decades:
Truly only one negative feedback in the planet’s overall carbon cycle can act with sufficient speed and strength to avert catastrophic climate impacts: The dominant carbon-based life form on this planet will have to respond to the already painfully clear impacts of our carbon emissions by slashing those emissions sharply and eventually running the planet on carbon-negative power.

The time for this negative feedback is now.

Related post:
Link: http://climateprogress.org/2010/01/11/science-lindzen-debunked-again-positive-negative-feedbacks-clouds-tropics/

Sunday, January 10, 2010

TOPEX/Poseidon, Jason-1 and Jason-2: Historical sea level changes over the last two decades, 3.3 +/- 0.4 mm per year

Historical sea level changes

Last two decades

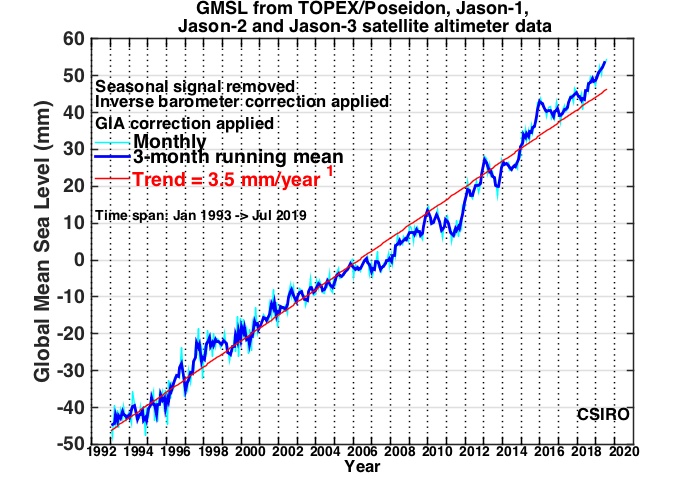
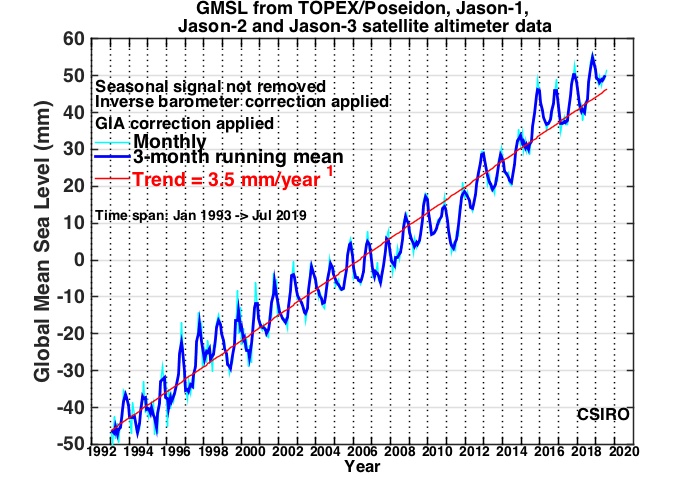
High-quality measurements of (near)-global sea level have been made since late 1992 by satellite altimeters, in particular, TOPEX/Poseidon (launched August 1992) and Jason-1 (launched December 2001) and Jason-2 (launched June 2008). This data has shown a more-or-less steady increase in Global Mean Sea Level (GMSL) of around 3.3 ± 0.4 mm/year over that period. This is more than 50% larger than the average value over the 20th century. Whether or not this represent a further increase in the rate of sea level rise is not yet certain.

The two plots below show the GMSL measured from TOPEX/Poseidon, Jason-1 and Jason-2.

This one shows it with the seasonal signal removed:
Plot of global sea level from 1993 to 2008
And this shows it with the seasonal signal left in:

Regional trends

Sea level does not rise (or fall) uniformly over the oceans. This is illustrated by the map (below) showing sea-level trends from 1993 to 2008. There is a clear pattern of sea-level change that is also reflected in patterns of ocean heat storage.
Plot of sea level trends from 1993 to 2008


This pattern primarily reflects interannual climate variability associated with the El Niño/La Niña cycle. During El Niño years sea level rises in the eastern Pacific and falls in the western Pacific, whereas in La Niña years the opposite is true, as is shown (below) by the trends from two subsets of the same dataset.
Plot of sea level trends from 1993 to 2000 and 2001 to 2008

Movie of sea-level changes (2.3 MB animated gif) over the last 16 years - this version has had the seasonal (annual+semi-annual) signal removed at each point. This is comparable to the top figure (above).

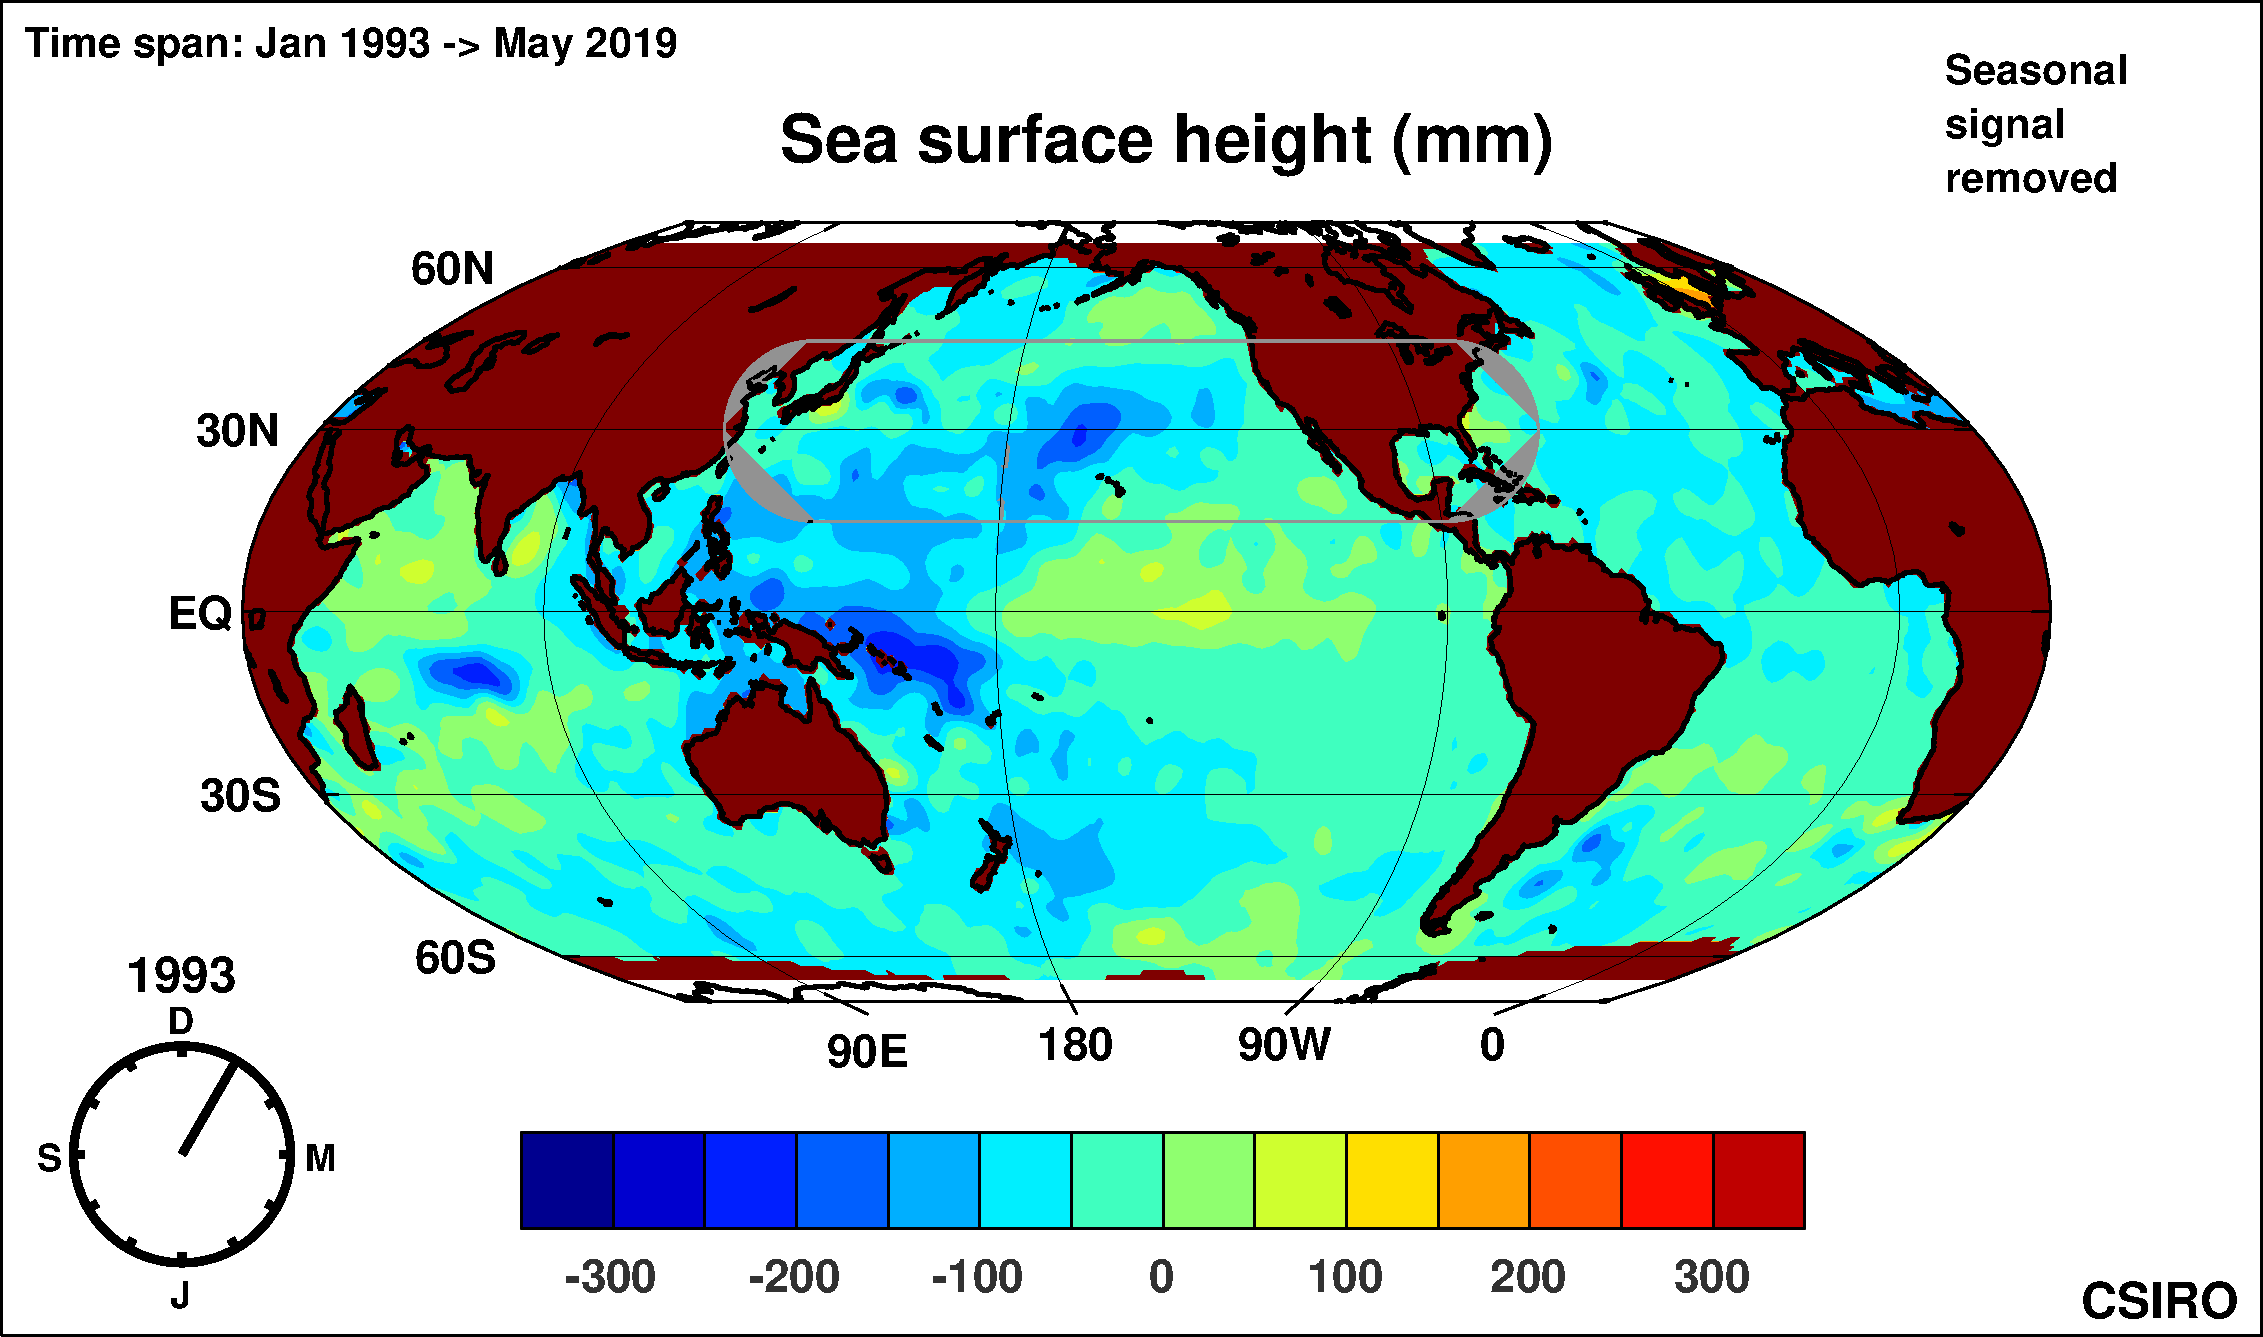
Click on the map below to see a movie of monthly-mean sea-surface height from January 1993 to August 2009 with the seasonal signal removed. The plot at the top of the page shows the time series of the means of these fields.

The data that is displayed here can be downloaded from the "Sea level data>Data downloads" page on this site.

Note the 1997/98 El Niño event!

Sea surface height 1993-2008

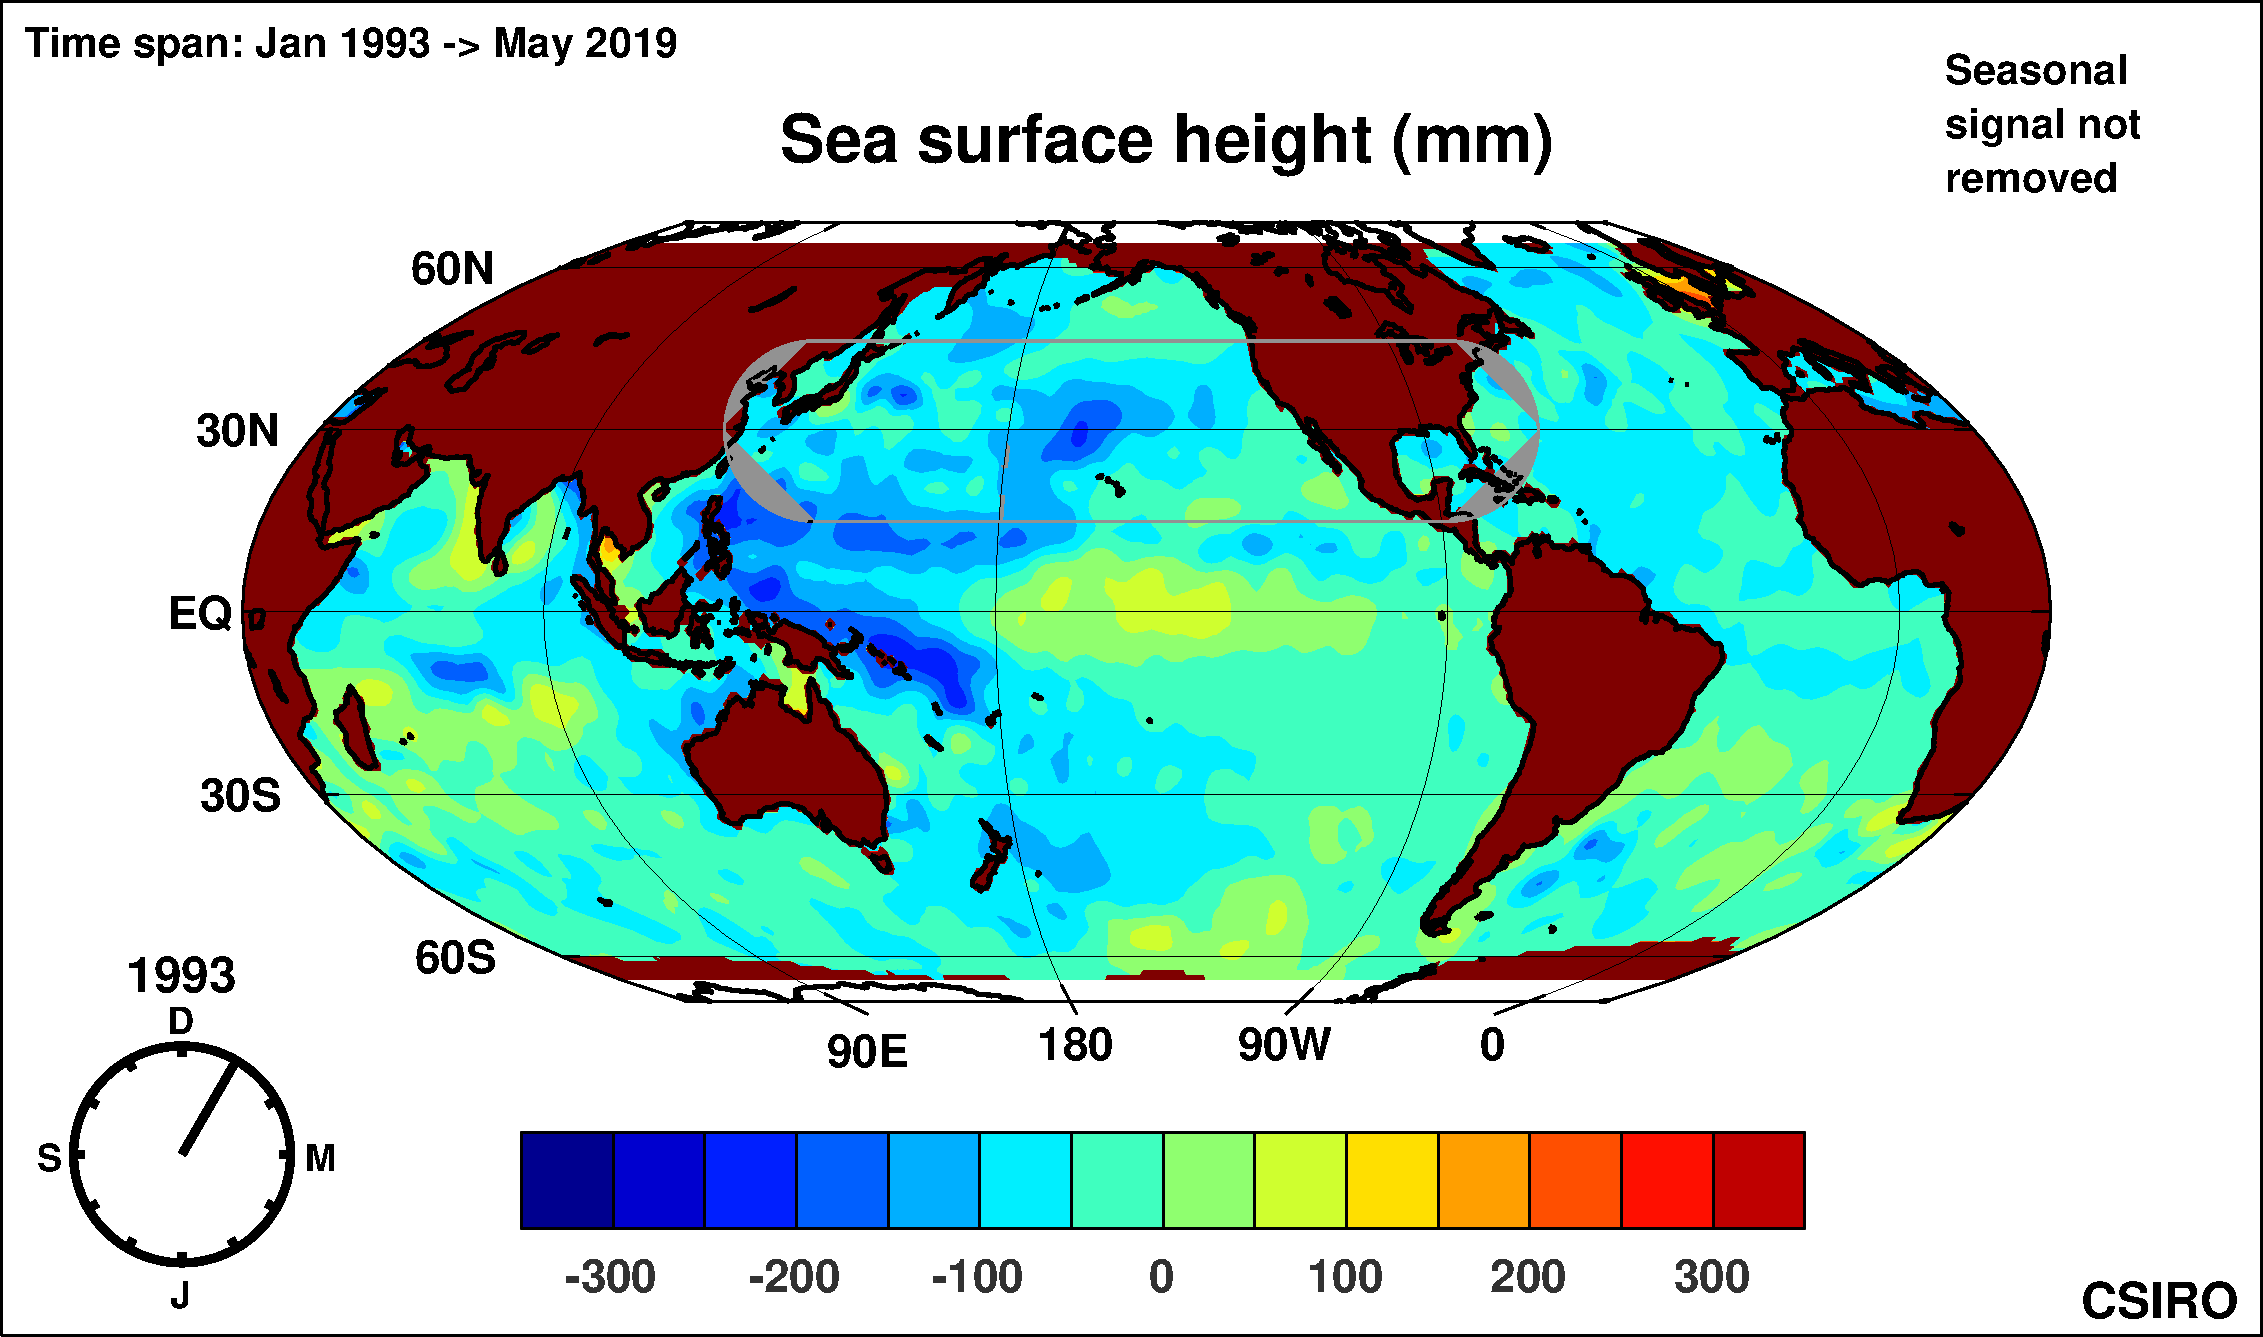
Another movie of sea-level changes (2.4 MB animated gif) over the last 16 years

Click on the map below to see a movie of monthly-mean sea-surface height from January 1993 to August 2009. The seasonal signal has not been removed from this, so you should see the pumping as the water in each hemisphere warms and expands in Spring and Summer and cools and shrinks in Autumn and Winter. The second plot (above) shows the time series of the means of these fields.

The data that is displayed here can be downloaded from the "Sea level data>Data downloads" page on this site.

Note especially the 1997/98 El Niño event!

Website owner: Neil White 23/12/09
Link:  http://www.cmar.csiro.au/sealevel/sl_hist_last_15.html

Saturday, January 9, 2010

Gavin Schmidt of RealClimate: Updates to model vs. data comparisons, see Hansen's scenarios A, B, and C

Updates to model-data comparisons

by Gavin Schmidt, RealClimate, 28 December 2009 
 
It’s worth going back every so often to see how projections made back in the day are shaping up. As we get to the end of another year, we can update all of the graphs of annual means with another single datapoint. Statistically this isn’t hugely important, but people seem interested, so why not?


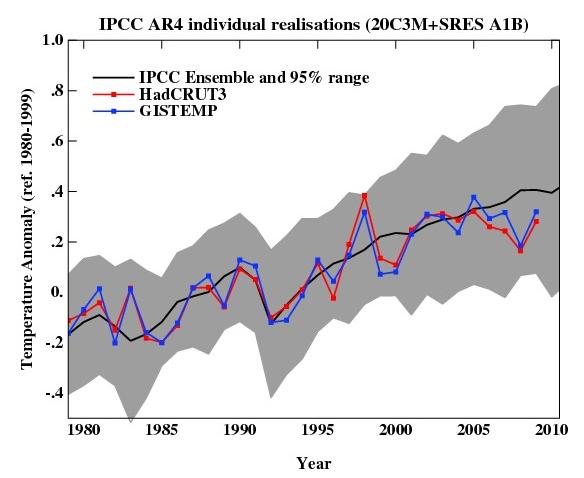
For example, here is an update of the graph showing the annual mean anomalies from the IPCC AR4 models plotted against the surface temperature records from the HadCRUT3v and GISTEMP products (it really doesn’t matter which). Everything has been baselined to 1980-1999 (as in the 2007 IPCC report) and the envelope in grey encloses 95% of the model runs. The 2009 number is the Jan-Nov average.

As you can see, now that we have come out of the recent La Niña-induced slump, temperatures are back in the middle of the model estimates. If the current El Niño event continues into the spring, we can expect 2010 to be warmer still. But note, as always, that short term (15 years or less) trends are not usefully predictable as a function of the forcings. It’s worth pointing out as well, that the AR4 model simulations are an ‘ensemble of opportunity’ and vary substantially among themselves with the forcings imposed, the magnitude of the internal variability and of course, the sensitivity. Thus while they do span a large range of possible situations, the average of these simulations is not ‘truth’.

There is a claim doing the rounds that ‘no model’ can explain the recent variations in global mean temperature (George Will made the claim last month for instance). Of course, taken absolutely literally this must be true. No climate model simulation can match the exact timing of the internal variability in the climate years later. But something more is being implied, specifically, that no model produced any realisation of the internal variability that gave short term trends similar to what we’ve seen. And that is simply not true.

We can break it down a little more clearly. The trend in the annual mean HadCRUT3v data from 1998-2009 (assuming the year-to-date is a good estimate of the eventual value) is 0.06+/-0.14 ºC/dec (note this is positive!). If you want a negative (albeit non-significant) trend, then you could pick 2002-2009 in the GISTEMP record which is -0.04+/-0.23 ºC/dec. The range of trends in the model simulations for these two time periods are [-0.08,0.51] and [-0.14, 0.55], and in each case there are multiple model runs that have a lower trend than observed (5 simulations in both cases). Thus ‘a model’ did show a trend consistent with the current ‘pause’. However, that these models showed it, is just coincidence and one shouldn’t assume that these models are better than the others. Had the real world ‘pause’ happened at another time, different models would have had the closest match.

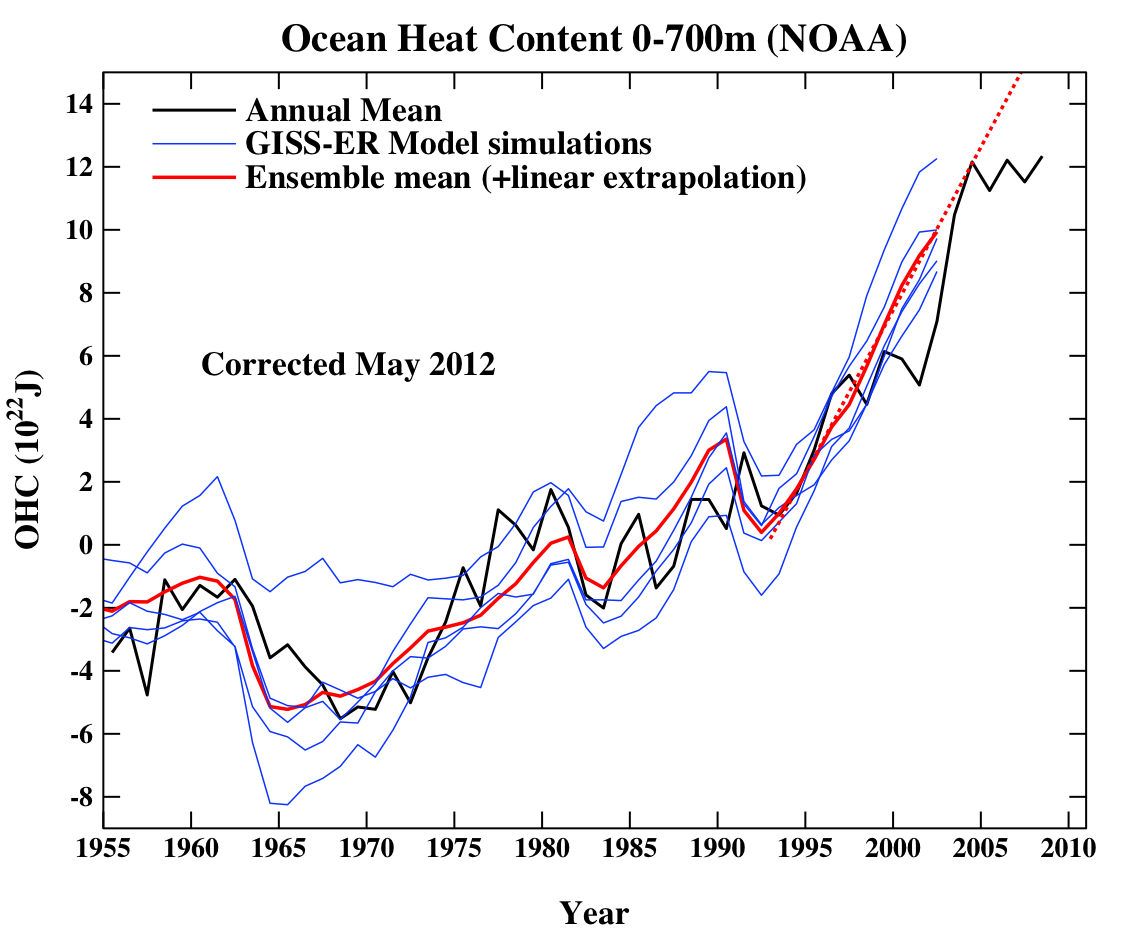
Another figure worth updating is the comparison of the ocean heat content (OHC) changes in the models compared to the latest data from NODC. Unfortunately, I don’t have the post-2003 model output handy, but the comparison between the 3-monthly data (to the end of Sep) and annual data versus the model output is still useful.

(Note, that I’m not quite sure how this comparison should be baselined. The models are simply the difference from the control, while the observations are ‘as is’ from NOAA.) I have linearly extended the ensemble mean model values for the post 2003 period (using a regression from 1993-2002) to get a rough sense of where those runs could have gone.

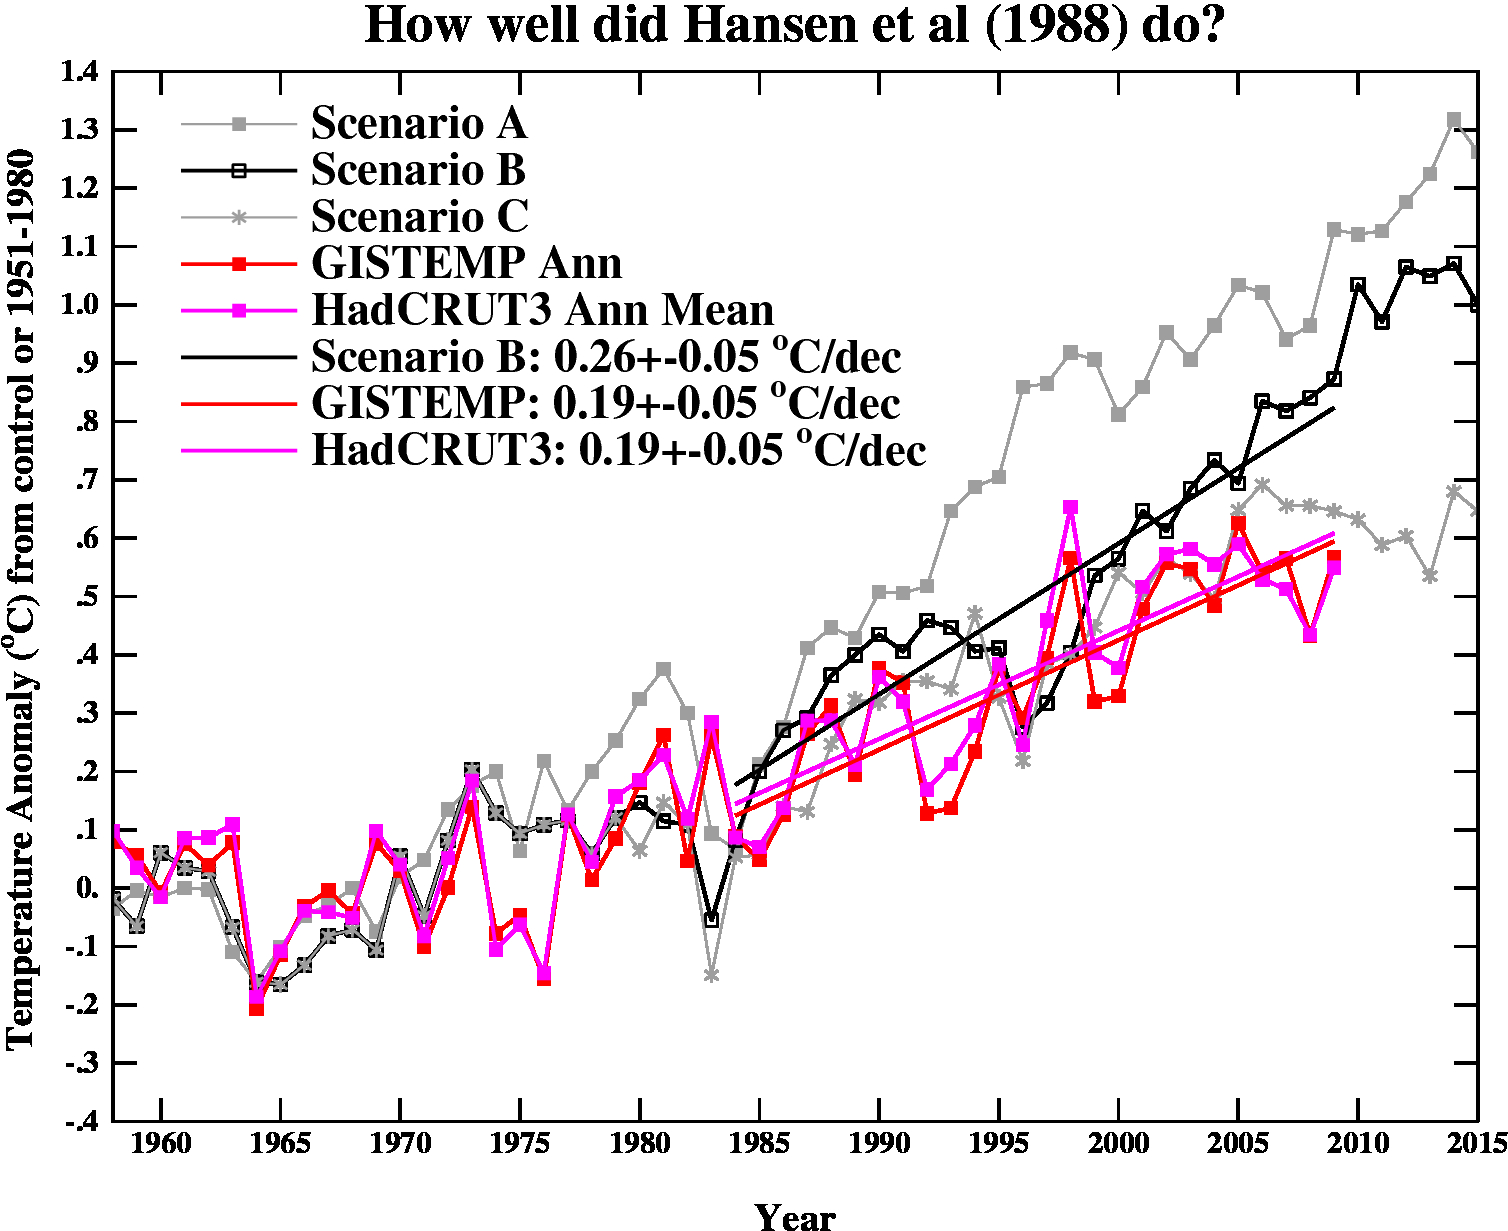
And finally, let’s revisit the oldest GCM projection of all, Hansen et al. (1988). The Scenario B in that paper is running a little high compared with the actual forcings growth (by about 10%), and the old GISS model had a climate sensitivity that was a little higher (4.2 ºC for a doubling of CO2) than the current best estimate (~3 ºC).


The trends are probably most useful to think about, and for the period 1984 to 2009 (the 1984 date chosen because that is when these projections started), scenario B has a trend of 0.26+/-0.05 ºC/dec (95% uncertainties, no correction for auto-correlation). For the GISTEMP and HadCRUT3 data (assuming that the 2009 estimate is ok), the trends are 0.19+/-0.05 ºC/dec (note that the GISTEMP met-station index has 0.21+/-0.06 ºC/dec). Corrections for auto-correlation would make the uncertainties larger, but as it stands, the difference between the trends is just about significant.

Thus, it seems that the Hansen et al. ‘B’ projection is likely running a little warm compared to the real world, but assuming (a little recklessly) that the 26 yr trend scales linearly with the sensitivity and the forcing, we could use this mismatch to estimate a sensitivity for the real world. That would give us 4.2/(0.26*0.9) * 0.19=~ 3.4 ºC. Of course, the error bars are quite large (I estimate about +/-1 ºC due to uncertainty in the true underlying trends and the true forcings), but it’s interesting to note that the best estimate sensitivity deduced from this projection, is very close to what we think in any case. For reference, the trends in the AR4 models for the same period have a range 0.21+/-0.16 ºC/dec (95%). Note too, that the Hansen et al. projection had very clear skill compared to a null hypothesis of no further warming.

The sharp-eyed among you might notice a couple of differences between the variance in the AR4 models in the first graph, and the Hansen et al model in the last. This is a real feature. The model used in the mid-1980s had a very simple representation of the ocean – it simply allowed the temperatures in the mixed layer to change based on the changing the fluxes at the surface. It did not contain any dynamic ocean variability – no El Niño events, no Atlantic multidecadal variability etc. and thus the variance from year to year was less than one would expect. Models today have dynamic ocean components and more ocean variability of various sorts, and I think that is clearly closer to reality than the 1980s vintage models, but the large variation in simulated variability still implies that there is some way to go.

So to conclude, despite the fact these are relatively crude metrics against which to judge the models, and there is a substantial degree of unforced variability, the matches to observations are still pretty good, and we are getting to the point where a better winnowing of models dependent on their skill may soon be possible. But more on that in the New Year.

Link:  http://www.realclimate.org/index.php/archives/2009/12/updates-to-model-data-comparisons/http://www.realclimate.org/index.php/archives/2009/12/updates-to-model-data-comparisons/

RealClimate: Lindzen and Choi unraveled

Lindzen and Choi Unraveled

Guest Commentary by John Fasullo, Kevin Trenberth and Chris O’Dell, RealClimate, 8 January 2010

A recent paper by Lindzen and Choi in GRL (2009) (LC09) purported to demonstrate that climate had a strong negative feedback and that climate models are quite wrong in their relationships between changes in surface temperature and corresponding changes in outgoing radiation escaping to space. This publication has been subject to a considerable amount of hype, for instance apparently “[LC09] has absolutely, convincingly, and irrefutably proven the theory of Anthropogenic Global Warming to be completely false.” and “we now know that the effect of CO2 on temperature is small, we know why it is small, and we know that it is having very little effect on the climate.” Not surprisingly, LC09 has also been highly publicized in various contrarian circles.


Our initial reading of their article had us independently asking, how we could have missed such explicit evidence of the cloud feedback as shown in LC09? Why would such a significant finding have gone undiscovered when these feedbacks are widely studied and recognised as central to the projections of climate change? We discovered these common concerns at a meeting last year and then teamed up to address these questions.

With the hype surrounding the manuscript, one would think that the article provides a sound, rock solid basis for a reduced climate sensitivity. However, our examination of the study’s methods demonstrates that this is not the case. In an article in press (Trenberth et al. 2010 (sub. requ.), hereafter TFOW), we show that LC09 is gravely flawed and its results are wrong on multiple fronts. These are the major issues we found:
  • The LC09 results are not robust. A goal of LC09 was to quantify the cloud feedback by examining variability in top-of-atmosphere (TOA) radiative fluxes in the tropics as it relates to variability in mean sea surface temperature (SST). To do this they examine only tropical data. In general, they find that during periods of higher-than-normal SST, the radiation emitted and reflected to space by the earth goes up as well, cooling the Earth and amounting to an overall negative climate feedback. To show this, they select intervals of warming and cooling (in a time series of monthly averaged values) and compare fluxes at their endpoints (see Figure). They didn’t provide an objective criterion for selecting these endpoints and in some instances (see their Fig. 1), the selection of these intervals actually appears to be quite odd.


    Fig. 1: Warming (red) and cooling (blue) intervals of tropical SST (20°N – 20°S) used by LC09 (solid circles) and an alternative selection proposed derived from an objective approach (open circles) (TFOW, 2010).


    The result one obtains in estimating the feedback by this method turns out to be heavily dependent on the endpoints chosen. [edit] In TFOW we show that the apparent relationship is reduced to zero if one chooses to displace the endpoints selected in LC09 by a month or less. So with this method the perceived feedback can be whatever one wishes it to be, and the result obtained by LC09 is actually very unlikely. This is not then really indicative of a robust cloud feedback.

  • LC09 misinterpret air-sea interactions in the tropics The main changes in tropical SST and radiative fluxes at TOA are associated with El Niño-Southern Oscillation (ENSO) and are not necessarily indicative of forced variability in a closed system. ENSO events cause strong and robust exchanges of energy between the ocean and atmosphere, and tropics and subtropics. Yet LC09 treat the tropical atmosphere as a closed and deterministic system in which variations in clouds are driven solely by SST. In fact, the system is known to be considerably more complex and changes in the flow of energy arise from ocean heat exchange through evaporation, latent heat release in precipitation, and redistribution of that heat through atmospheric winds. These changes can be an order of magnitude larger than variability in TOA fluxes, and their effects are teleconnected globally. It is therefore not possible to quantify the cloud feedback with a purely local analysis.

  • More robust methods show no discrepancies between models and observations In TFOW, we compute correlations and regressions between tropical SSTs and top-of-atmosphere (TOA) longwave, shortwave and net radiation using a variety of methods. LC09 found the observed behavior to be opposite from that of 11 atmospheric models forced by the same SSTs and conclude that the models display much higher climate sensitivity than is inferred from ERBE. However, in our analysis comparing these relationships with models, we are unable to find any systematic model bias. More importantly, the nature of these relationships in models bears no relationship to simulated sensitivity. That is, the metric developed by LC09 is entirely ineffective as a proxy for simulated sensitivity.

  • LC09 have compared observations to models prescribed with incomplete forcings The AMIP configuration in the model simulations used by LC09 have incomplete forcings. The AMIP protocol started off a test only of how an atmospheric model reacts to changes in ocean temperatures, and so models often only use the ocean temperature change when doing these kinds of experiments. However, over the period of this comparison, many elements – greenhouse gases, aerosols, the sun and specifically, volcanoes changed the radiative fluxes, and this needs to be taken into account. Some models did this in these experiments, but not all of them.

    For instance, the dominant source of variability in the reflected solar flux arises from aerosols associated with the eruption of Mount Pinatubo in June of 1991 yet all but two model simulations examined by LC09 omit such forcings entirely. Other radiative species are absent from the models altogether. It is thus obviously inappropriate to expect such model simulations to replicate observed variability in TOA fluxes.

  • LC09 incorrectly compute the climate sensitivity By not allowing for the black body radiation (the Planck function) in their feedback parameter, LC09 underestimate climate sensitivity. Using the correct equations, LC09 should obtain a feedback parameter and climate sensitivity of -0.125 and 0.82 K, respectively, rather than their values of -1.1 and 0.5 K.  In contrast, TFOW results yield a positive feedback parameter and greater sensitivity estimate, though we also caution that this approach is not a valid technique for estimating sensitivity, as a closed and therefore global domain is essential (though not by itself sufficient). Lastly, LC09 fail to account for variability in forcings in estimating sensitivity.
While climate models are known to struggle with many aspects of tropical climate, especially in regards to its coupled variability, the problems claimed by LC09 are not among them. Forster and Gregory [2006] and Murphy et al. [2009] address changes in the energy budget with surface temperatures for a much larger domain and present a much more complete and defensible analysis and discussion of issues. They demonstrate that recent observed variability indeed supports a positive shortwave cloud feedback. So the feedbacks from processes other than the Planck function response are clearly positive in both observations and models, in contrast to LC09’s conclusions. Moreover, it is not appropriate to use only tropical SSTs and TOA radiation for feedback analysis as the transports into the extratropics are substantial. Any feedback analysis must also recognize changes in ocean heat storage and atmospheric energy transport into and out of the tropics which are especially large during ENSO events. While the tropics play an important role in determining climate sensitivity, simplistic and arbitrary analyses of tropical variability can be grossly misleading.

References

Forster, P. M. F., and J. M. Gregory (2006), The climate sensitivity and its components diagnosed from Earth Radiation Budget Data, J. Clim., 19, 39–52
Lindzen, R. S., and Y.-S. Choi (2009), On the determination of climate feedbacks from ERBE data, Geophys. Res. Lett., 36, L16705, doi:10.1029/2009GL039628.
Murphy, D. M., S. Solomon, R. W. Portmann, K. H. Rosenlof, P. M. Forster , and T. Wong (2009), An observationally based energy balance for the Earth since 1950, J. Geophys. Res., 114, D17107, doi:10.1029/2009JD012105.
Trenberth, K. E., J. T. Fasullo, Chris O’Dell, and T. Wong, (2010): Relationships between tropical sea surface temperature and top-of-atmosphere radiation. Geophys. Res. Lett., 37, doi:10.1029/2009GL042314, in press.


Link:  http://www.realclimate.org/index.php/archives/2010/01/lindzen-and-choi-unraveled/

M. E. Monge et al., PNAS, Jan. 6, 2010: Light changes the atmospheric reactivity of soot

Proceedings of the National Academy of Sciences, published online before print January 6, 2010; doi: 10.1073/pnas.0908341107

Light changes the atmospheric reactivity of soot


Maria Eugenia Monge, Barbara D’Anna, Linda Mazri, Anne Giroir-Fendler, Markus Ammann, D. J. Donaldson and Christian George

Edited by Barbara J. Finlayson-Pitts, University of California, Irvine, CA, and approved November 11, 2009 (received for review July 27, 2009.

Abstract

Soot particles produced by incomplete combustion processes are one of the major components of urban air pollution. Chemistry at their surfaces lead to the heterogeneous conversion of several key trace gases; for example NO2 interacts with soot and is converted into HONO, which rapidly photodissociates to form OH in the troposphere. In the dark, soot surfaces are rapidly deactivated under atmospheric conditions, leading to the current understanding that soot chemistry affects tropospheric chemical composition only in a minor way. We demonstrate here that the conversion of NO2 to HONO on soot particles is drastically enhanced in the presence of artificial solar radiation, and leads to persistent reactivity over long periods. Soot photochemistry may therefore be a key player in urban air pollution.

Link to abstract:  http://www.pnas.org/content/early/2010/01/01/0908341107.abstract

J. N. Smith et al., PNAS, Jan. 2010: Observations of aminium salts in atmospheric nanoparticles and possible climatic implications

Proceedings of the National Academy of Sciences, published online before print January 7, 2010; doi: 10.1073/pnas.0912127107

Observations of aminium salts in atmospheric nanoparticles and possible climatic implications

James N. Smith, Kelley C. Barsanti, Hans R. Friedli, Mikael Ehn, Markku Kulmala, Donald R. Collins, Jacob H. Scheckman, Brent J. Williams and Peter H. McMurry


Edited by Barbara J. Finlayson-Pitts, University of California, Irvine, Irvine, CA, and approved November 25, 2009 (received for review October 20, 2009.

Abstract

We present laboratory studies and field observations that explore the role of aminium salt formation in atmospheric nanoparticle growth. These measurements were performed using the Thermal Desorption Chemical Ionization Mass Spectrometer (TDCIMS) and Ultrafine Hygroscopicity Tandem Differential Mobility Analyzers. Laboratory measurements of alkylammonium—carboxylate salt nanoparticles show that these particles exhibit lower volatilities and only slightly lower hygroscopicities than ammonium sulfate nanoparticles. TDCIMS measurements of these aminium salts showed that the protonated amines underwent minimal decomposition during analysis, with detection sensitivities comparable to those of organic and inorganic deprotonated acids. TDCIMS observations made of a new particle formation event in an urban site in Tecamac, Mexico, clearly indicate the presence of protonated amines in 8–10 nm diameter particles accounting for about 47% of detected positive ions; 13 nm particles were hygroscopic with an average 90% RH growth factor of 1.42. Observations of a new particle formation event in a remote forested site in Hyytiälä, Finland, show the presence of aminium ions with deprotonated organic acids; 23% of the detected positive ions during this event are attributed to aminium salts while 10 nm particles had an average 90% RH growth factor of 1.27. Similar TDCIMS observations during events in Atlanta and in the vicinity of Boulder, Colorado, show that aminium salts accounted for 10–35% of detected positive ions. We conclude that aminium salts contribute significantly to nanoparticle growth and must be accounted for in models to accurately predict the impact of new particle formation on climate.

Hans Joachim Schellnhuber, PNAS, Vol. 106(49), Tipping elements in the Earth System

Proceedings of the National Academy of Sciences, (December 8, 2009), Vol. 106, No. 49, pp. 20561-20563; published online before print December 7, 2009; doi:

Tipping elements in the Earth System

Hans Joachim Schellnhuber*

Potsdam Institute for Climate Impact Research, Telegraphenberg A 31, 14473 Potsdam, Germany

Edited by B. L. Turner, Arizona State University, Tempe, AZ, and approved September 30, 2009 (received for review September 25, 2009.

The Earth System (ES) is defined as the conglomerate formed by human civilization and its planetary matrix (i.e., all parts of the Earth that interact with the members and manifestations of our species) (1, 2). Thus, eminently complex systems like the global economy or the human brain are just components of the ES, contributing to its overall evolution. The climate machinery is another formidable subsystem that comprises vast domains of the atmosphere, hydrosphere, biosphere, and pedosphere, involves innumerable intertwined processes, and generates fairly robust dynamical patterns like the Hadley cell. This machinery still operates in the “Holocene mode,” which emerged ≈10 ka ago and is characterized by a distinctive distribution of ice sheets, wind regimes, ocean currents, biomes, and deserts, something that can be perceived as the environmental face of the Earth.

Although one of the ES components mentioned above, the global economy, is about to inadvertently transform that face through massive emissions of greenhouse gases (GHGs) and the so-induced planetary warming, one other crucial component, the human brain, struggles to advertently preserve it by constructing clumsy institutions like the United Nations Framework Convention on Climate Change (http://unfccc.int/resource/docs/convkp/conveng.pdf). The ultimate objective of this convention is to avoid dangerous climate change, a target that can be operationalized with the help of recent scientific evidence including the results presented in this Special Feature.

Now, what features establish the identity of a face; what distortions erase that identity beyond recognition? The first question can be best answered by cartoonists, whereas the second related one can be addressed in terms of mathematical mapping. An affine (i.e., linear) transformation may stretch or shear the face but cannot wipe out its character. Smooth nonlinear …


*e-mail: director@pik-potsdam.de

A. L. Swann et al., PNAS 2010, Changes in Arctic vegetation amplify high-latitude warming through the greenhouse effect

Proceedings of the National Academy of Sciences, published online before print January 7, 2010; doi: 10.1073/pnas.0913846107

Changes in Arctic vegetation amplify high-latitude warming through the greenhouse effect

Abigail L. Swann* and Inez Y. Fung (Department of Earth & Planetary Science, University of California, Berkeley, CA 94720, U.S.A.), Samuel Levis and Gordon B. Bonan (National Center for Atmospheric Research, Boulder, CO 80307, U.S.A.) and Scott C. Doney (Department of Marine Chemistry and Geochemistry, Woods Hole Oceanographic Institution, Woods Hole, MA 02543, U.S.A.)

Contributed by Inez Y. Fung, December 4, 2009 (sent for review October 20, 2009)

Abstract

Arctic climate is projected to change dramatically in the next 100 years and increases in temperature will likely lead to changes in the distribution and makeup of the Arctic biosphere. A largely deciduous ecosystem has been suggested as a possible landscape for future Arctic vegetation and is seen in paleo-records of warm times in the past. Here we use a global climate model with an interactive terrestrial biosphere to investigate the effects of adding deciduous trees on bare ground at high northern latitudes. We find that the top-of-atmosphere radiative imbalance from enhanced transpiration (associated with the expanded forest cover) is up to 1.5 times larger than the forcing due to albedo change from the forest. Furthermore, the greenhouse warming by additional water vapor melts sea-ice and triggers a positive feedback through changes in ocean albedo and evaporation. Land surface albedo change is considered to be the dominant mechanism by which trees directly modify climate at high-latitudes, but our findings suggest an additional mechanism through transpiration of water vapor and feedbacks from the ocean and sea-ice.

*Correspondence e-mail: aswann@atmos.berkeley.edu

Link to abstract:  http://www.pnas.org/content/early/2010/01/06/0913846107.abstract

Link to open access article:  http://www.pnas.org/content/early/2010/01/06/0913846107.full.pdf+html