Arctic sea ice reached its annual maximum extent on March 21, after a brief surge in extent mid-month. Overall the 2014 Arctic maximum was the fifth lowest in the 1978 to 2014 record. Antarctic sea ice reached its annual minimum on February 23, and was the fourth highest Antarctic minimum in the satellite record. While this continues a strong pattern of greater-than-average sea ice extent in Antarctica for the past two years, Antarctic sea ice remains more variable year-to-year than the Arctic.
Overview of conditions

Figure 1. Arctic sea ice extent for March 2014 was 14.80 million square kilometers (5.70 million square miles). The magenta line shows the 1981 to 2010 median extent for that month. The black cross indicates the geographic North Pole. Sea Ice Index data. About the data.
Credit: National Snow and Ice Data Center
High-resolution image
Credit: National Snow and Ice Data Center
High-resolution image
Arctic sea ice extent for March 2014 averaged 14.80 million square kilometers (5.70 million square miles). This is 730,000 square kilometers (282,000 square miles) below the 1981 to 2010 average extent, and 330,000 square kilometers (127,000 square miles) above the record March monthly low, which happened in 2006. Extent remains slightly below average in the Barents Sea and the Sea of Okhotsk, but is at near-average levels elsewhere. Extent hovered around two standard deviations below the long-term average through February and early March. The middle of March by contrast saw a period of fairly rapid expansion, temporarily bringing extent to within about one standard deviation of the long-term average.
Conditions in context
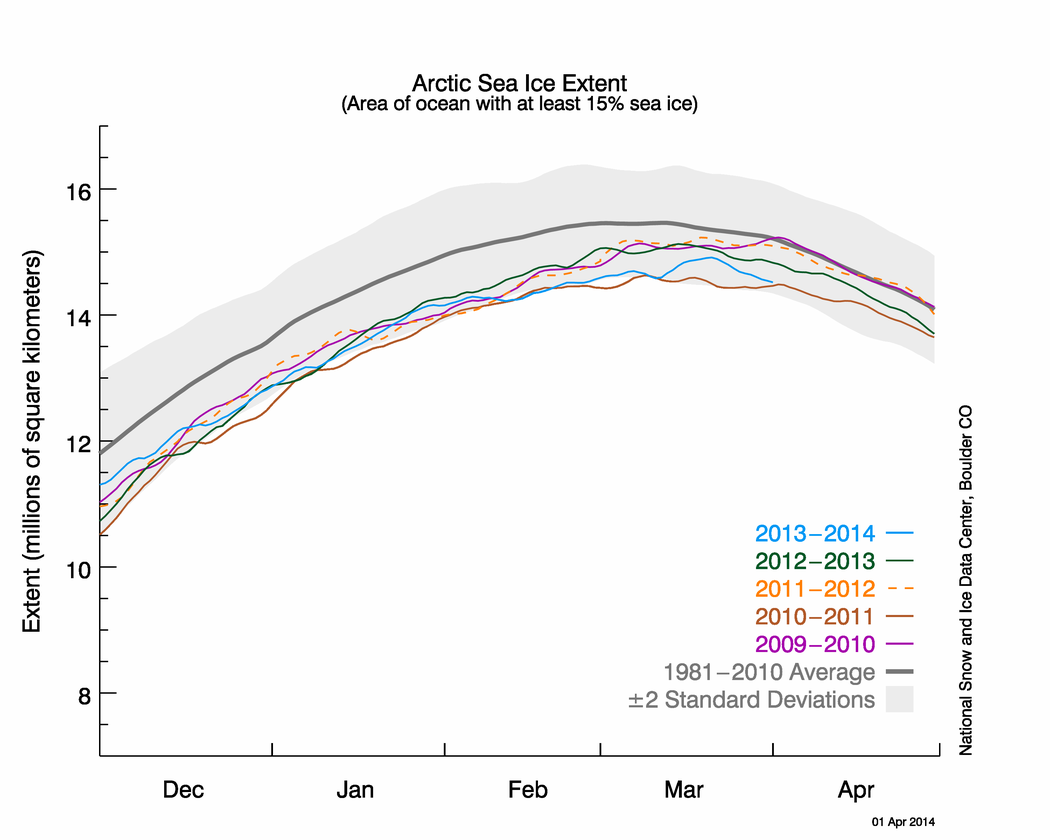
Figure 2. The graph above shows Arctic sea ice extent as of April 1, 2014, along with daily ice extent data for four previous years. 2013 to 2014 is shown in blue, 2012 to 2013 in green, 2011 to 2012 in orange, 2010 to 2011 in brown, and 2009 to 2010 in purple. The 1981 to 2010 average is in dark gray. Sea Ice Index data.
Credit: National Snow and Ice Data Center
High-resolution image
Credit: National Snow and Ice Data Center
High-resolution image
In the Arctic, the maximum extent for the year is reached on average around March 9. However, the timing varies considerably from year to year. This winter the ice cover continued to expand until March 21, reaching 14.91 million square kilometers (5.76 million square miles), making it both the fifth lowest maximum and the fifth latest timing of the maximum since 1979. The latest timing of the maximum extent was on March 31, 2010 and the lowest maximum extent occurred in 2011 (14.63 million square kilometers or 5.65 million square miles).
The late-season surge in extent came as the Arctic Oscillation turned strongly positive the second week of March. This was associated with unusually low sea level pressure in the eastern Arctic and the northern North Atlantic. The pattern of surface winds helped to spread out the ice pack in the Barents Sea where the ice cover had been anomalously low all winter. Northeasterly winds also helped push the ice pack southwards in the Bering Sea, another site of persistently low extent earlier in the 2013 to 2014 Arctic winter. Air temperatures however remained unusually high throughout the Arctic during the second half of March, at 2 to 6 degrees Celsius (4 to 11 degrees Fahrenheit) above the 1981 to 2010 average.
March 2014 compared to previous years

Figure 3. Monthly March ice extent for 1979 to 2014 shows a decline of 2.6% per decade relative to the 1981 to 2010 average. Credit: National Snow and Ice Data Center. High-resolution image
Average ice extent for March 2014 was the fifth lowest for the month in the satellite record. Through 2014, the linear rate of decline for March ice extent is 2.6% per decade relative to the 1981 to 2010 average.
An increase in multiyear ice
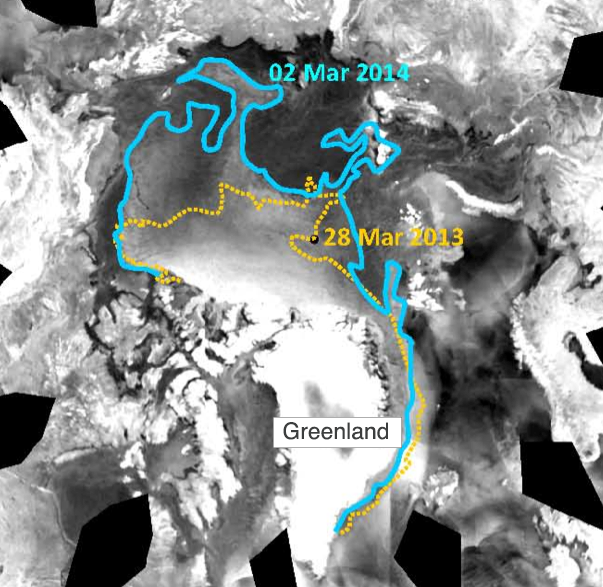
Figure 4. Imagery from the European Advanced Scatterometer (ASCAT) show the distribution of multiyear ice compared to first year ice for March 28, 2013 (yellow line) and March 2, 2014 (blue line).
Credit: Advanced Scatterometer imagery courtesy NOAA NESDIS, analysis courtesy T. Wohlleben, Canadian Ice Service
High-resolution image
Credit: Advanced Scatterometer imagery courtesy NOAA NESDIS, analysis courtesy T. Wohlleben, Canadian Ice Service
High-resolution image
The extent of multiyear ice within the Arctic Ocean is distinctly greater than it was at the beginning of last winter. During the summer of 2013, a larger fraction of first-year ice survived compared to recent years. This ice has now become second-year ice. Additionally, the predominant recirculation of the multiyear ice pack within the Beaufort Gyre this winter and a reduced transport of multiyear ice through Fram Strait maintained the multiyear ice extent throughout the winter.
In Figure 4, Advanced Scatterometer (ASCAT) imagery reveals the distribution of multiyear ice compared to first year ice for March 28, 2013 (yellow line) and March 2, 2014 (blue line). The ASCAT sensor measures the radar–frequency reflection brightness of the sea ice at a few kilometers resolution. Sea ice radar reflectivity is sensitive to the roughness of the ice and the presence of saltwater droplets within newer ice (and, later in the season, the presence of surface melt). Thus older and more deformed multiyear ice appears white or light grey (more reflection), whereas younger, first-year ice looks dark grey and/or black.
Ice age tracking confirms large increase in multiyear ice
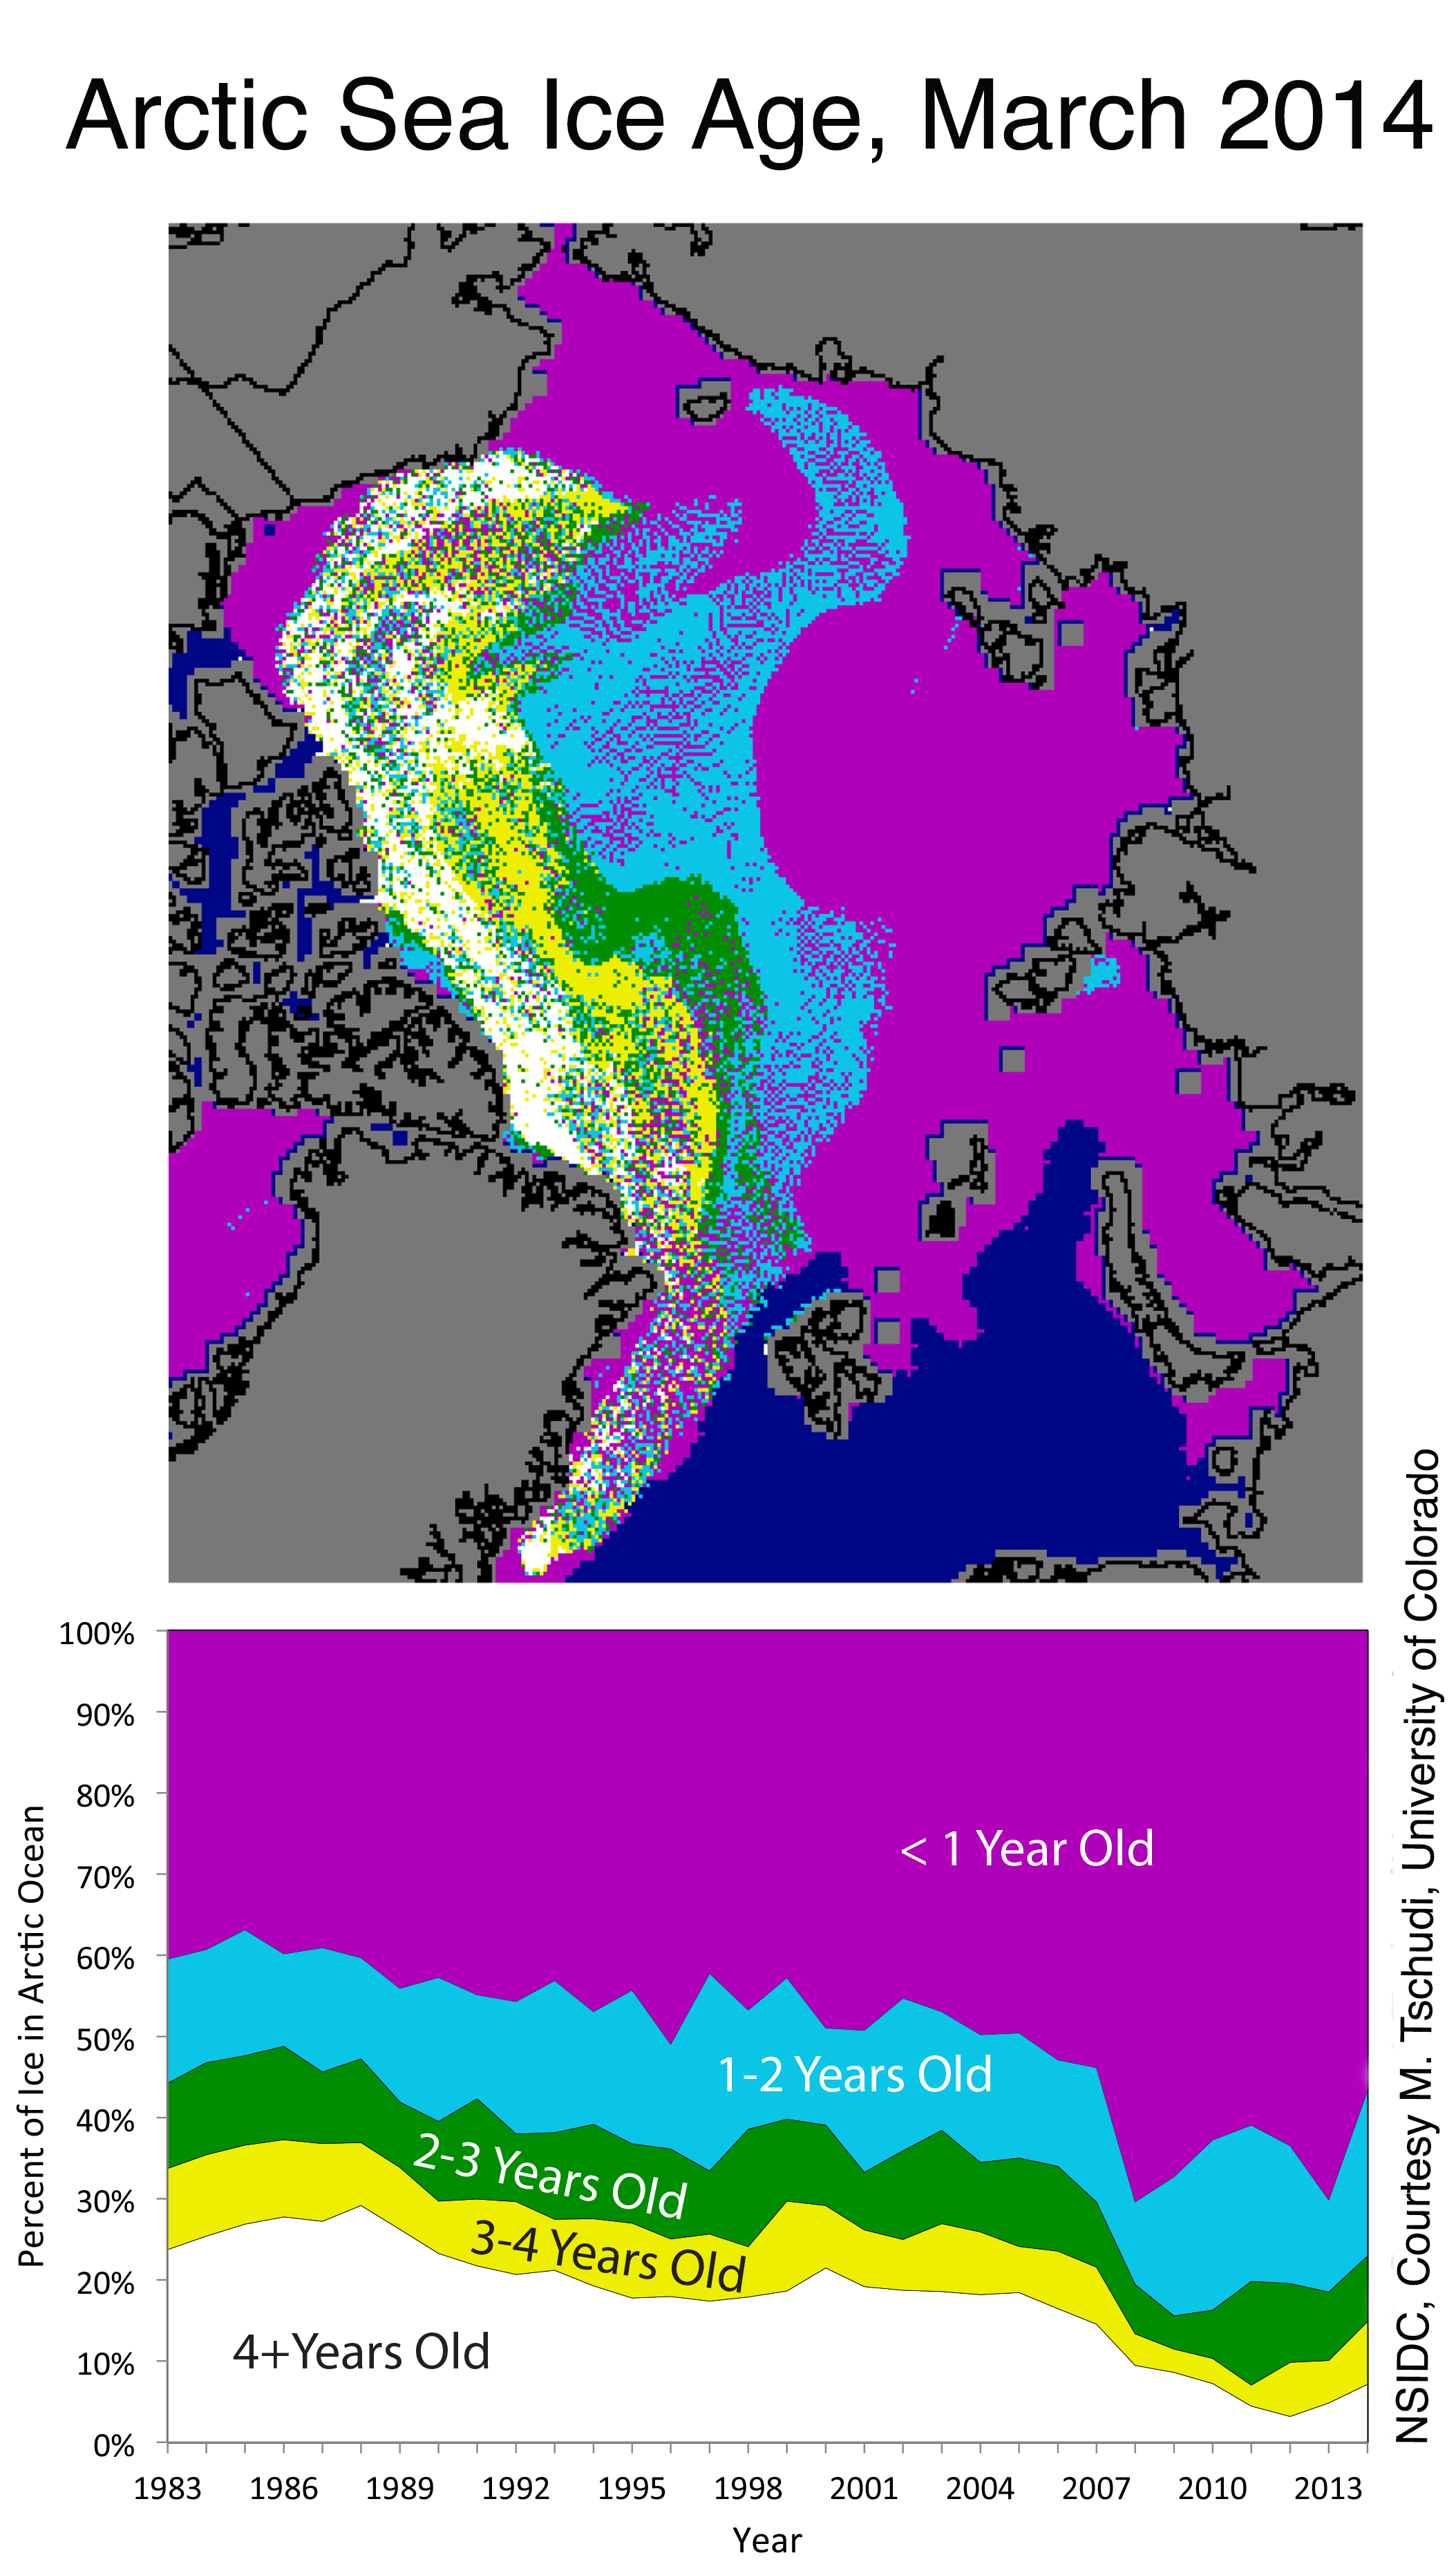
Figure 5. The map at top shows the ages of ice in the Arctic at the end of March 2014; the bottom graph shows how the percentage of ice in each age group has changed from 1983 to 2014.
Credit: NSIDC, Courtesy M. Tschudi, University of Colorado. High-resolution image
Credit: NSIDC, Courtesy M. Tschudi, University of Colorado. High-resolution image
Satellite data on ice age reveal that multiyear ice within the Arctic basin increased from 2.25 to 3.17 million square kilometers (869,000 to 1,220,000 square miles) between the end of February in 2013 and 2014. This winter the multiyear ice makes up 43% of the icepack compared to only 30% in 2013. While this is a large increase, and may portend a more extensive September ice cover this year compared to last year, the fraction of the Arctic Ocean consisting of multiyear ice remains less than that at the beginning of the 2007 melt season (46%) when a large amount of the multiyear ice melted. The percentage of the Arctic Ocean consisting of ice at least five years or older remains at only 7%, half of what it was in February 2007. Moreover, a large area of the multiyear ice has drifted to the southern Beaufort Sea and East Siberian Sea (north of Alaska and the Lena River delta), where warm conditions are likely to exist later in the year.
Satellite Observations of Arctic Change
NSIDC now offers a new Web site, Satellite Observations of Arctic Change (SOAC) with interactive maps of the Arctic based on NASA satellite and related data. The site allows you to explore how conditions in the Arctic have changed over time. Data sets include air temperature, water vapor, sea ice, snow cover, NDVI, soil freezing, and exposed snow and ice. Time periods vary by data set, but range from 1979 to 2013. You can animate a time series, zoom in or out, and view a bar graph of anomalies over time. Links to the source data and documentation are also included. Additional pages provide brief scientific discussion, and overviews of the scientific importance of these data. SOAC was developed with support from NASA Earth Sciences.
Reference
Stroeve, J., L. Hamilton, C. M. Bitz, and E. Blanchard-Wrigglesworth. 2014. Predicting September Sea Ice: Ensemble Skill of the SEARCH Sea Ice Outlook 2008–2013. Geophysical Research Letters, Accepted, doi: 10.1002/2014GL059388.


No comments:
Post a Comment