A rapid freeze-up
NSIDC, November 2, 2011
Arctic sea ice extent increased rapidly through October, as is typical this time of year. Large areas of open water were still present in the Beaufort and Chukchi seas at the end of the month. The open water contributed to unusually warm conditions along the coast of Siberia and in the Beaufort and Chukchi seas.
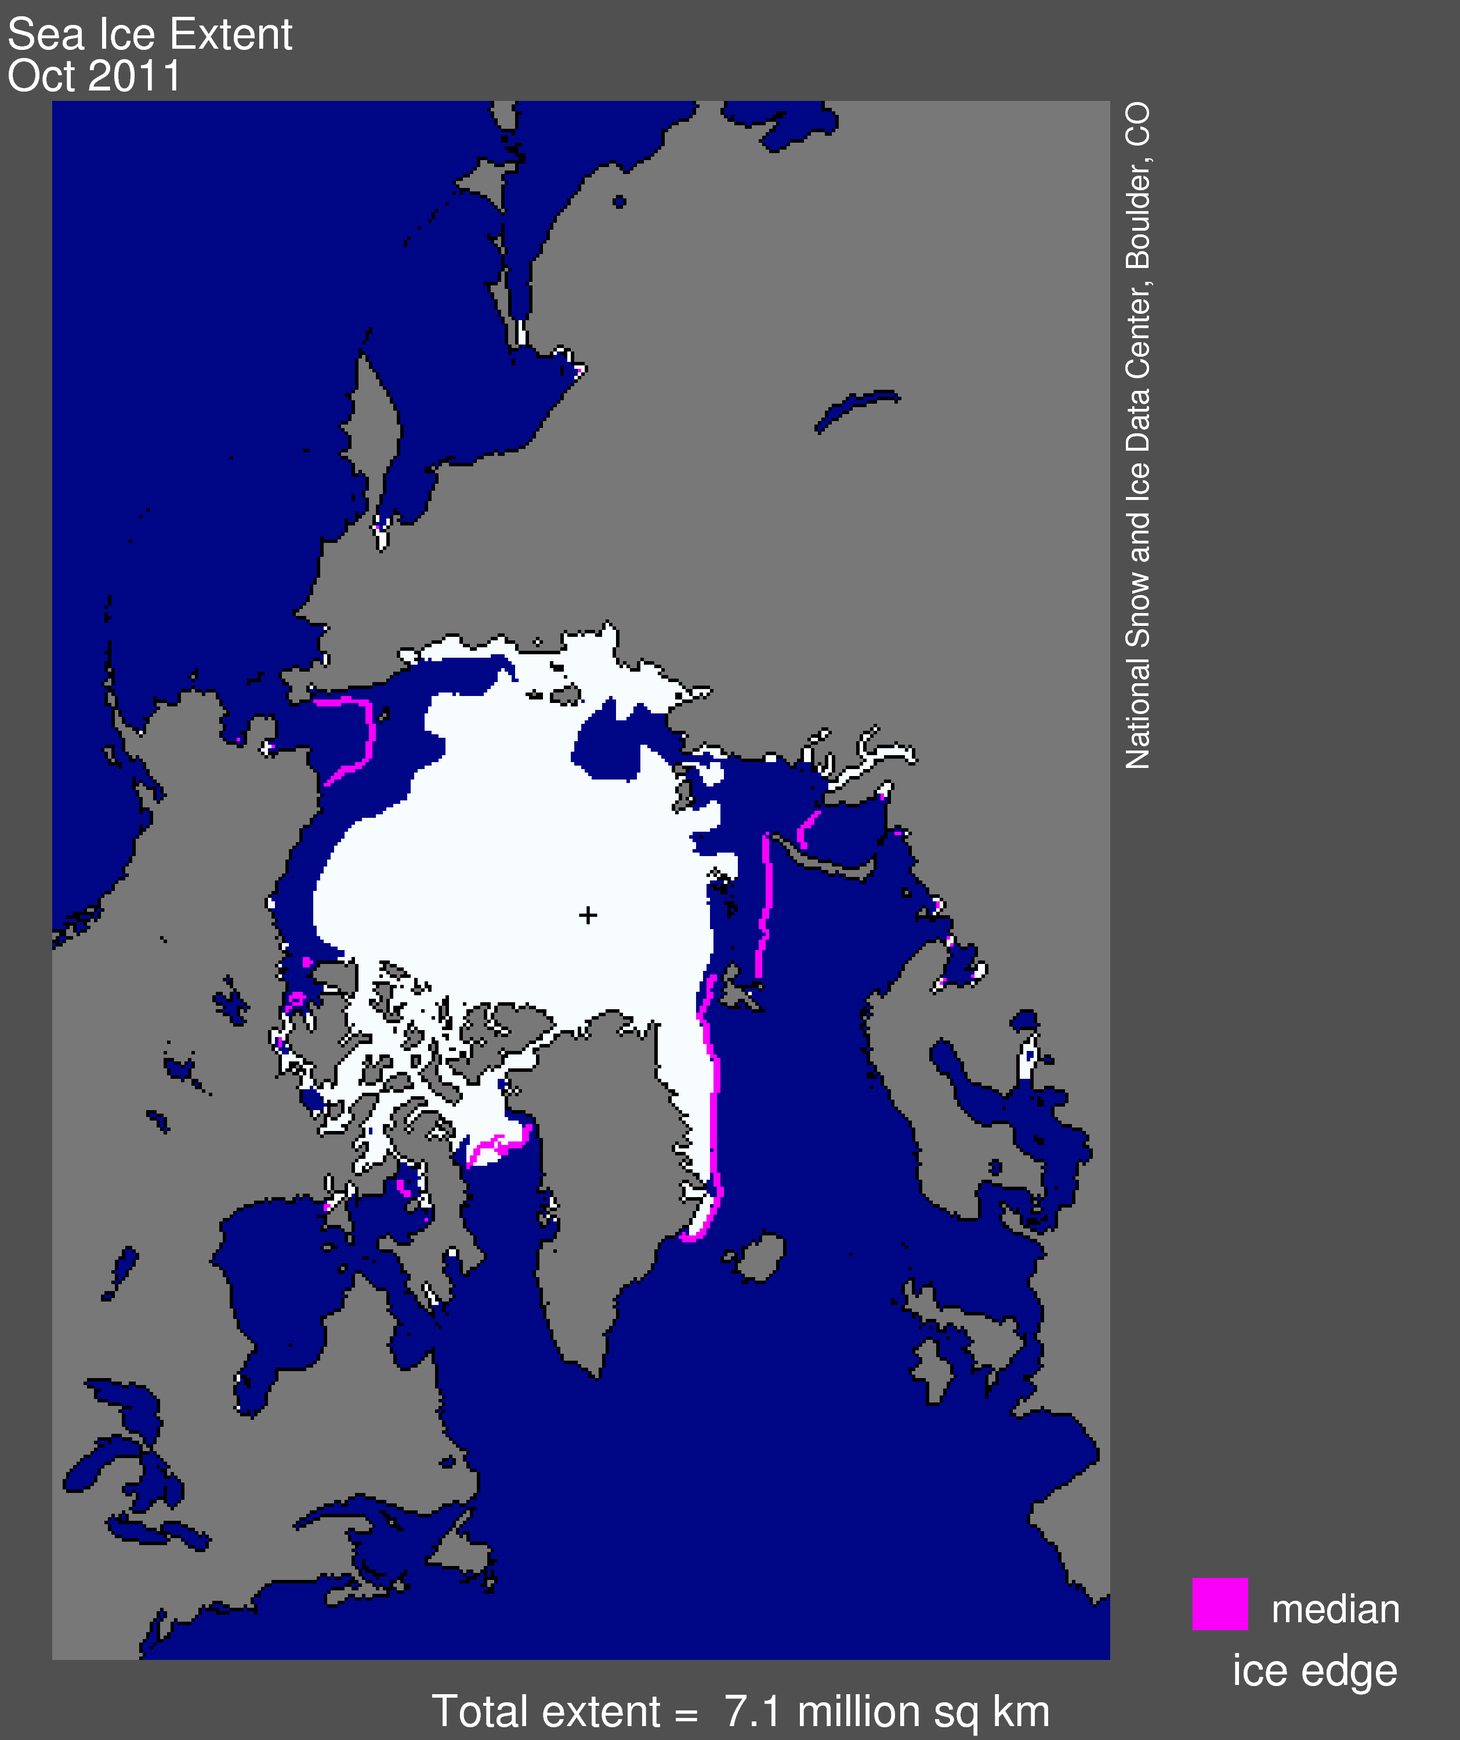
Figure 1. Arctic sea ice extent for October 2011 was 7.10 million square kilometers (2.74 million square miles). The magenta line shows the 1979 to 2000 median extent for that month. The black cross indicates the geographic North Pole. Sea Ice Index data. —Credit: National Snow and Ice Data Center. High-resolution image
Overview of conditions
Average ice extent for October 2011 was 7.10 million square kilometers (2.74 million square miles), 2.19 million square kilometers (846,000 square miles) below the 1979 to 2000 average. This was 330,000 square kilometers (127,000 square miles) above the average for October 2007, the lowest extent in the satellite record for that month. By the end of October, ice extent remained below the 1979 to 2000 average in the Beaufort and Chukchi seas and in the Barents and Kara seas. Extent was near average in the East Greenland Sea. New ice growth has closed both the Northwest Passage and the Northern Sea Route.
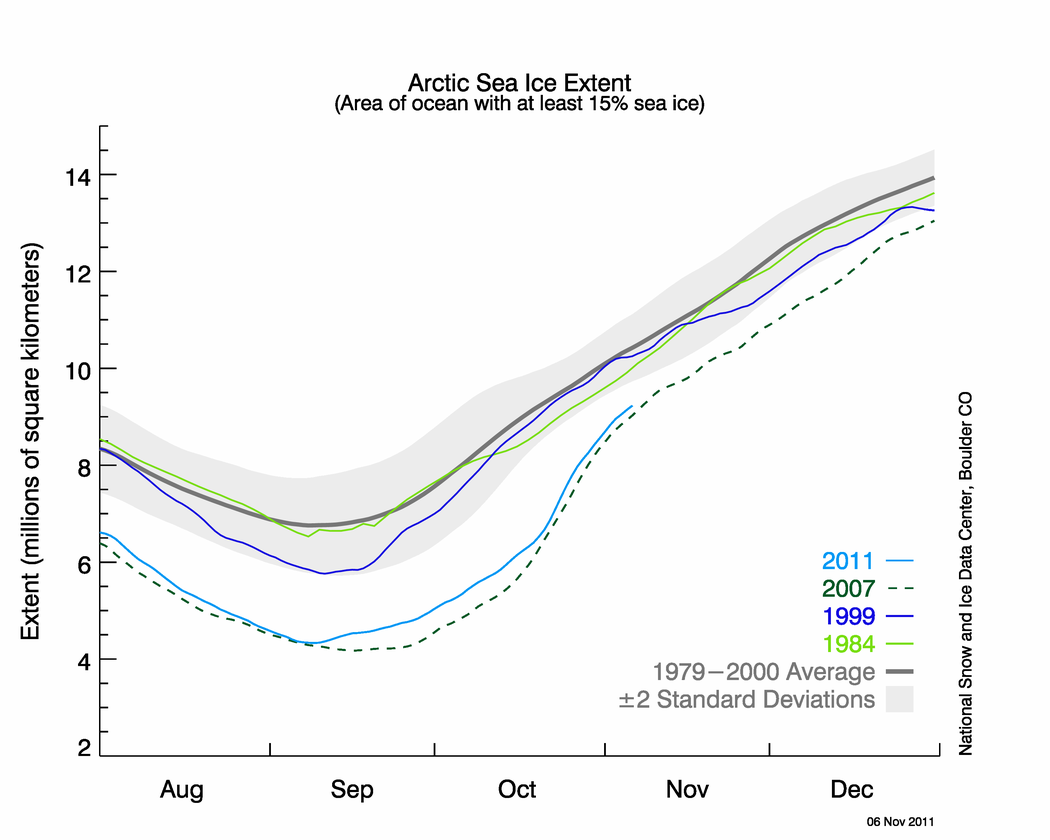
Figure 2. The graph above shows daily Arctic sea ice extent as of October 31, 2011, along with the lowest ice extents in the preceding decades, 1984 and 1999. 2011 is shown in light blue. 2007, the year with the record low minimum, is dashed green. Purple indicates 1999 and light green shows 1984. The gray area around the average line shows the two standard deviation range of the data. Sea Ice Index data. —Credit: National Snow and Ice Data Center . High-resolution image
Arctic sea ice extent increased rapidly through October. Ice extent during October 2011 increased at an average rate of 114,900 square kilometers (44,360 square miles) per day, about 40% faster than the average growth rate for October 1979 to 2000. On October 30, Arctic sea ice extent was 8.41 million square kilometers (3.25 million square miles), 226,000 square kilometers (87,300 square miles) more than the ice extent on October 30, 2007, the lowest extent on that date in the satellite record.
During the month of October, the freeze-up that begins in September kicks into high gear. The rate of freeze-up depends on several factors including the atmospheric conditions and the amount of heat in the ocean that was accumulated during the summer. However, each decade, the October extent has started from a lower and lower point, with the record low extent during the 1980s (1984) substantially higher than the record low extent during the 1990s (1999), which in turn is substantially higher than the record low extent during the 2000s (2007).
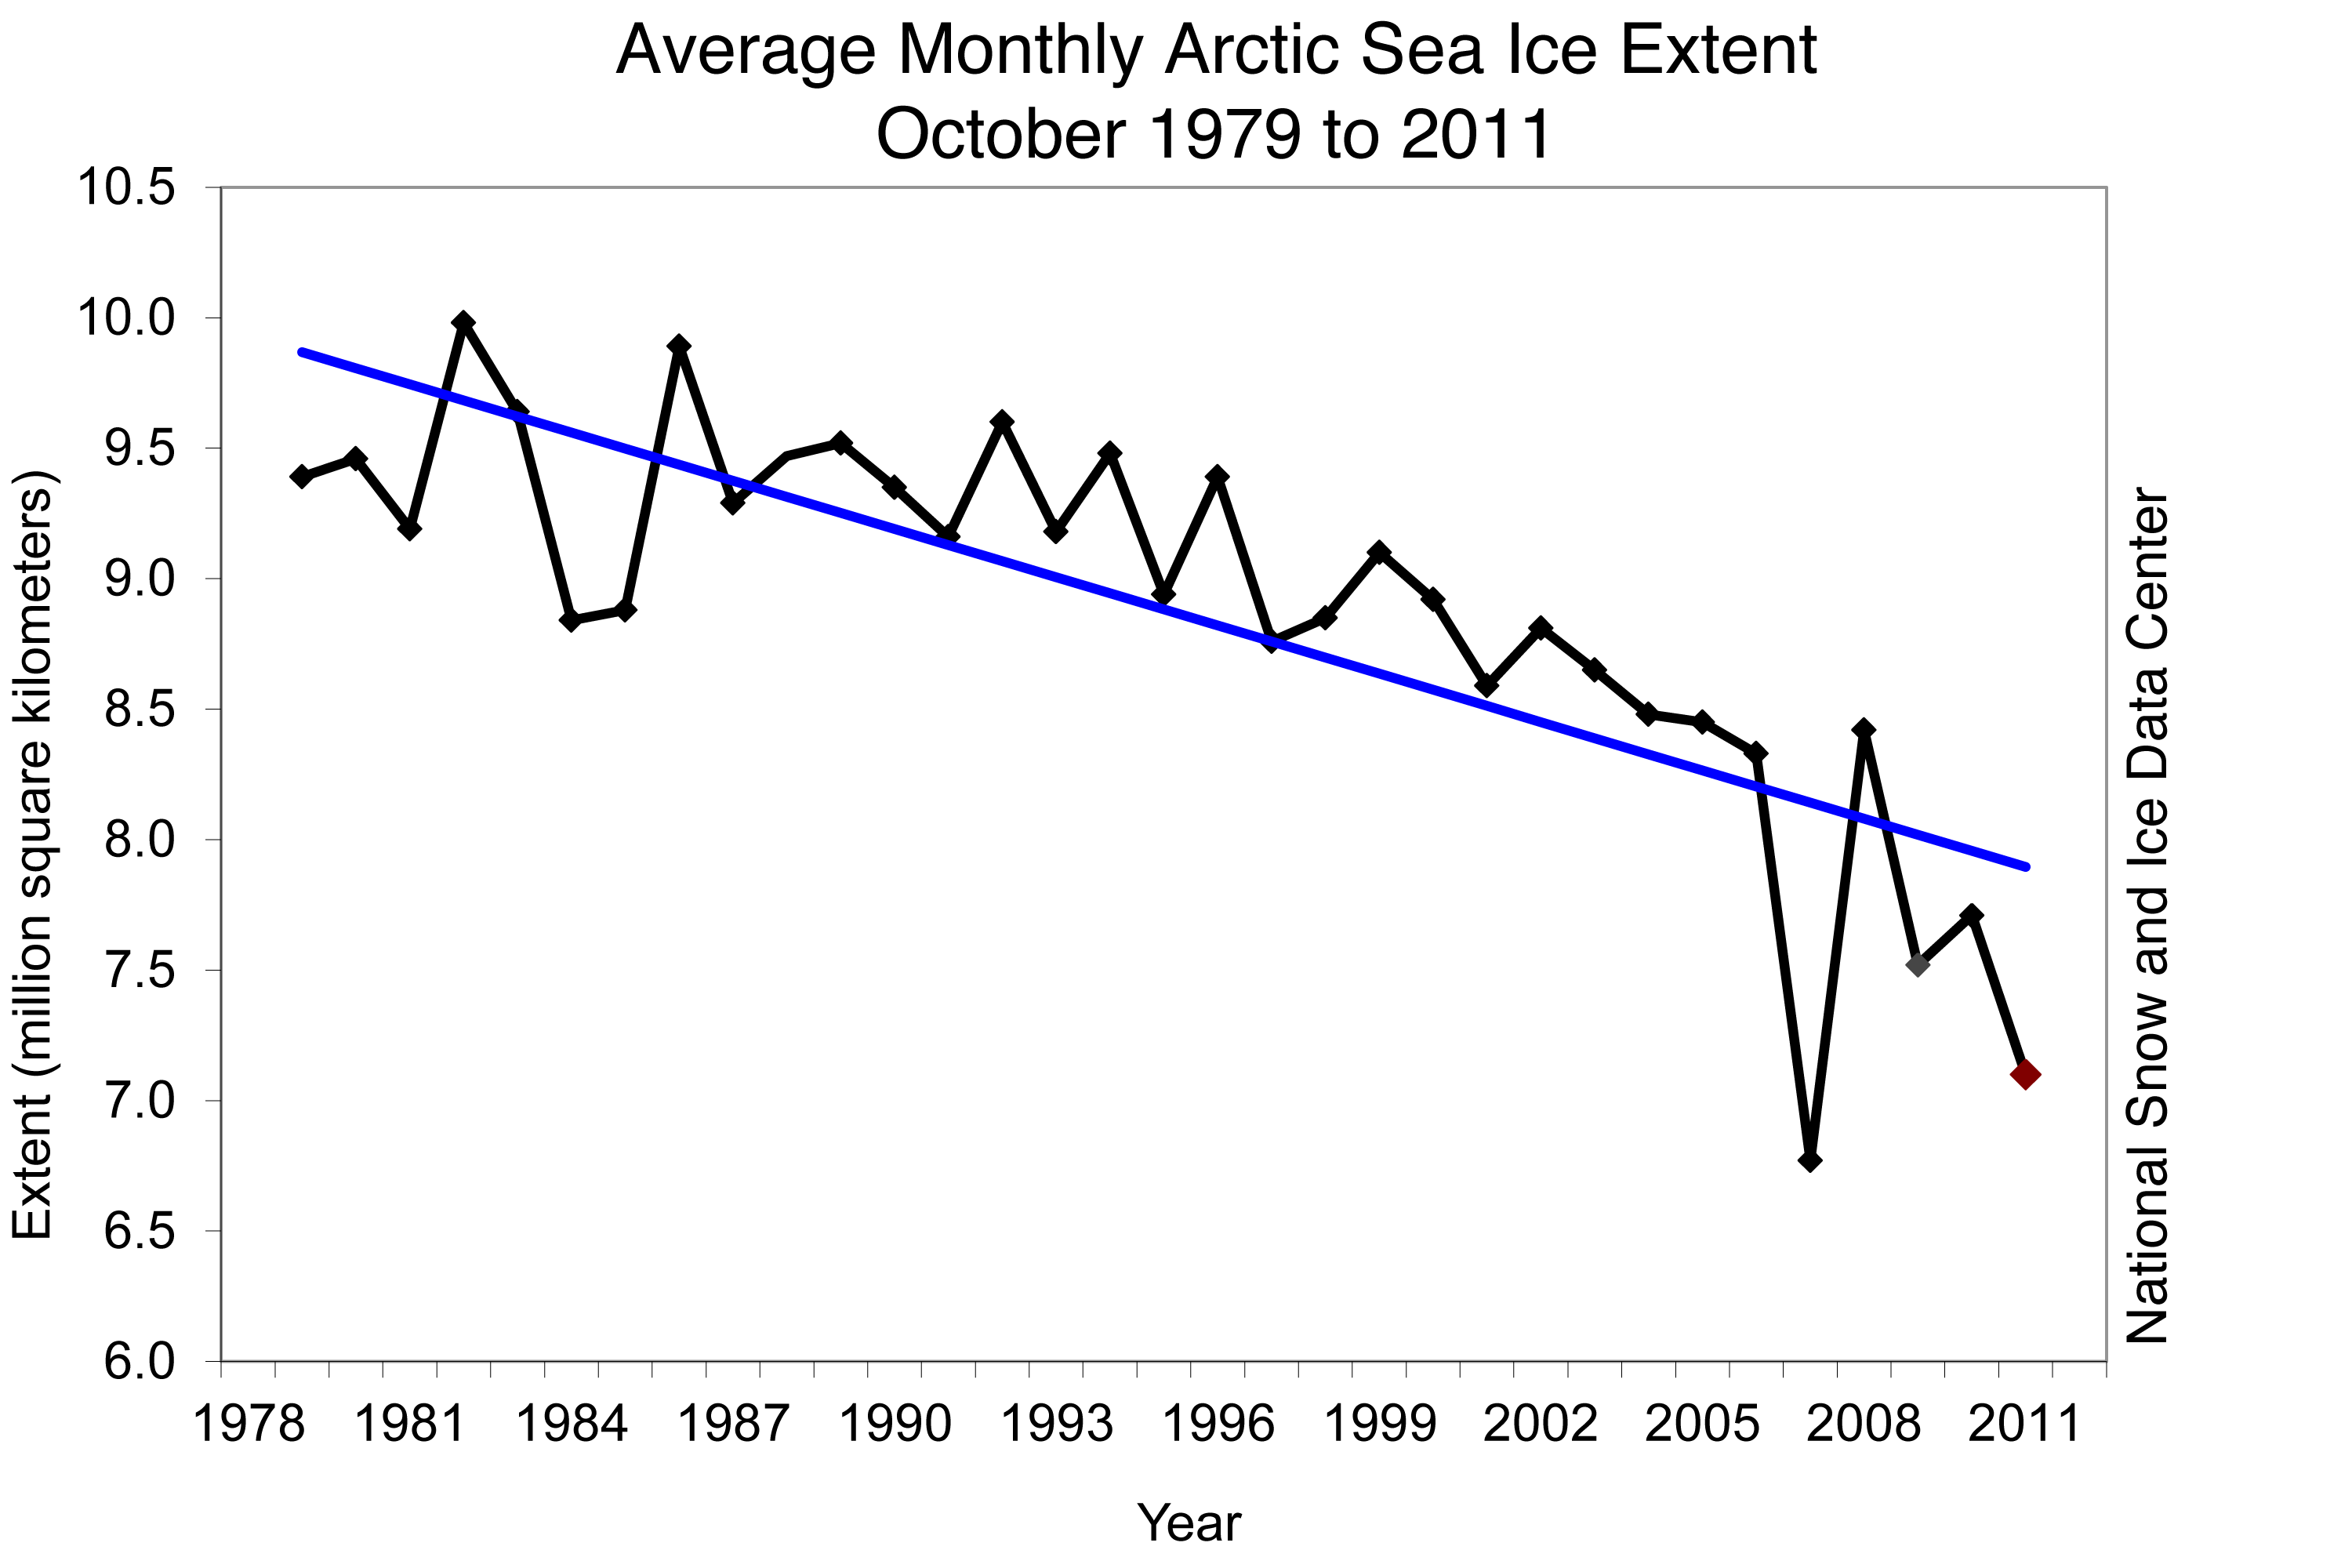
Figure 3. Monthly October ice extent for 1979 to 2011 shows a decline of 6.6% per decade. —Credit: National Snow and Ice Data Center . High-resolution image
Ice extent for October 2011 was the second lowest in the satellite record for the month, behind 2007. The linear rate of decline for October over the satellite record is now -61,700 square kilometers (-23,800 square miles) per year, or -6.6% per decade relative to the 1979 to 2000 average.
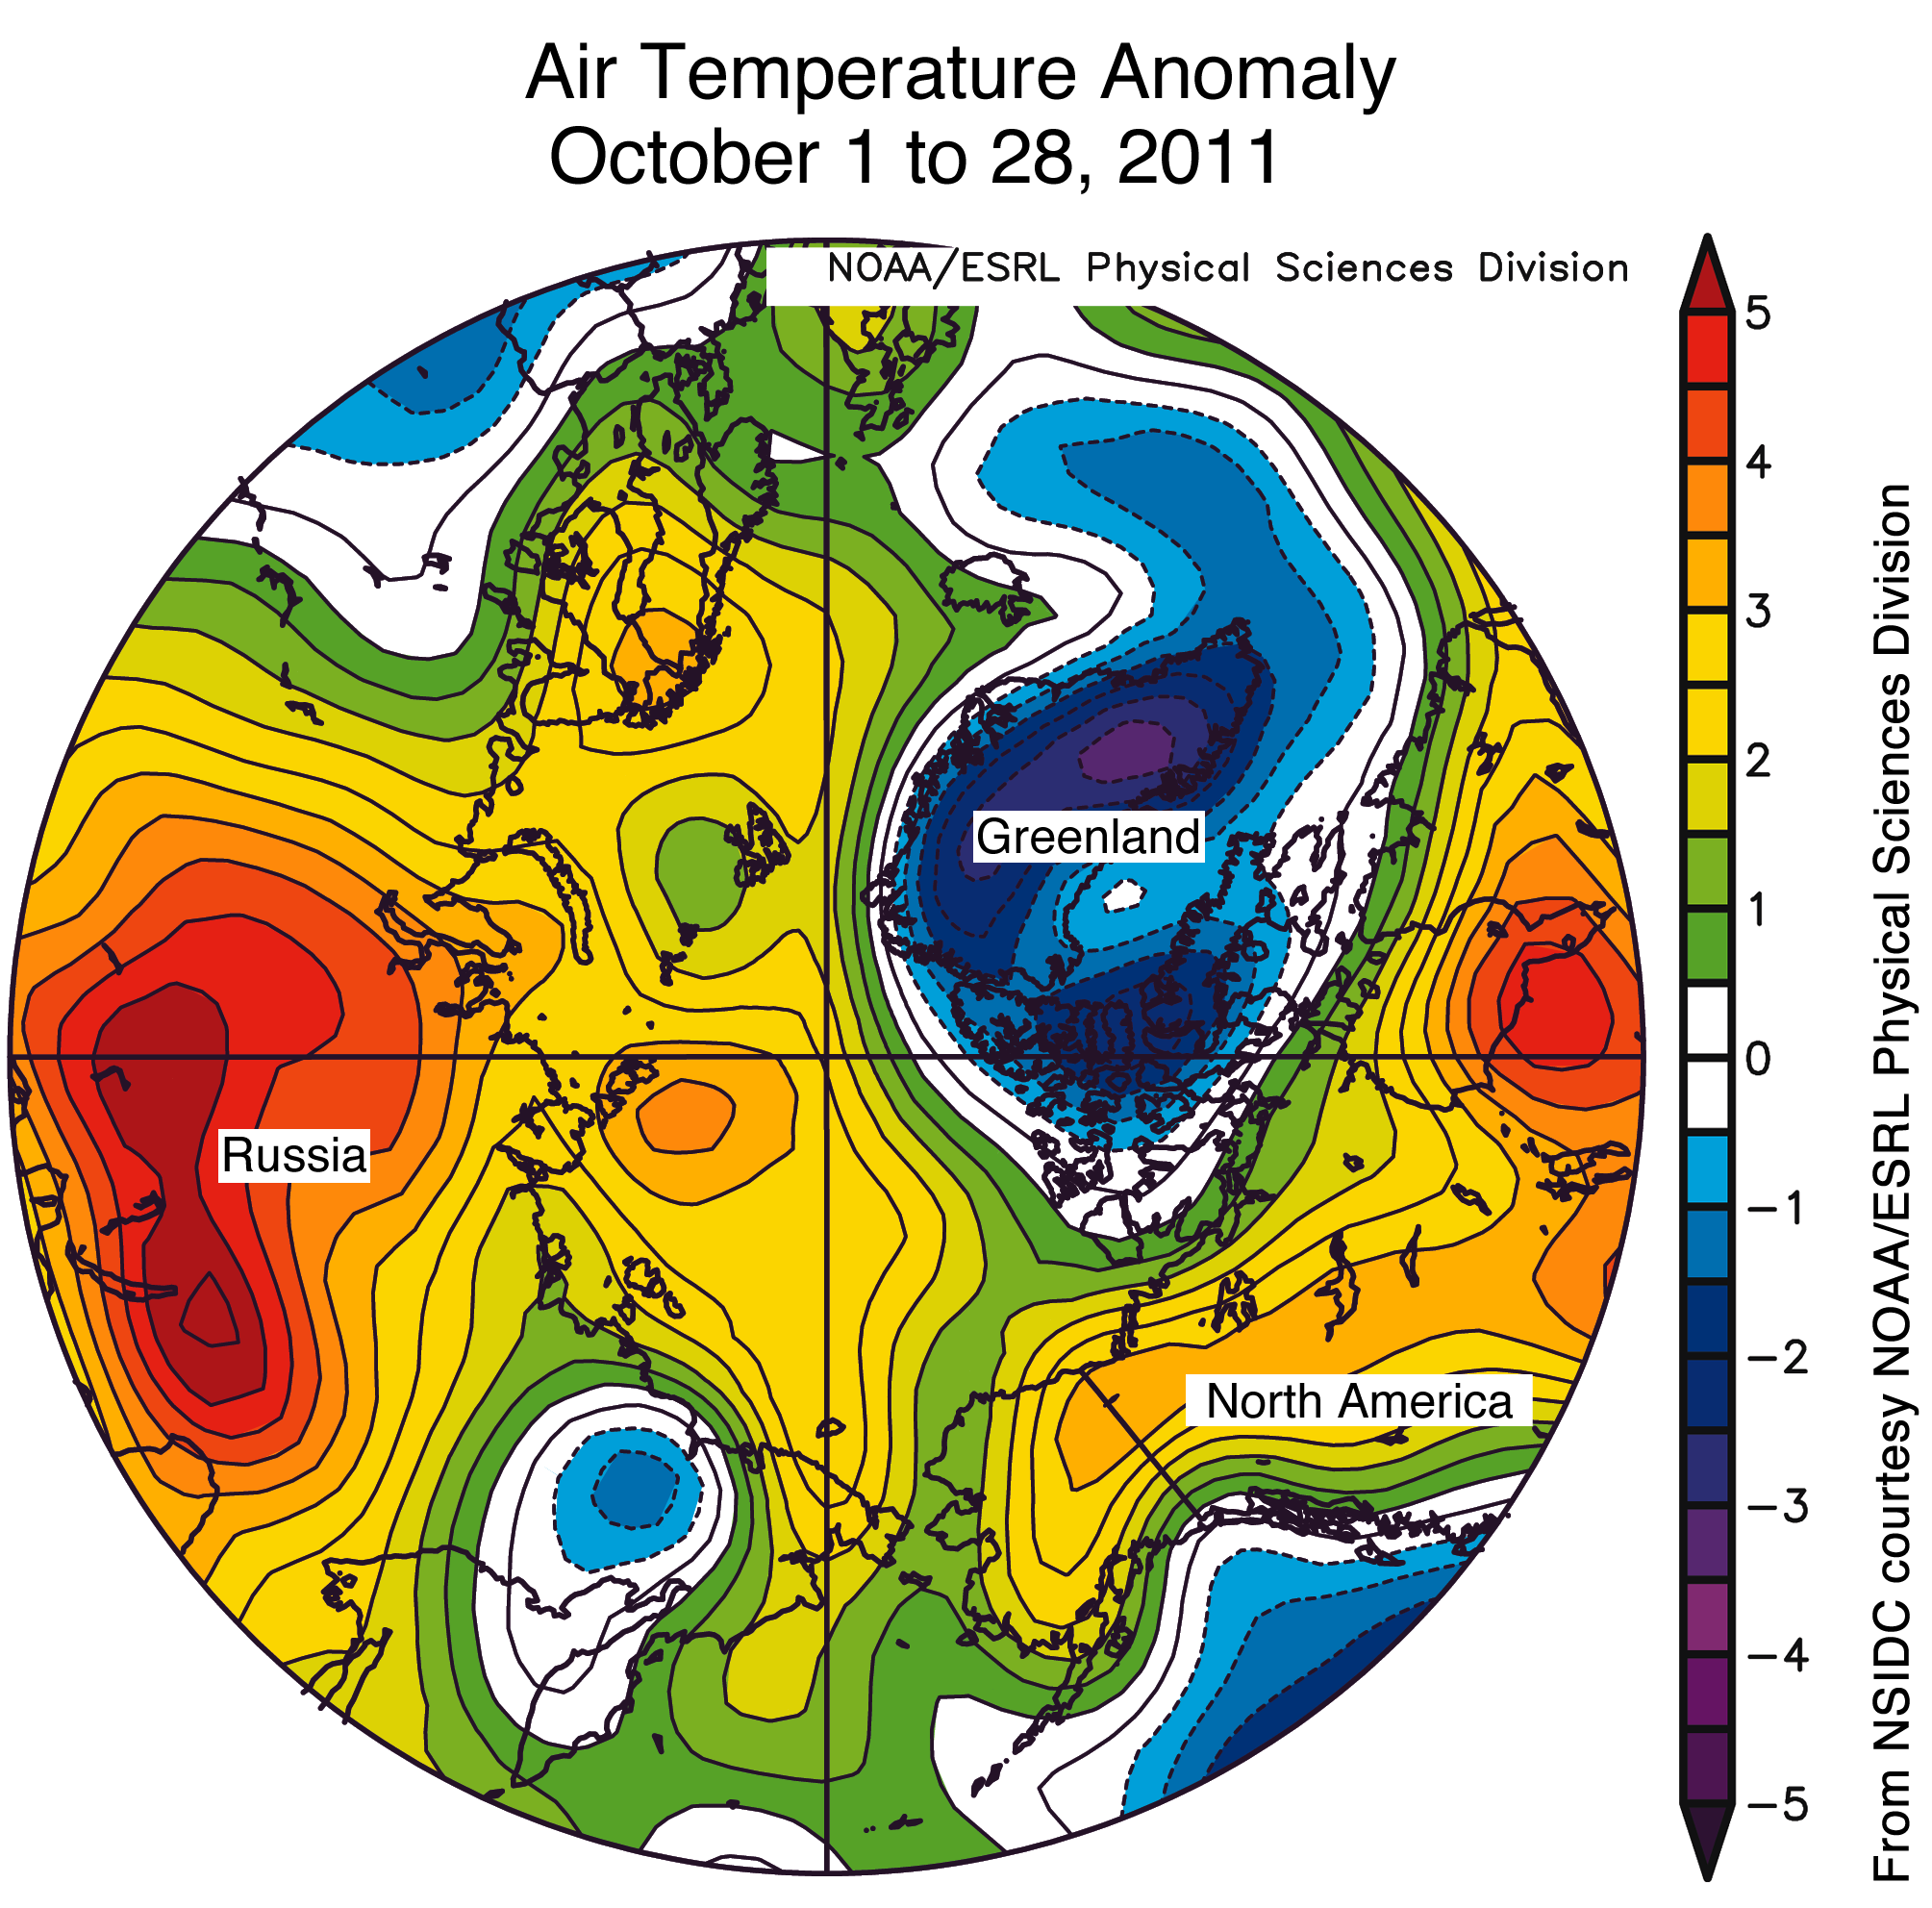
Figure 4. This map of air temperature anomalies at the 925 hPa level (approximately 3,000 feet) for October 2011 shows unusually high temperatures over most of the Arctic Ocean (yellow shading) and unusually low temperatures over the eastern Canadian Arctic Archipelago and Greenland (blue shading). —Credit: National Snow and Ice Data Center . High-resolution image
In recent years, low sea ice extent in the summer has been linked to unusually warm temperatures at the surface of the Arctic Ocean in the fall. This pattern appeared yet again this fall.
Air temperatures over most of the Arctic Ocean for October 2011 ranged from 1 to 4 degrees Celsius (1.8 to 7.2 degrees Fahrenheit) above average, measured at the 925 millibar level, about 1,000 meters or 3,000 feet above the surface. However, over the eastern Canadian Arctic and Greenland, temperatures were as much as 3 degrees Celsius (5.4 degrees Fahrenheit) below average.
These temperature anomalies in part reflect a pattern of above-average sea level pressure centered over the northern Beaufort Sea, and lower than average sea level pressure extending across northern Eurasia. This pattern is linked to persistence of the positive phase of the Arctic Oscillation through most of the month. These pressure and temperature anomalies tend to bring in heat from the south, warming the Eurasian coast, but they also lead to cold northerly winds over the eastern Canadian Arctic Archipelago. However, along the Siberian coast and in the Beaufort and Chukchi seas, warmer temperatures came primarily from the remaining areas of open water in the region, as heat escaped from the water. These effects are more strongly apparent in the surface air temperatures: average October temperatures in the region were 5 to 8 degrees Celsius (9.0 to 14.4 degrees Fahrenheit) above average.
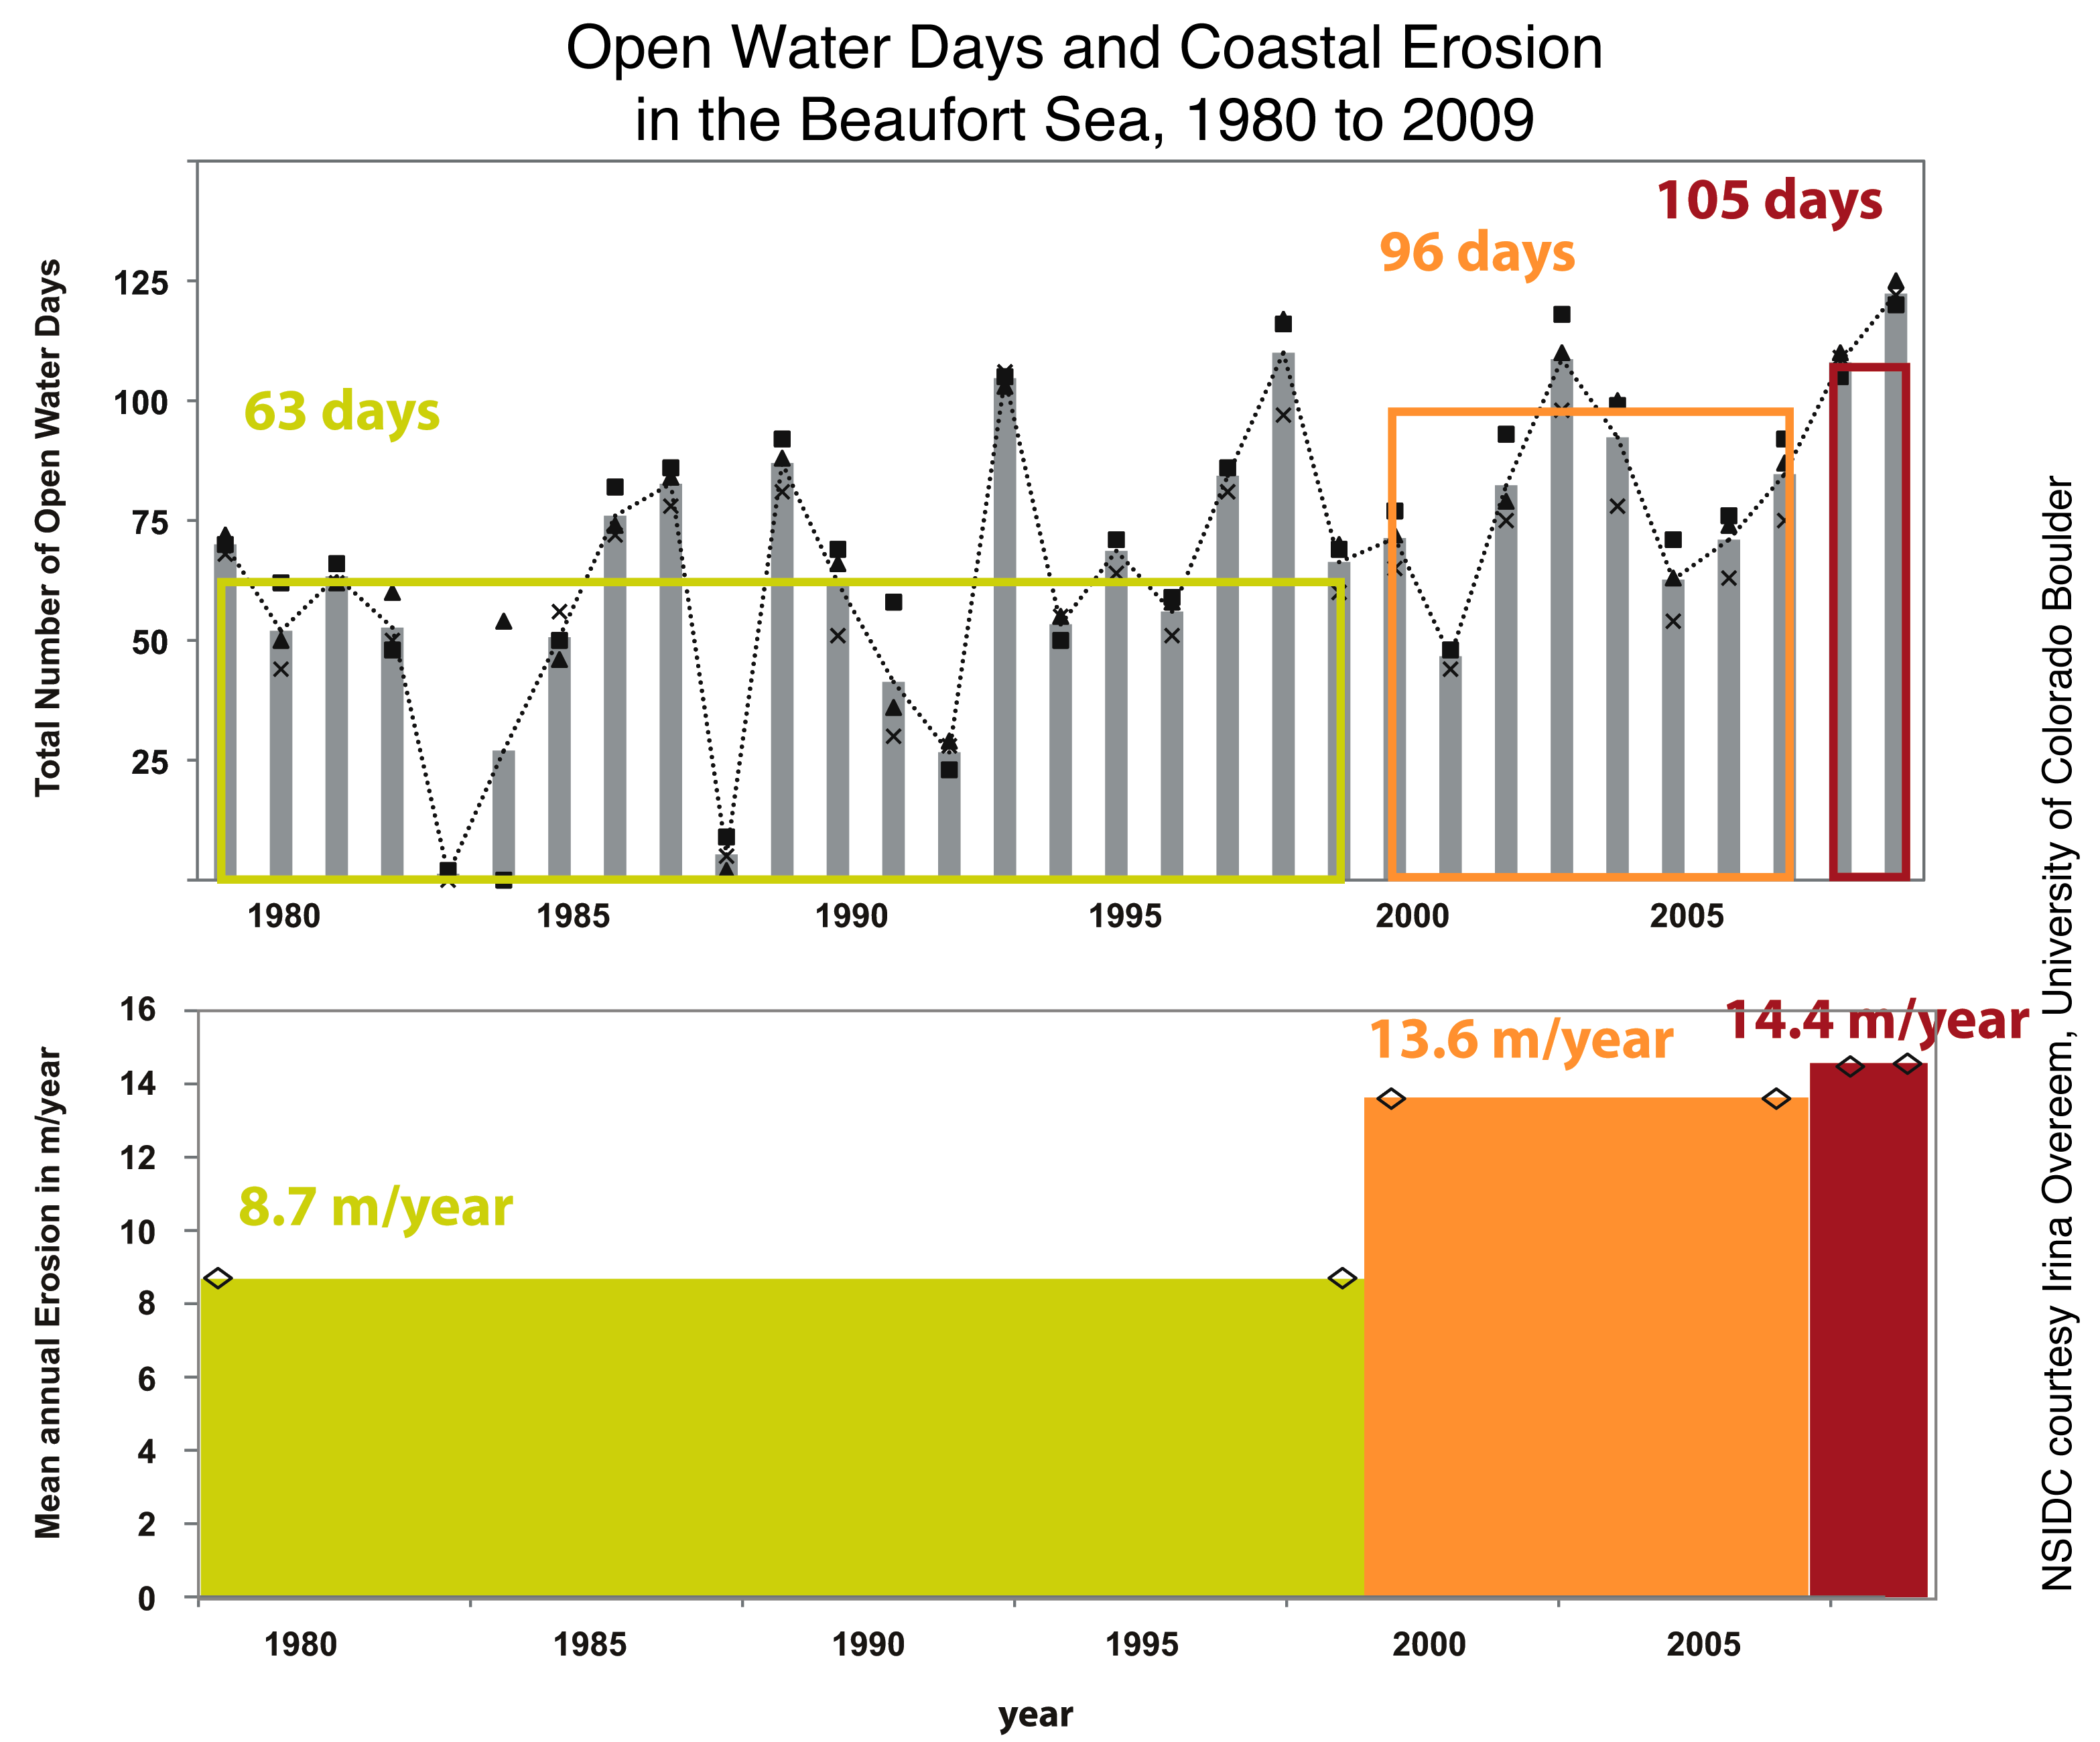
Figure 5. The top panel of this figure shows the number of open water days for the approximate 75 kilometer (46.6 mi) coastal zone along the Beaufort Sea (data for each year and linear trend). The bottom panel shows the average annual coastal erosion rate for three periods, 1979-1999, 2000-2007 and 2008-2009. —Credit: NSIDC courtesy Irina Overeem, CU Boulder. High-resolution image
Sea ice loss and coastal erosion
Declining sea ice in the Arctic has led to increasing erosion rates along the coast of the Beaufort Sea over the past fifty years, according to a new study led by Irina Overeem of the University of Colorado Institute for Arctic and Alpine Research (INSTAAR). Their study used a wave model driven by sea ice position and wind data.
As the period of open water on the coast of the Beaufort Sea has increased, so has the mean annual erosion rate, the study showed. From 1979 to 1999, the average erosion rate was 8.5 meters (27.9 feet) per year. The average rate over the period 2000 to 2007 was 13.6 meters (44.6 feet) per year, while the rate for the last two years of the record, 2008 to 2009, was 14.4 meters (47.2 feet) per year.
With a longer open water season, ocean water warms more and waves eat away at the coastline. The sediments comprising the coastal bluffs are locked together by permafrost—hard frozen ground with a concrete-like consistency. As the waves lap at the permafrost, they also help to thaw it, making the ground much more vulnerable to erosion.
Further Reading
Overeem, I., R.S. Anderson, C.W. Wobus, G.D. Clow, F.E. Urban, and N. Matell. 2011: Sea ice loss enhances wave action at the Arctic coast. Geophysical Research Letters, 38, L17503, doi:10.1029/2011GL048681.
Serreze, M.C., and R.G. Barry. 2011: Processes and impacts of Arctic Amplification: A research synthesis. Global and Planetary Change, 77,85-96.


No comments:
Post a Comment