Published online 12 September 2010 | Nature | doi:10.1038/news.2010.461
News
Ocean conveyor-belt model stirred up
Analysis of temperature and salinity shakes view of global water flow
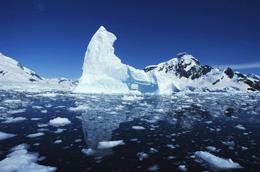 A better understanding of how vast tracts of water move through the oceans could improve climate models.Getty Images
The accepted picture of how a massive oceanic conveyor belt of water turns has been complicated by findings published today in Nature Geoscience1. The results could help to boost the precision of climate-change models.
As tropical water from the Equator flows north in the Atlantic Ocean, it becomes cooler and denser. Evaporation along the way makes it saltier and further increases its density. In the frigid Arctic, the water sinks into the depths and then moves southward; returning to the surface once it has warmed up again.
But this simplified picture of what is known as meridional overturning circulation (MOC) has been brought into question by a paper suggesting that, in the past 50 years, ocean circulation closer to the Equator has grown weaker, whereas the northern waters have flowed more strongly.
"The more we look, the more complicated the ocean is," says Susan Lozier, an oceanographer at Duke University in Durham, North Carolina, and lead author of the study.
When the conveyor-belt model was conceptualized in the 1980s, researchers understood only a rough outline of overall marine currents, she says. Because it is difficult to take measurements in the depths of the ocean, MOC models couldn't reflect the intricacy of all the factors involved.
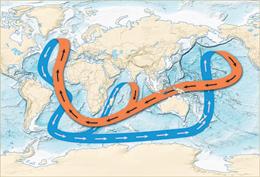 The idea that Oceanic water turns over like a conveyor belt has been questioned.Joe LeMonnier / Science/AAAS
To boost precision, Lozier and her colleagues gathered over 500,000 measurements of water temperature and salinity taken by research vessels between 1950 and 2000.
Water density increases with higher salinity and lower temperatures, so the team were able to use the data to track rates of turnover. They found that, rather than the rate being the same everywhere all the time, as was expected, the rates in the subtropical and subpolar regions were different and showed distinct changes over the 50-year period.
Hard to predict
Other measurements from recent years highlight the lack of detailed knowledge about ocean overturning. Beginning in 2004, researchers led by Stuart Cunningham, an oceanographer from the National Oceanography Centre at the University of Southampton, UK, deployed an array of instruments at various depths along the 26.5° N line of latitude to measure variations in the Atlantic Ocean's turnover. In the course of a year, they discovered as much variability as they had expected to see in 50 years2. And the overturning in this narrow 26.5°-N band wouldn't necessarily provide information about water flow in the south Atlantic or the higher latitudes, says Lozier.
The idea of the seas moving as a smooth belt is being changed by the accessibility of satellite data, says oceanographer Joël Hirschi, also at the National Oceanography Centre and a co-author of the earlier study. The essential outline remains, he says, "but on top of that conveyor picture, there is a lot of variability going on."
Hirschi compares the variation in flow to daily weather patterns in Earth's atmosphere. Modelling the MOC is like knowing the average state of the atmosphere, he says. It can provide an overall description of the climate, but the detailed, local differences will still be hard to predict.
More details would help to produce better climate-change models, he says. Because heat released from the water moving towards the pole is part of what keeps Europe warm, filling in gaps in the data could provide a more complete picture of what might happen in particular locations.
Lozier agrees, adding that as surface waters turn over, they carry whatever gases are above them down to the deep ocean, locking them out of the atmosphere. Understanding the ocean flow could help to reveal carbon dioxide sinks, she says.
"Before we can make an accurate inventory of the CO2, we need to know where to measure," she says.
References
- Lozier, M. S., Roussenov, V., Reed, M. S. C. & Williams, R. G.Nature Geosci. doi:10.1038/ngeo947 (2010).
- Cunnigham, S. A. et al. Science 317, 935-938 (2007). | Article | ChemPort |


No comments:
Post a Comment