Climate scientist bashing
A new popular sport in some media these days is “climate scientist bashing.” Instead of dealing soberly with the climate problem they prefer to attack climate scientists, i.e., the bearers of bad news. The German magazine DER SPIEGEL has played this game last week under the suggestive heading “Die Wolkenschieber” – which literally translated can mean both “the cloud movers” and “the cloud traffickers” (available in English here ). The article continues on this level, alleging “sloppy work, falsifications and exaggerations.” By doing so DER SPIEGEL digs deeply into the old relic box of “climate skeptics” and freely helps itself on their websites instead of critically researching the issues at hand.As a scientist I do not have the time to dedicate a whole day to one article and to do much research on it, which is why I here discuss only a few of the most obvious flaws and distortions of facts in this story.
Temperature data
Cynically and inhumanely the article sets off with remarks on our British colleague Phil Jones. The authors extensively revel in sentences like this:
He feels a constant tightness in his chest. He takes beta-blockers to help him get through the day. He is gaunt and his skin is pallid.
Jones is finished: emotionally, physically and professionally. He has contemplated suicide several times recently.And this is the result of a media campaign consisting of precisely such poorly researched and fact-twisting articles as this one, for which Marco Evers, Olaf Stampf and Gerald Traufetter are responsible.
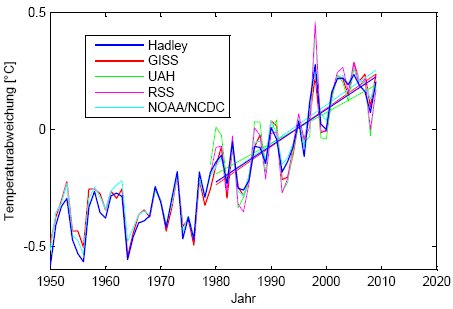
What is first greatly hyped is then gleefully destroyed. According to DER SPIEGEL “the entire profession” of climate science “based much of its work on his [Jones'] research” and “almost every internal debate among the climate popes passed through his computer.” Now it happens that I, most likely not an untypical example, have never worked with Jones’ data and have only exchanged a handful of emails (out of tens of thousands every year) with him, although I do probably count as part of the “profession”. There is a whole set of other data of global temperature, e.g., the data from NASA which is based on weather stations (and which I prefer for various reasons) or data from NOAA or the satellite data from RSS or the UAH. As is always scientifically useful, important conclusions are based not on one single set of data but on the fact that a whole range of competing scientific groups find consistent results, using different methods (see figure).

Global mean temperature (annual means) according to the 5 most often used data sets. The graph shows the deviation from the mean of the last 30 years, as well as the linear trend over the last 30 years. The data from the Hadley Center, NASA and NOAA use measurements from surface weather stations, each with its specific method of quality control (e.g., correction for heat island effects) and interpolation and spatial integration. Independently, the satellite data from RSS and UAH (available from 1979 onwards) provide two different analyses based on the same microwave raw data. These measure the temperature of the middle troposphere, the variations of which can differ from those of the surface temperatures on short time scales. The record El Niño year of 1998 is an example. It has caused a greater temperature anomaly in the troposphere, presumably as warm air rising in the tropics spread in middle altitudes. The climatic trends, however, do not differ significantly since on longer time scales the surface and tropospheric temperatures are closely coupled due to turbulent mixing processes.
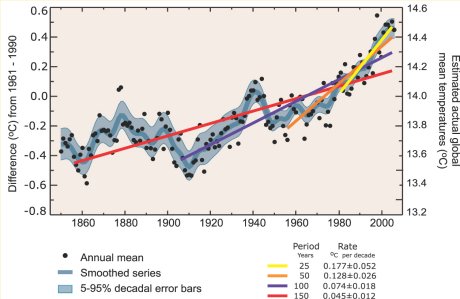
The quality of raw data from worldwide weather stations and vessels is indeed often unsatisfactory, especially if one goes further back in time – after all they were gathered to help forecast the weather and not to determine long-term climate trends. However, the error margin has been carefully analyzed – as is standard in science – and is shown in the temperature graphs on the Hadley Center's website as well as in the IPCC report, and to date there is no reason to assume that the actual temperature evolution lies outside these error margins – the more so as the satellite data correspond well with the ground data. Whether the global warming trend was 0.15 or 0.17 °C per decade in the past decades is of no relevance to any practical concerns.

IPCC-Figure of global mean temperature 1850-2005 (Fig. TS6).
According to DER SPIEGEL, Jones has erased raw data and is “an activist or missionary who views ‘his’ data as his personal shrine” who “is intent on protecting it from the critical eyes of his detractors.” However, Jones is neither the producer and owner nor the archivist of these data – it is simply data from the national weather agencies, who also are responsible for its archiving or for the question to whom and under what circumstances they may be passed on. The majority of these data is freely accessible online. However, some weather services do not allow their data to be passed on because they sell such data. Other scientists have compared the CRU-data with freely available raw data from weather stations. And at NASA one can find the computer algorithms which are used to calculate the global mean temperature, publicly available for everybody. There is hardly any other scientific field in which more data and computer codes are freely accessible than in climate science (e.g., also codes and data of my current papers on sea level rise in Science 2007 and PNAS 2009). Do for example economists, on whose advice many political decisions depend, disclose their raw data and the computer codes of their models?
The British House of Commons has just published the report by the committee which has been appointed to examine the accusations made against Phil Jones. The report concludes:
The focus on Professor Jones and CRU has been largely misplaced. [...] The scientific reputation of Professor Jones and CRU remains intact.The fact that Jones has been rehabilitated will be welcomed by all those who know this decent, always helpful and universally well-liked scientist. For the general public the conclusions on his scientific findings will be even more important:
Even if the data that CRU used were not publicly available-which they mostly are-or the methods not published-which they have been-its published results would still be credible: the results from CRU agree with those drawn from other international data sets; in other words, the analyses have been repeated and the conclusions have been verified.The ever-popular “hockey stick” discussion
DER SPIEGEL resurrects one of the oldest shelf-warmers of the “climate skeptics”: the hockey stick debate and a series of flawed accusations with it. The so-called “hockey stick” is a temperature construction for the Northern Hemisphere for the last millennium published by Michael Mann, Ray Bradley and Malcolm Hughes in 1999, of which DER SPIEGEL writes that the Canadian Steve McIntyre unmasked it as “a sham.” (And this is the only clue within the whole article pointing to the alleged “falsifications.”) This is not true. Even a committee of the National Academy of Sciences looked in 2006 at the accusations made by McIntyre and has cleared the authors of all suspicions.
Raw data and computer codes of the “hockey stick” are online and publicly available, and independent scientists have recalculated everything years ago using their own codes (also available). The current IPCC report from 2007 shows in Fig. 6.10 these reconstructions together with a dozen more which have meanwhile been added; the Copenhagen Diagnosis published in 2009 shows some even more recent ones in Fig. 19 (page 43). All show consistent results, not in detail but in their fundamental aspects. This is why the conclusions drawn in the IPCC report of 2007 were stronger than back in 2001, when the “hockey stick” had been shown for the first time. The IPCC report 2007 concludes:
Palaeoclimatic information supports the interpretation that the warmth of the last half century is unusual in at least the previous 1,300 years. [Summary for Policy Makers, S. 9]In the third report from 2001 such a statement had been made only for he last 1000 years.
All reconstructions – with or without using tree-ring data – agree that the temperature in the Northern Hemisphere (for the Southern Hemisphere insufficient data existed until recently) is higher today than in medieval times. DER SPIEGEL simply claims the opposite:
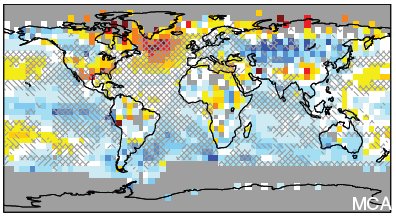
There are many indications that in medieval times, between 900 and 1300 A.D., when the Vikings raised livestock in Greenland and grape vines were cultivated in Scotland, it was in fact warmer than it is today.No scientific evidence in support of this claim is mentioned. Locally – in the North Atlantic region – climate reconstructions do indeed show higher temperatures than today (see Fig.); hence, there is no contradiction to the anecdotal evidence about Greenland and Scotland.

Temperature difference between the middle ages (years 950 to 1250) and the modern period (years 1961 to 1990) according to a reconstruction by Mann et al. 2009. The grey
Incidentally, looking at the forcings, it would be surprising if it had been warmer in medieval times than now. Forcings are the factors which affect the global radiation budget of the Earth, such as variation of solar activity, volcanic eruptions or changes of the amount of greenhouse gases in the atmosphere. If we compute the temperature evolution from the known forcings over the last thousand years, the result is consistent with the temperature reconstructions mentioned above. Merely one (in the meantime corrected) model simulation by Zorita and von Storch is an exception. These model calculations (18 in total) are compiled and compared with data in the IPCC report in figures 6.13 and 6.14 .
Only by looking at the forcings can one draw conclusions about the causes of global warming – the fact that currently it is unusually warm does not by itself tell us anything about the causes. If only natural and no anthropogenic forcing existed it would be much colder now than in medieval times.
The hockey stick debate exemplifies how the "climate skeptics" lobby has tried to discredit an inconvenient scientific finding over the course of many years, without success. The scientific conclusions have proven to be robust.
Tropical storms
Under the subheading “The Myth of the Monster Storm” the SPIEGEL article reports on a “hurricane war” amongst US climate scientists:
The alarmists, using the rhetoric of fiery sermons, warned that Katrina was only the beginning, and that we would soon see the advent of superstorms of unprecedented fury. Members of the more levelheaded camp were vehemently opposed to such predictions and insisted that there was no justification for such fears.Sadly, no example for the “rhetoric of fiery sermons” is quoted. “Levelheaded” is the well-worn SPIEGEL-parlance for describing anyone who downplays climate change, regardless of whether their claims are scientifically well-founded.
Then a recent study from Nature Geoscience is cited which allegedly announces “the all-clear signal on the hurricane front” and which signifies “another setback for the IPCC.” This is because “the IPCC report warned that there would be more hurricanes in a greenhouse climate.” Let us simply quote from the abstract of the new study:
Future projections based on theory and high-resolution dynamical models consistently indicate that greenhouse warming will cause the globally averaged intensity of tropical cyclones to shift towards stronger storms, with intensity increases of 2-11% by 2100. Existing modelling studies also consistently project decreases in the globally averaged frequency of tropical cyclones, by 6-34%. Balanced against this, higher resolution modelling studies typically project substantial increases in the frequency of the most intense cyclones, and increases of the order of 20% in the precipitation rate within 100 km of the storm centre.Long story short, fewer but heavier tropical storms can be expected. By the way, the potential destructiveness of storms increases more steeply than the wind velocities; a 2-11% higher speed means a 6-37% higher destructiveness. (Emanuel 2005).
And what did the IPCC report have to say on this topic?
Based on a range of models, it is likely that future tropical cyclones (typhoons and hurricanes) will become more intense, with larger peak wind speeds and more heavy precipitation associated with ongoing increases of tropical sea surface temperatures. There is less confidence in projections of a global decrease in numbers of tropical cyclones. [Summary for Policy Makers, page 15.]Long story short, fewer but heavier tropical storms can be expected, even if there was still less confidence about the first aspect at the time. The WMO, whose expert group has published this study, consequently describes the result as follows:
Substantial scientific progress has led the Expert Team to raise their confidence levels on several aspects of how tropical cyclone activity may change under projected climate scenarios.This means: there is no reason for speaking of a “setback” in a “war”; rather the early findings of the IPCC report have been given a higher confidence level. The SPIEGEL story on this issue falls into a category of false allegations against IPCC mentioned by us already in February, namely those which can be falsified by simply reading the report (in this case even a quick look at the Summary for Policy Makers would have sufficed).
IPCC mistakes
According to DER SPIEGEL “more and more mistakes, evidence of sloppy work and exaggerations in the current IPCC report are appearing.” We already investigated this and came to the conclusion that of the mistakes discussed excitedly in the media, nothing much remains except for the Himalaya mistake. The SPIEGEL does not have anything else to offer either – it counts “Jones’ disputed temperature curve” as one of them; apart from that “the supposed increase in natural disasters” – wrongly so as we have already showed (in German) reacting to an article published in Die Welt which claimed the same.
DER SPIEGEL elaborates on the story of the alleged “phantom graph” by Robert Muir-Wood which we have explained there as well. According to DER SPIEGEL, Roger Pielke “tried to find out where the graph had come from” and “traced it” to Robert Muir-Wood. This must have been hard indeed, given that Muir-Wood, who provided the graph, is named by the IPCC in the figure caption. The only difficult thing is to find this graph (which incidentally is correct but not very informative) at all: other than DER SPIEGEL claims, it is not in the IPCC report itself but only provided as “supplementary material” on its website, where the IPCC publishes such background material. Although on the 3,000 pages of the report there was no space for it, the graph now seems to be important to SPIEGEL readers for reasons unknown.
What is it all about?
SPIEGEL defames some of the best scientists worldwide, who not least for this reason have become prime targets for the “climate skeptics.” If you look at publications in the three scientific top journals (Nature, Science, PNAS), the just 44-year-old Mike Mann has already published 9 studies there, Phil Jones 24 (comments, letters and book reviews not included). In contrast, DER SPIEGEL always calls upon the same witness, the mathematician Hans von Storch, who has published only a single article in the prime journals mentioned (and that was faulty). But he says the politically wanted thing, even if without any supporting evidence from the scientific literature: in his view we can easily adapt to climate change. He also publicly accuses the vast majority of his colleagues who disagree with him of alarmism, calls them “prophets of doom” or “eco-activists” who indoctrinate the public. He also insinuates political or financial motives for disseminating horror scenarios. In this article he says things like “unfortunately, some of my colleagues behave like pastors, who present their results in precisely such a way that they’ll fit to their sermons.” This quote matches the article´s inflationary usage of the words “guru” “popes” “fiery sermons” “missionaries” and so forth. And he goes on: “It’s certainly no coincidence that all the mistakes that became public always tended in the direction of exaggeration and alarmism.” The following statement would have probably been more correct: it is certainly no coincidence that all the alleged errors scandalized in the media always tended in the direction of exaggeration and alarmism.
It is obvious that DER SPIEGEL does not care about science. This really is about politics. This year will decide about the future of the German climate policy: in the fall the government will announce its new energy strategy. This will decide whether the energy transformation towards a sustainable electricity supply, increasingly based on renewables, will be pushed forward or thwarted. In a global context the issue is whether global warming can be limited to a maximum of 2 ºC, as the Copenhagen Accord calls for, or whether this opportunity will be lost. The power struggle on this issue is in full gear. The energy transformation can best be prevented by creating doubts about its urgency. The fact that scandal stories about climate science have to be invented to this end just proves one thing: good, honest arguments against a forceful climate policy apparently do not exist.
Link: http://www.realclimate.org/index.php/archives/2010/04/climate-scientist-bashing/#more-3690


1 comment:
In the graph of "Global mean temperature (annual means) according to the 5 most often used data sets", that is, where appear the surface temperature record(GISS,NOAA and CRU) and satellite temperature record(UAH and RSS)...
which one has the greatest warming trend?
A common skeptic argument is that surface appear to warm faster than the low troposphere, contrary to the predictions of climate models.
Post a Comment