Rapid melt spreads to NW Greenland, 400 ppm CO2 may melt Greenland's ice sheet
by FishOutofWater, Daily Kos, March 25, 2010
Combined gravity and GPS measurements show that rapid melting of Greenland's icecap spread from southern to northwest Greenland over the past decade.
Rapid ice melting spread to northwest Greenland in 2007-2009.

The rate of mass loss, in cm/yr water equivalent thickness, determined from monthly GRACE gravity field solutions. (a) The rate averaged between February 2003 and February 2007. (b)
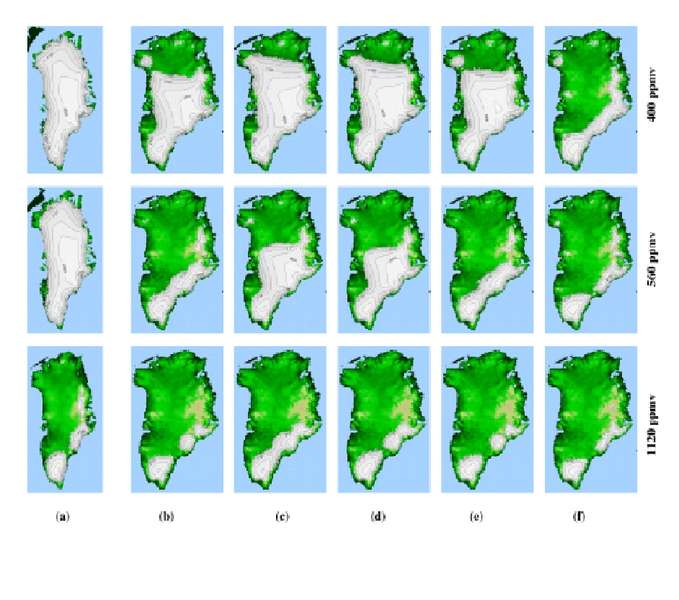
These results are consistent with a new model study which predicts failure of the icecap from beginning from northwest Greenland as CO2 levels rise above 400 parts per million (ppm).
Rapid ice melting spread to northwest Greenland in 2007-2009.

The rate of mass loss, in cm/yr water equivalent thickness, determined from monthly GRACE gravity field solutions. (a) The rate averaged between February 2003 and February 2007. (b)
These results are consistent with a new model study which predicts failure of the icecap from beginning from northwest Greenland as CO2 levels rise above 400 parts per million (ppm).
Until the sudden spread to the northwest in 2007 ice melt in Greenland had been largely confined to the south. Combined satellite gravity and GPS measurements are apparently showing that outlet glaciers beginning to move large amounts of ice from the northwestern margin of Greenland's ice cap. Direct link to Greenland ice melt mpeg movie.
Melting of ice in northwest Greenland is consistent with recent model studies that take into account "The effect of more realistic forcings and boundary conditions on the modelled geometry and sensitivity of the Greenland ice-sheet" 55pg PDF.

We performed a tuning exercise to improve the modelled present day ice-sheet. Several solutions were chosen in order to represent improvement in different aspects of the Greenland ice-sheet geometry: ice thickness, ice volume and ice surface extent. We applied these new setups of Glimmer to several future climate scenarios where atmospheric CO2 concentration was elevated to 400, 560 and 1120 ppmv (compared with 280 ppmv in the control) using a fully coupled General Circulation Model. Collapse of the ice-sheet was found to occur between 400 and 560 ppmv, a threshold substantially lower than previously modelled using the standard EISMINT-3 setup. (editor's bold)A tipping point is reached after the top of the ice sheet lowers to a critical elevation, after which warming and melting are accelerated by lowering of the top of the ice sheet.
The original methodology with a 400 ppmv climate results in a similar ice-sheet to 5 modern (reduced less than 2% of the modern ice-sheet). In contrast, our results using the five optimal tuned parameter sets with the more recent boundary conditions and forcings (Fig. 12b-f) give highly different ice-sheet configurations under a 400 ppmv climate. Although not completely collapsed, the 400 ppmv ice-sheets for Figure 12b-e are somewhat reduced in the north of the island, with a reduction in ice volume compared with the modern day ice-sheet volume ranging between 20 to 41%. However, the scenario in Fig. 12f shows almost complete collapse at 400 ppmv with a reduction in ice volume of 81%. The main difference in parameter values between Fig. 12f and the other four experiments is the atmospheric lapse rate which is at least 2 C larger than any of the other lapse rates chosen.
During ice-sheet retreat a higher lapse rate will act to warm the region further and cause more surface melt than a lower lapse rate via the ice-elevation feedback mechanism. A warmer climate compared with pre-industrial results in increased melting during summer months. In all cases a "tipping point" is reached whereby the ice-elevation feedback results in ablation increasing relative to accumulation as the ice-sheet lowers and the temperature increases. This however in the case of Fig. 12f, is re-enforced by having a higher lapse rate value resulting in rapid loss of the ice-sheet with only the highest eastern regions of the island occupied by ice.
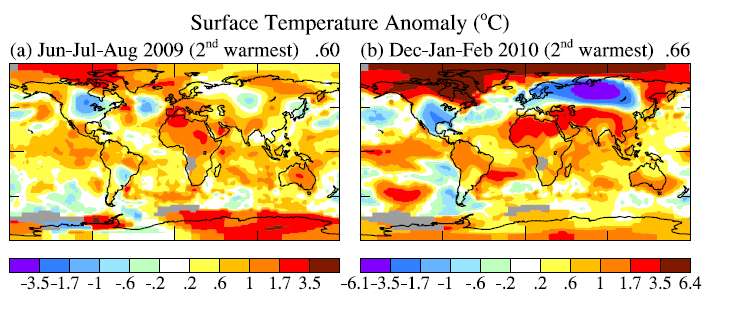
Under a 560 ppmv climate, the GrIS is markedly reduced compared with modern with a reduction in ice-sheet volume ranging from 52 to 87%. This is not the case for the set-up used in Lunt et al. (2009) where only 7% of ice mass was lost compared with modern.The extreme warmth over Greenland this winter will likely add to the increasing rate of melt in northwest Greenland. Warm water around southern Greenland and storms in the Labrador sea have warmed the atmosphere over the Greenland ice cap. This could be the beginning of the process that causes the collapse of the ice sheet over northwest Greenland.

Link: http://www.dailykos.com/story/2010/3/25/850908/-Rapid-melt-spreads-to-NW-Greenland,-400ppm-CO2-may-melt-cap


2 comments:
We already passed 400 CO2-eq. Especially if BC is accounted for. The warming effect of BC is in the Arctic of the same magnitude as CO2.
Once the arctic is sea-ice free in summer there will be a lot of feedbacks coming into play. There is the decrease of albedo of course. There will be a gigantic rise in three of the strongest greenhouse gases: water vapor, CO2 and methane.
The heat from the tropics, brought up North by the Ocean Conveyor Belt, will be able to help melting Greenland in stead of being released into space.
Yes. It is more and more depressing. I can hardly bear to look at these damned articles.
Post a Comment