NSIDC Report of September 17, 2009: Arctic sea ice reaches annual minimum extent
Arctic sea ice appears to have reached its minimum extent for the year, the third-lowest extent since the start of satellite measurements in 1979. While this year’s minimum extent is above the record and near-record minimums of the last two years, it further reinforces the strong negative trend in summertime ice extent observed over the past thirty years.
 Figure 1. Daily Arctic sea ice extent on September 12 was 5.10 million km² (1.97 million square miles). The orange line shows the 1979-2000 median extent for that day. The black cross indicates the geographic North Pole. Sea Ice Index data. About the data. —Credit: National Snow and Ice Data Center.
 High-resolution image
Overview of conditions
On September 12, 2009, sea ice extent dropped to 5.10 million km² (1.97 million square miles). This appears to have been the lowest point of the year, as sea ice has now begun its annual cycle of growth in response to autumn cooling. The 2009 minimum is the third-lowest recorded since 1979, 580,000 km? (220,000 square miles) above 2008 and 970,000 km² (370,000 square miles) above the record low in 2007.
The 2009 minimum is 1.61 million km² (620,000 square miles) below the 1979-2000 average minimum and 1.28 million km² (490,000 square miles) below the thirty-year 1979-2008 average minimum.
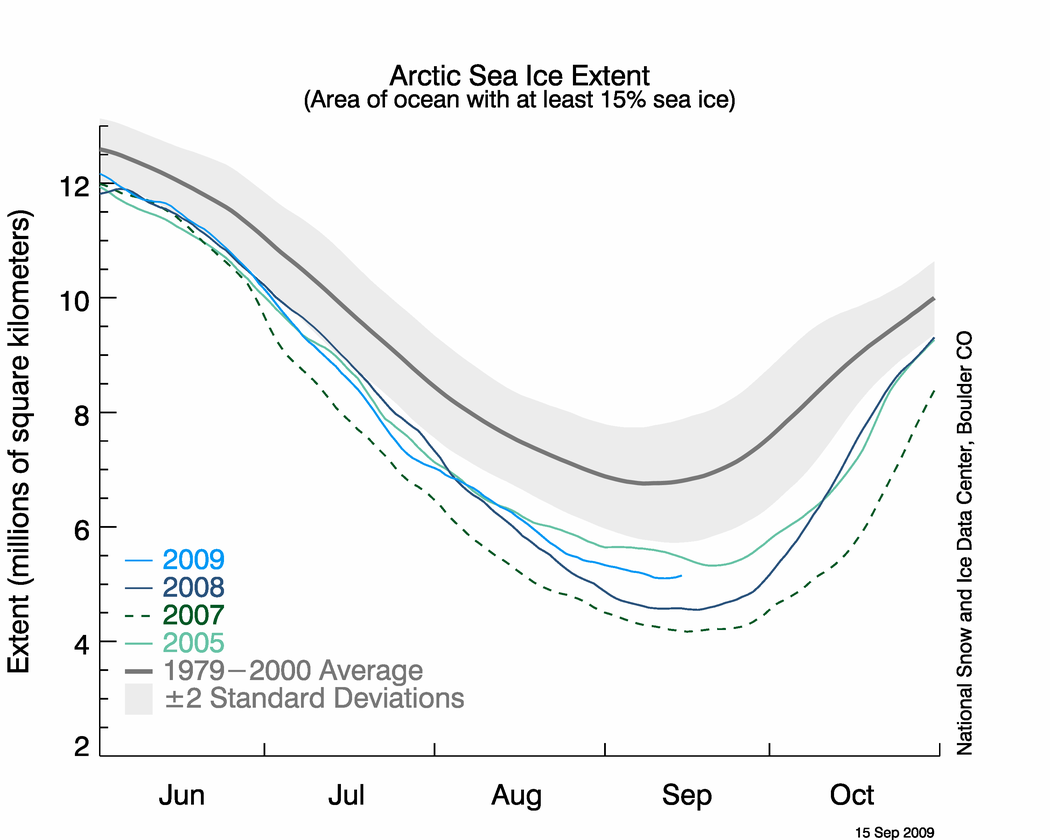 Figure 2. The graph above shows daily sea ice extent as of September 15, 2009. The solid light blue line indicates 2009; dark blue shows 2008, dashed green indicates 2007; light green shows 2005, and solid gray indicates average extent from 1979 to 2000. The gray area around the average line shows the two standard deviation range of the data. Sea Ice Index data. —Credit: National Snow and Ice Data Center. High-resolution image
 Conditions in context
This year, the minimum extent did not fall as low as the minimums of the last two years, because temperatures through the summer were relatively cooler. The Chukchi and Beaufort seas were especially cool compared to 2007. Winds also tended to disperse the ice pack over a larger region.
While the ice extent this year is higher than the last two years, scientists do not consider this to be a recovery. Despite conditions less favorable to ice loss, the 2009 minimum extent is still 24% below the 1979-2000 average, and 20% below the 30-year 1979-2008 average minimum. In addition, the Arctic is still dominated by younger, thinner ice, which is more vulnerable to seasonal melt. The long-term decline in summer extent is expected to continue in future years.
 Figure 3. This image compares differences in ice-covered areas between September 12, 2009, the date of this year's minimum, and September 16, 2007, the record low minimum extent. Light gray shading indicates the region where ice occurred in both 2007 and 2009, while white and dark gray areas show ice cover unique to 2009 and to 2007, respectively. Sea Ice Index data. About the data. —Credit: National Snow and Ice Data Center. High-resolution image
 Comparison of the 2009 and 2007 September minima
The spatial pattern of the 2009 minimum extent was different than that of 2007, partly because of differing wind patterns. Compared to this year, 2007 had substantially more ice loss in the central Arctic, north of the Chukchi and East Siberian Seas because winds pushed ice in these regions northward. However, this year the Arctic lost more ice in the Beaufort Sea than 2007 because of southwesterly winds pushing the ice edge toward the northeast. Overall, the pattern of ice loss is similar to 2008 (not shown), although it resulted from different atmospheric circulation patterns.
Once again this year, the Northern Sea Route through the Arctic Ocean along the coast of Siberia opened. Although some ice remained in certain regions, two German ships managed to navigate the passage with Russian icebreaker escorts. Russian vessels have traversed the passage many times over the years, but as ice extent drops there is more interest from other nations. As in 2008, the shallow Amundsen's Northwest Passage briefly opened, but the deeper Parry's Channel of the Northwest Passage did not. In 2007, both channels were open.
A word of caution on calling the minimum
Because of the variability of sea ice at this time of year, the National Snow and Ice Data Center determines the minimum using a five-day running mean value. We have now seen four days of gains in extent. It is still possible that ice extent could fall slightly, because of either further melting or a contraction in the area of the pack due to the motion of the ice.
For example, in 2005, the time series began to level out in early September, prompting speculation that we had reached the minimum. However, the sea ice contracted later in the season, again reducing sea ice extent and causing a further drop in the absolute minimum. When all the data for September are in, we will confirm the minimum ice extent for the season.
Final analysis pending
In the beginning of October, NSIDC will issue a formal press release with full analysis of the melt season, and graphics comparing this year to the long-term record. We will also announce the monthly average September sea ice extent, the measure scientists rely on for accurate analysis and comparison over the long term. We will continue to post analysis of sea ice conditions throughout the year, with frequency determined by sea ice conditions. The near-real-time daily image update will continue each day.


No comments:
Post a Comment