BLOGGER'S NOTE: the text below was stolen without permission from Tamino's Open Mind blog. You can skip over the equations and still get the gist of what he is saying (that is, unless your name is Roy Spencer or any of the Watt's Up With That gang of science boobs).
A Bag of Hammers
Tamino, Open Mind blog, January 19, 2009 · 139 Comments
The level of gullibility in reader comments has recently reached an all-time high.
Nick Zervos contributed this:
If the global temperature were to become cooler, the CO2 concentration would drop without any reduction in human emissions. Keep an eye on that Mauna Loa data.
Richard Steckis said this:
If there is an increase in overall concentration of 13C (as opposed to d13C) then there must also be a non-anthropogenic component to the co2 increase. The most logical source is inorganic 13C from the oceans.
which was a followup to this:
I have just found out that the concentration of 13C when decoupled from 12C is increasing.
http://wattsupwiththat.com/2008/01/28/spencer-pt2-more-co2-peculiarities-the-c13c12-isotope-ratio/
The link is to a post by Roy Spencer on WUWT. It’s a followup to a previous post in which he says:
The long-term increases in carbon dioxide concentration that have been observed at Mauna Loa since 1958 could be driven more than by the ocean than by mankind’s burning of fossil fuels.
Zervos and Steckis don’t provide any data or analysis, but Spencer does.
He begins by plotting the 13C data for Mauna Loa:
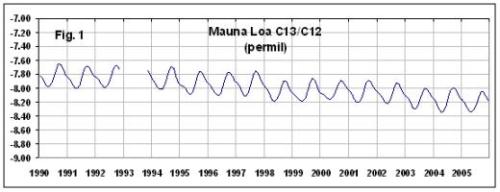
When I plot the same data, using the same axis limits as Spencer, I get a very similar graph:
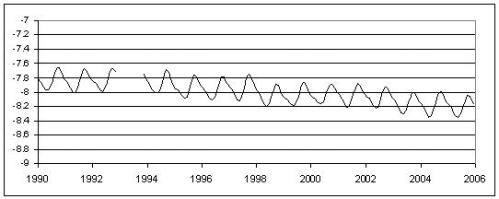
The ratio of 13C atoms to 12C atoms can be computed, given the
value:
.
where is a reference value, which for 13C is the VPDB standard, 0.0112372. If we also know the total number
of carbon atoms in CO2 (which is given by the CO2 concentration, something most of us are familiar with), we can compute the number of 13C atoms in CO2
.
This is essentially the amount of atmospheric 13CO2. I’ve ignored 14C atoms, but they’re only one in a trillion of all carbon atoms. One last note: the value is generally given in “permil” which is “parts per thousand,” so when the value is given as -8 permil (about the average value at Mauna Loa) in terms of simple numbers that’s -0.008.
Putting it all together we can compute the amount of 13CO2 in the atmosphere as measured at Mauna Loa. Spencer does so, and plots it thus:
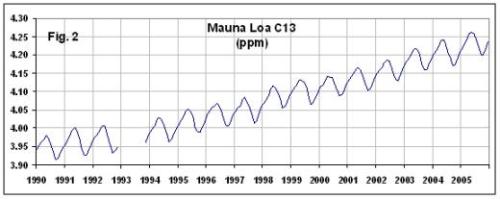
I did so, too, but using the same axis limits as Spencer, my graph looks different:
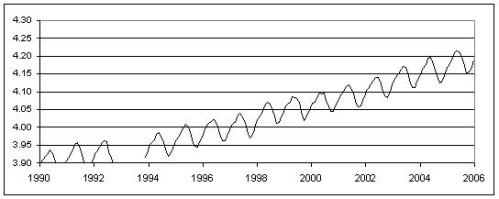
What’s up with that? It’s pretty clear that instead of computing , Spencer just computed
. Oh well, it doesn’t have a big impact on the analysis. Here’s a better plot of atmospheric 13CO2 at Mauna Loa:
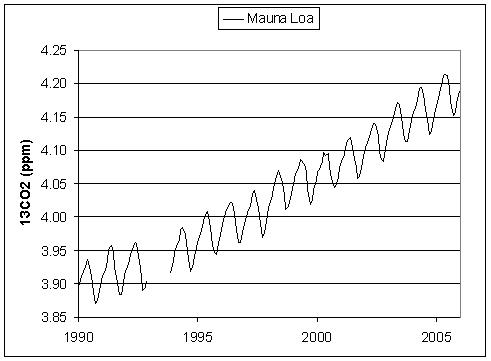
Now Spencer estimates the time rate of change of CO2 concentration, and of 13CO2 concentration; these are d(CO2)/dt and d(13CO2)/dt. He doesn’t give enough specifics about exactly how he does this to reproduce his calculation, but it really won’t matter for what follows. Next he shows a scatterplot of d(13CO2)/dt against d(CO2)/dt and fits a trend line to that data:
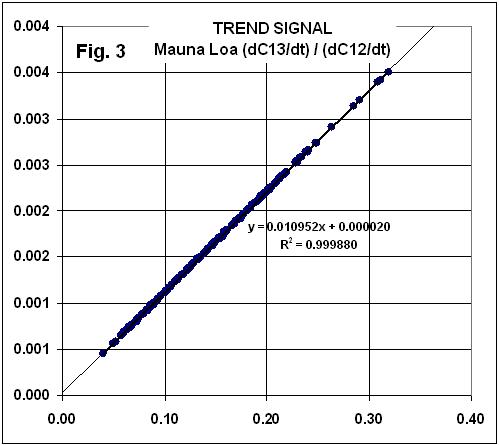
He notes that the slope of this trend line supports the anthropogenic origin of atmospheric CO2 increase.
It’s at this point that his analysis goes horribly wrong. He detrends the CO2 and 13CO2 data, then estimates their rates of change, produces a similar scatterplot, and regresses them against each other.
Now, when we look at the ratio of these inter-annual signals like we did from the trends in Fig. 3, we get the relationship seen in Fig. 6.
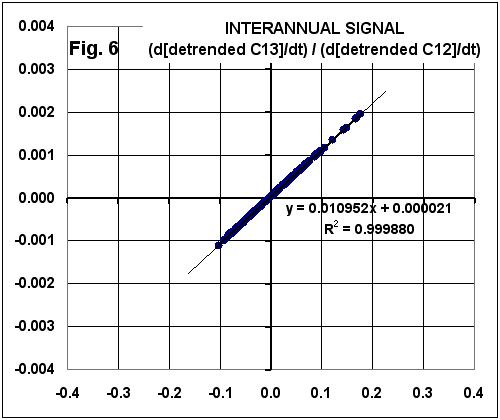
Significantly, note that the ratio of C13 variability to CO2 variability is EXACTLY THE SAME as that seen in the trends!
BOTTOM LINE: If the C13/C12 relationship during NATURAL inter-annual variability is the same as that found for the trends, how can people claim that the trend signal is MANMADE??
The argument is a logical fallacy. But it’s nowhere near as embarrassing as the mathematical fallacy. Let be the rate of change of CO2:
.
Let be the rate of change of 13CO2:
.
Spencer’s figure 3 is a scatterplot of against
. Now detrend the CO2 data; this will produce a new data set (call it
), which is the original data minus a straight line:
,
where is the time, and
and
are constants. Likewise detrend the 13CO2 data; this will produce a new data set (call it
), which is the original data minus a straight line:
where and
are constants. Now compute the time derivatives of the new data sets:
,
.
We see that the new time series of time derivatives are equal to the old time series
of time derivatives, offset by constants. Spencer’s figure 6 is a scatter plot of
against
.
If we take any two time series and regress one against the other, we’ll get a slope. If we take the same two time series offset by constants and regress one against the other, we’ll get exactly the same slope. Necessarily. For Sure. Every time.
So Spencer’s “Significantly, … EXACTLY THE SAME as that seen in the trends!” is nothing more than an obvious consequence of the way he analyzed the data. It’s not “significant,” and it means absolutely nothing except that Spencer really doesn’t understand what he’s doing.
—————————
We’ve put huge quantities of CO2 into the atmosphere from fossil-fuel burning, and atmospheric CO2 has increased. In fact, the atmospheric increase has only been about half the anthropogenic output, so not only are our emissions responsible for atmospheric increase, they’re increasing some other carbon reservoir as well. The evidence is pretty strong that most of the rest of the fossil-fuel CO2 is going into the oceans. As a result, not only is the atmospheric 13C fraction decreasing, so is the ocean 13C fraction. If atmospheric CO2 increase is coming from the oceans as Spencer claims, the how is it possible for both the atmosphere and the ocean to show declining 13C?
Maybe Spencer’s most foolish statement about the source of CO2 increase comes not from this post but from his previous one:
Let’s say the oceans are producing an extra 1 unit of CO2, mankind is producing 1 unit, and nature is absorbing an extra 1.5 units. Then we get the situation we have today, with CO2 rising at about 50% the rate of human emissions.
Ignore, if you can stretch the truth that far, that there’s no evidence whatever that the oceans are a net producer of atmospheric CO2 but there’s very strong evidence they’re actually absorbing. Just follow this logic, and take away the “mankind is producing 1 unit” — what’s the result? CO2 would be decreasing by 0.5 units. Result: without human emissions CO2 wouldn’t be increasing.
Claims that atmospheric CO2 increase isn’t due to fossil-fuel burning are about as dumb as it gets. The destructive aspect is that here we are wasting time on a subject about which there is no doubt. Seriously: we might as well be discussing whether the earth is flat. Maybe that’s the entire point: make those who want to increase knowledge about global warming waste their time rather than share important, and correct, information.
This really is a litmus test. I’m not the least bit interested in hearing your arguments about how maybe, just maybe, the increase is coming from the oceans or soda pop or space aliens so I should keep an open mind about it. Keeping an open mind doesn’t mean removing your brain.
Link to Tamino's Open Mind blog post: http://tamino.wordpress.com/2009/01/19/a-bag-of-hammers/


No comments:
Post a Comment