
January 7, 2009
2008 Year-in-Review
Sign up for the  Arctic Sea Ice News RSS feed for automatic notification of analysis updates. Updates are also available via Twitter.
In this month's entry, we offer a review of the 2008 year in Arctic sea ice. First, however, we discuss the noticeable pause in ice growth from December 12 to 19, apparently caused by an anomalous atmospheric pressure pattern combined with unusually warm ocean surface temperatures in the Barents Sea.
Note: We have updated the timeseries in the daily image update, above, to reflect the new year. The solid blue line shows 2008 to 2009. The dashed green line shows the winter of 2006 to 2007; 2007 went on to reach the lowest summer minimum in the satellite record. The 2008 entries of Arctic Sea Ice News & Analysis are now archived under "Previous Years" in the navigation to the right.
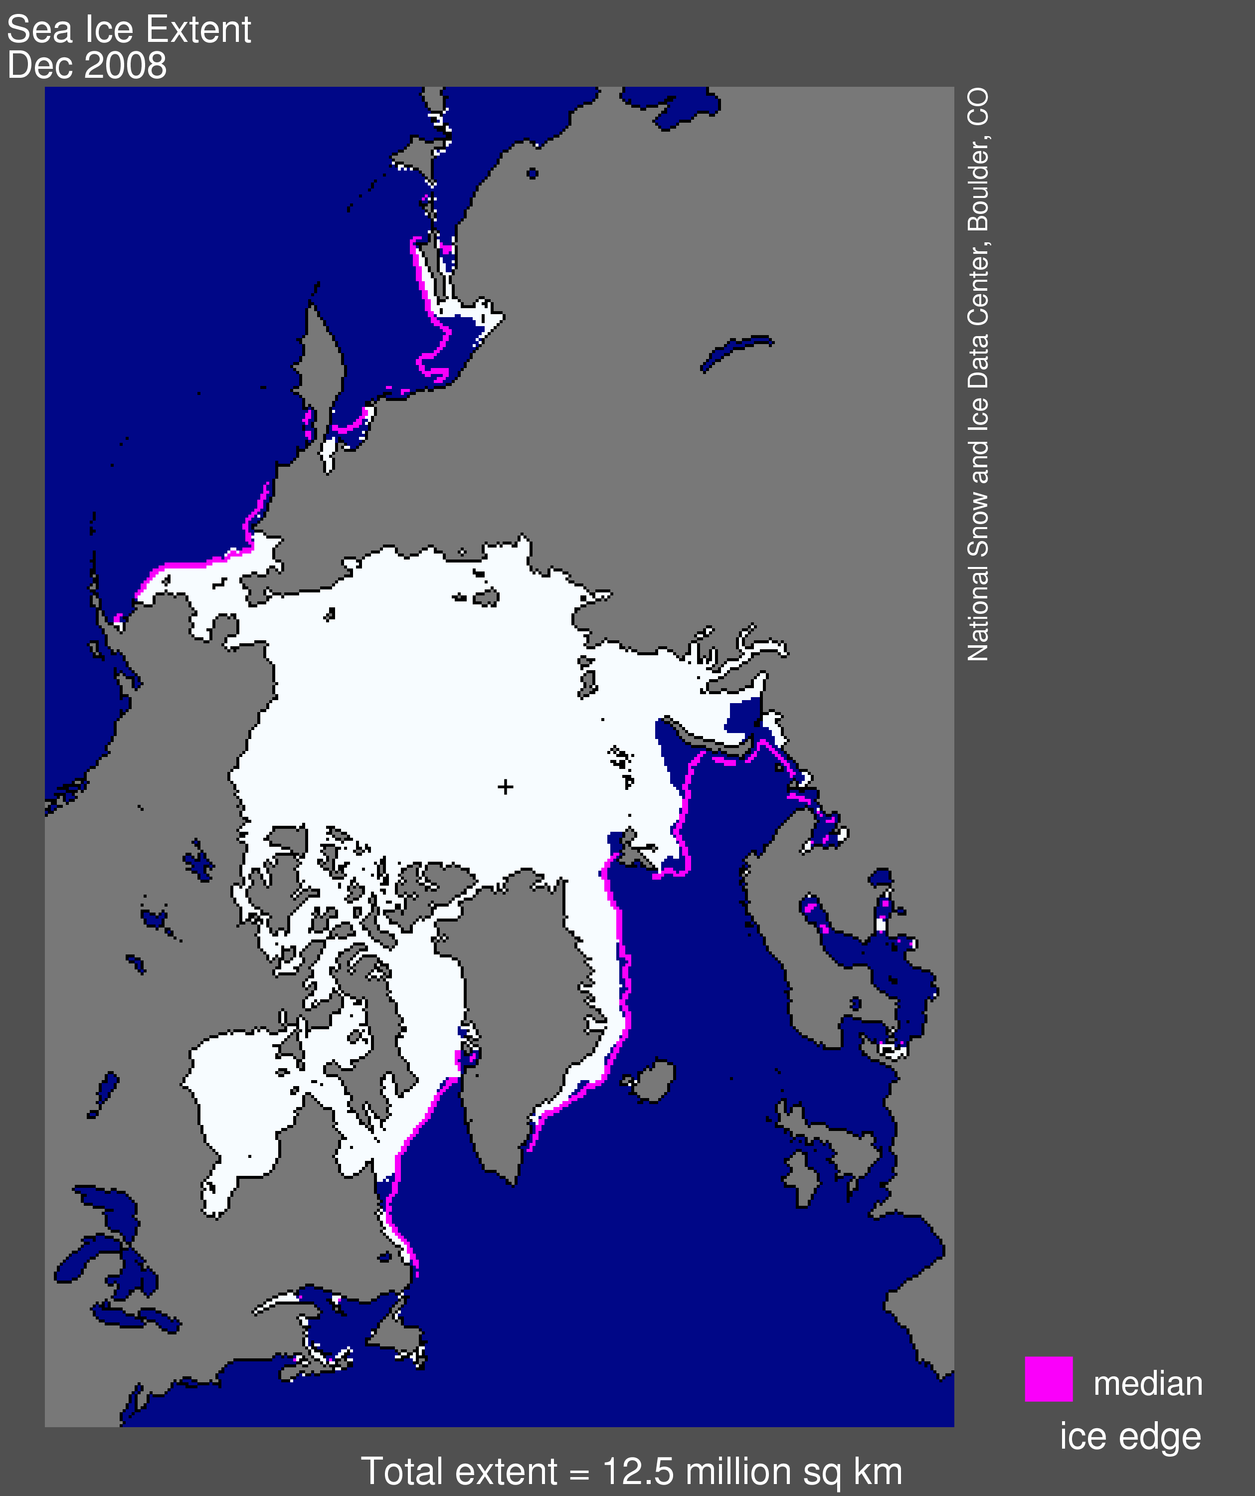
Figure 1. Arctic sea ice extent for December 2008 was 12.53 million square kilometers (4.84 million square miles). The magenta line shows the 1979 to 2000 average extent for December. The black cross indicates the geographic North Pole. Sea Ice Index data. About the data.
—Credit: National Snow and Ice Data Center
High-resolution image
Overview of conditions (December 2008)
Average Arctic sea ice extent for the month of December was 12.53 million square kilometers (4.84 million square miles). This was 140,000 square kilometers (54,000 square miles) greater than for December 2007 and 830,000 square kilometers (320,000 square miles) less than the 1979 to 2000 December average.
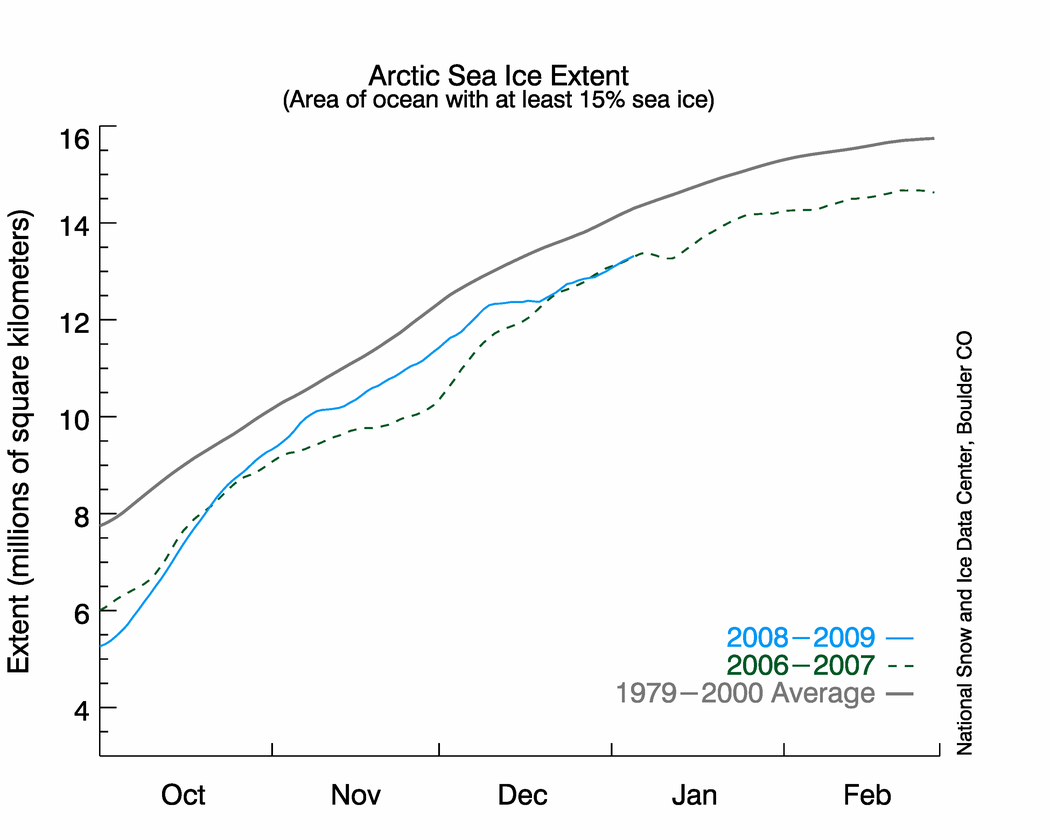 Figure 2. The graph above shows daily sea ice extent.The solid blue line indicates 2008–2009; the dashed green line shows 2006–2007 (the record-low summer minimum occurred in 2007); and the solid gray line indicates average extent from 1979 to 2000. Sea Ice Index data. —Credit: National Snow and Ice Data Center
High-resolution image
Conditions in context (December 2008)
Ice growth throughout most of December 2008 fit in with the expected pattern of ice growth in winter months. However, from December 12 to 19 there was almost no increase in ice extent (seen in the flattening of the timeseries line). The week-long pause in expansion of the ice edge is not unprecedented in the satellite record; several Decembers during past decades show similar events. However, such slowing has been unusual in recent years.
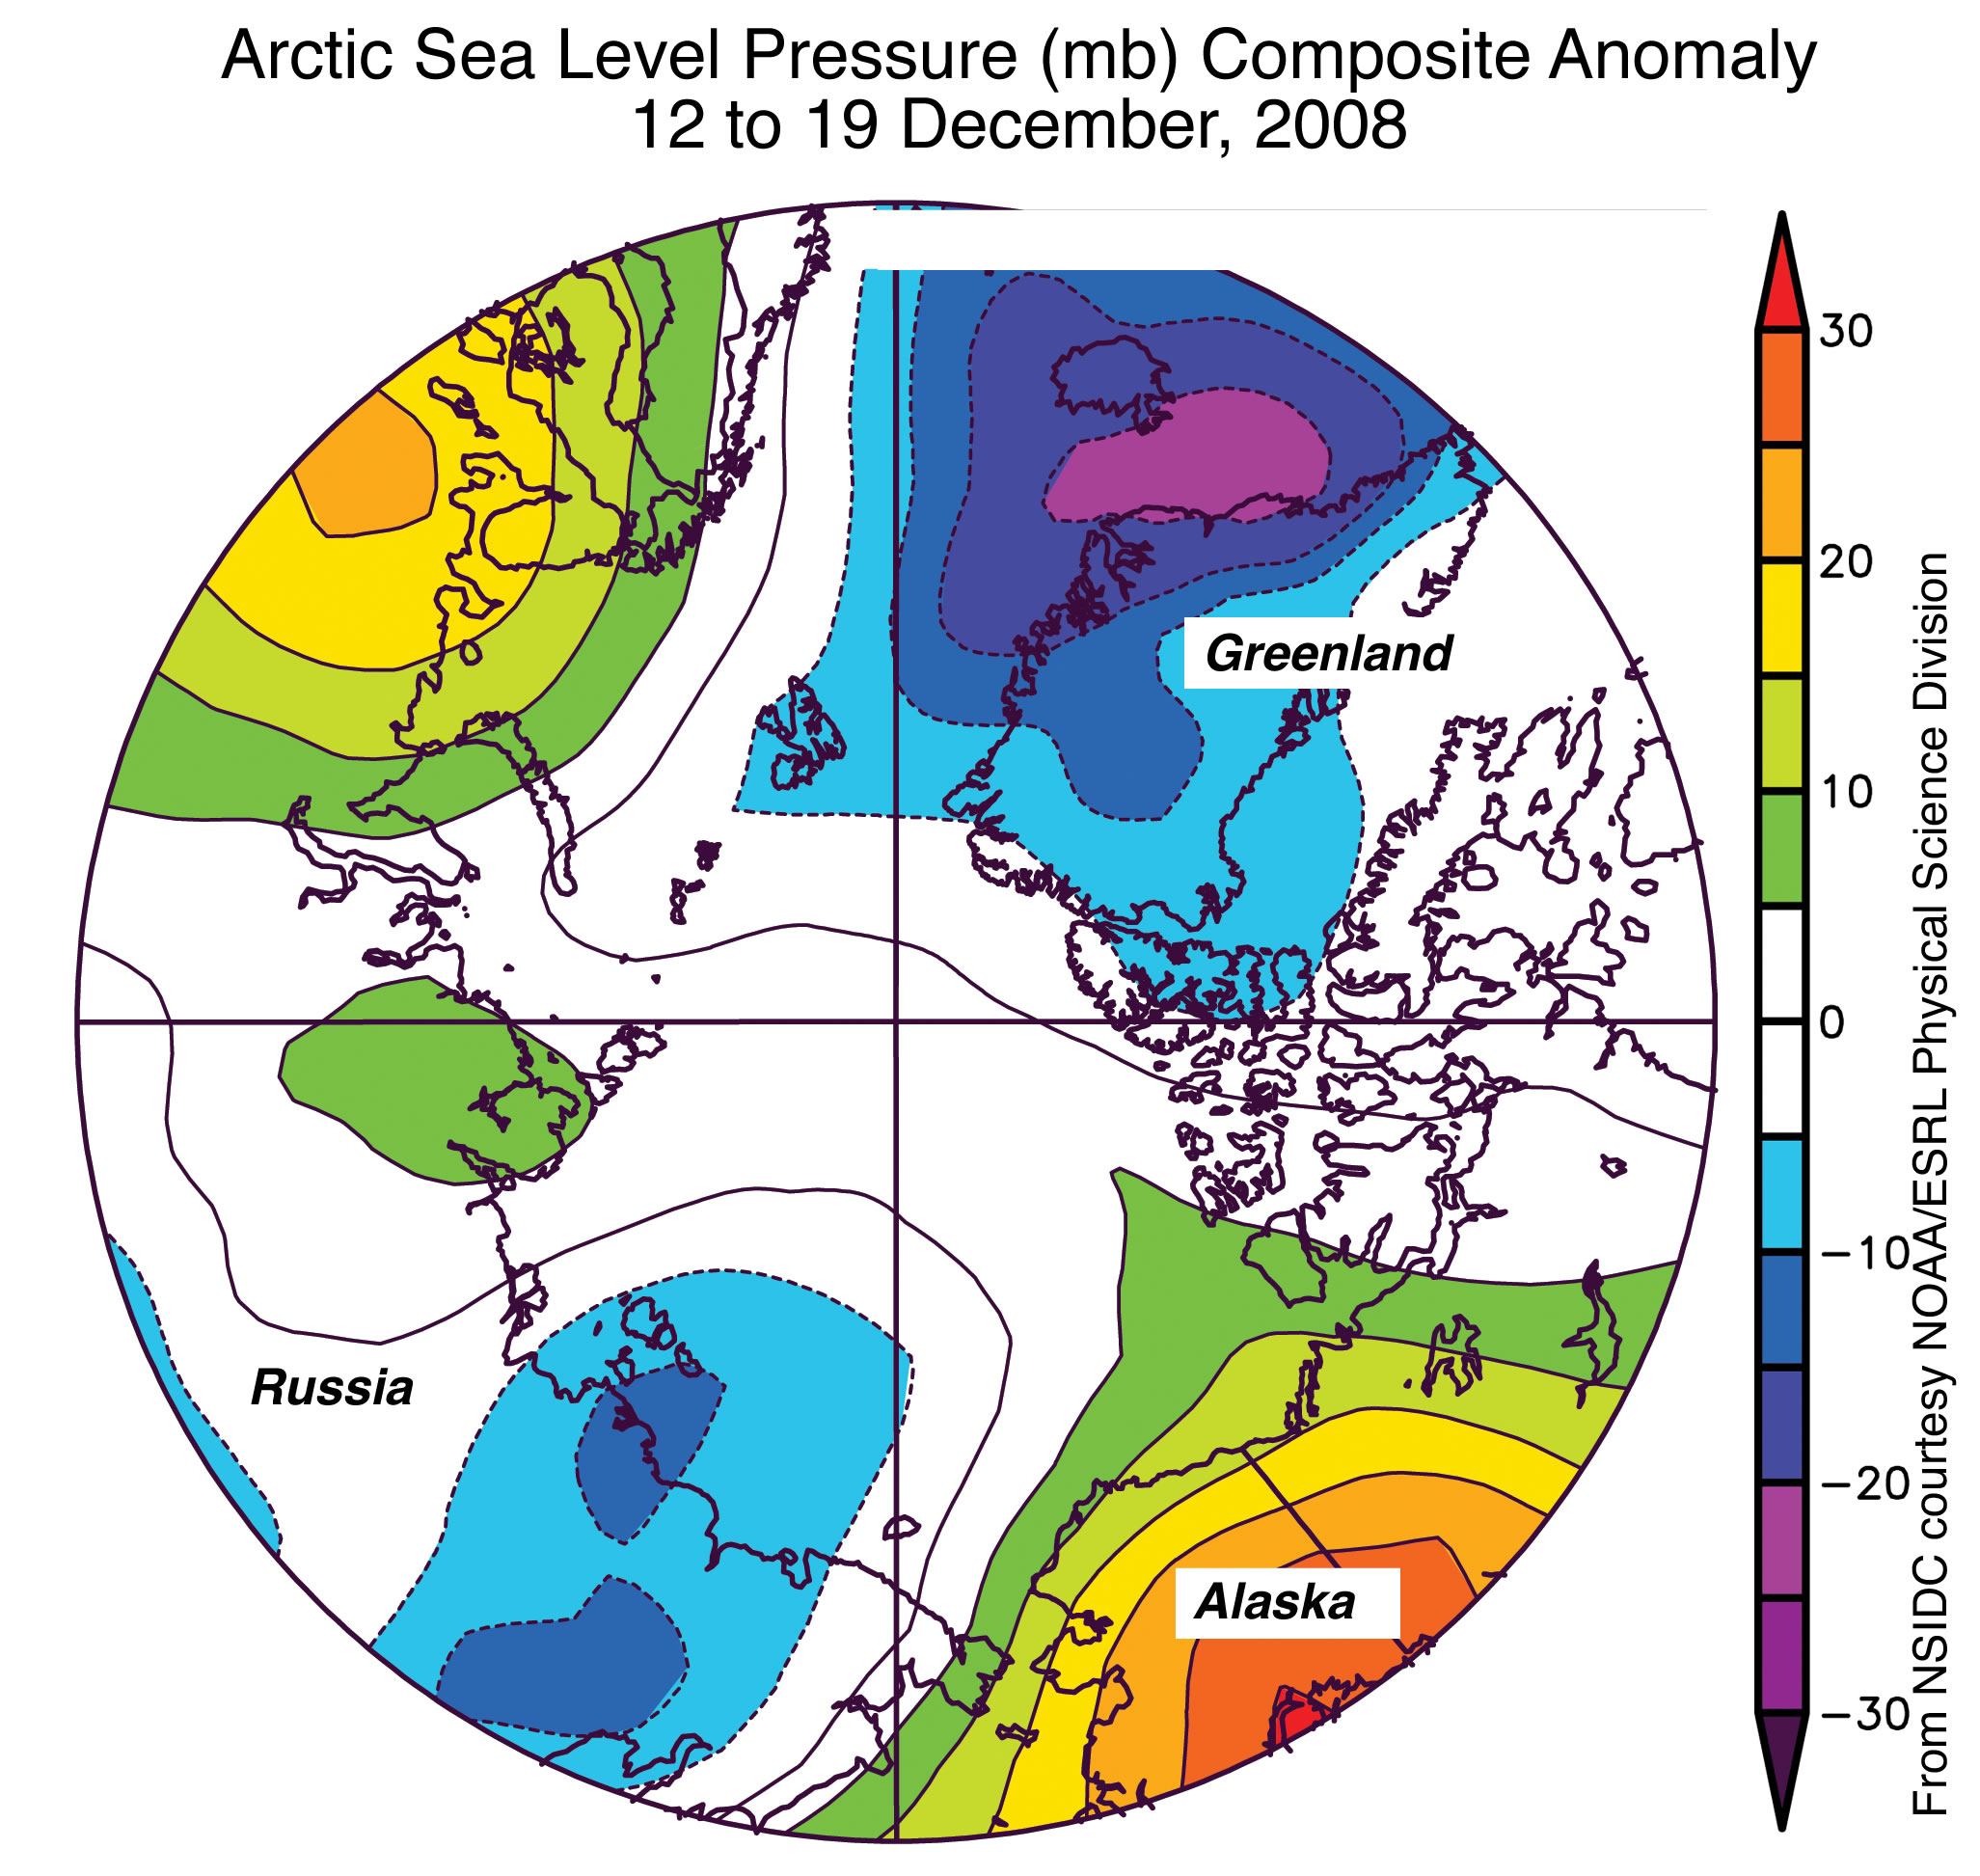 Figure 3. Sea level pressure anomalies (in millibars) averaged for the period December 12 through December 19, 2008, reveal one of the reasons for the week-long pause in ice extent change seen in December, as southerly winds and warm sea surface temperatures worked against ice growth. Strong positive anomalies indicate areas of unusually high pressure (orange and red); strong negative anomalies indicate areas of unusually low pressure (blue and purple). —Credit: From National Snow and Ice Data Center courtesy NOAA/ESRL Physical Sciences Laboratory
High-resolution image
Reasons for December's pause in ice extent change
December's week-long pause in expansion of the ice cover appears to have been caused, at least in part, by an anomalous atmospheric pressure pattern. High pressure over Alaska and the European Arctic, coupled with unusually low pressure east of Greenland and over eastern Siberia, brought warm southerly winds over much of the Arctic Ocean. The southerly winds helped keep the ice edge from expanding southward. In addition, warm sea surface temperatures, at least in the Barents Sea, inhibited ice formation.
 Figure 4. This timeseries from January through December shows the natural waxing and waning of the Arctic sea ice cover with the seasons. The maximum extent generally occurs in March, the minimum extent in September. Sea ice extent in 2008 (purple) fell well below the 1979 to 2000 long-term average (gray) and was slightly above 2007 (dashed green), in which the lowest summer minimum and the second-lowest winter maximum occurred. —Credit: National Snow and Ice Data Center
 High-resolution image
2008 year in review
Arctic sea ice in 2008 was notable for several reasons. The year continued the negative trend in summer sea ice extent, with the second-lowest summer minimum since record-keeping began in 1979. 2008 sea ice also showed well-below-average ice extents throughout the entire year.
The ice cover in 2008 began the year heavily influenced by the record-breaking 2007 melt season. Because so much ice had melted out during the previous summer, a vast expanse of ocean was exposed to low winter air temperatures, encouraging ice growth. Although still well below average, March 2008 saw slightly greater ice extent at the annual maximum than measured in recent years. However, the ice was also thin: less than a year old and vulnerable to melting in summer. Even the geographic North Pole was covered with thin ice, capturing the imaginations of many in the media and general public.
Would 2008 break the 2007 record low summer minimum extent? Would the geographic North Pole be ice free for the first time in the satellite era? From May through July, cooler temperatures and winds less favorable to ice loss slowed the decline in ice extent. Nevertheless, by August the rate of ice loss was much faster than average—even faster than in 2007—as the effects of a warm Arctic Ocean worked against the thin ice cover. The melt season became a race: waning sunlight versus rapid ice loss.
Ultimately, summer 2008 finished with the second-lowest minimum extent in the satellite record, 9% above the 2007 minimum and 34% below average. A more diffuse ice cover and a thinner pack nevertheless suggested a record-low ice volume (ice area multiplied by thickness) at the end of summer.
As the sun set in the Arctic with the advent of autumn, seasonal ice growth was initially quite rapid, but slowed during early November. Average ice extent in December was well below average and very close to that measured in 2007. Heading into 2009, the Arctic sea ice cover is again young and thin; given this set-up, a continuation of well-below-average sea ice extent in 2009 is a near certainty.
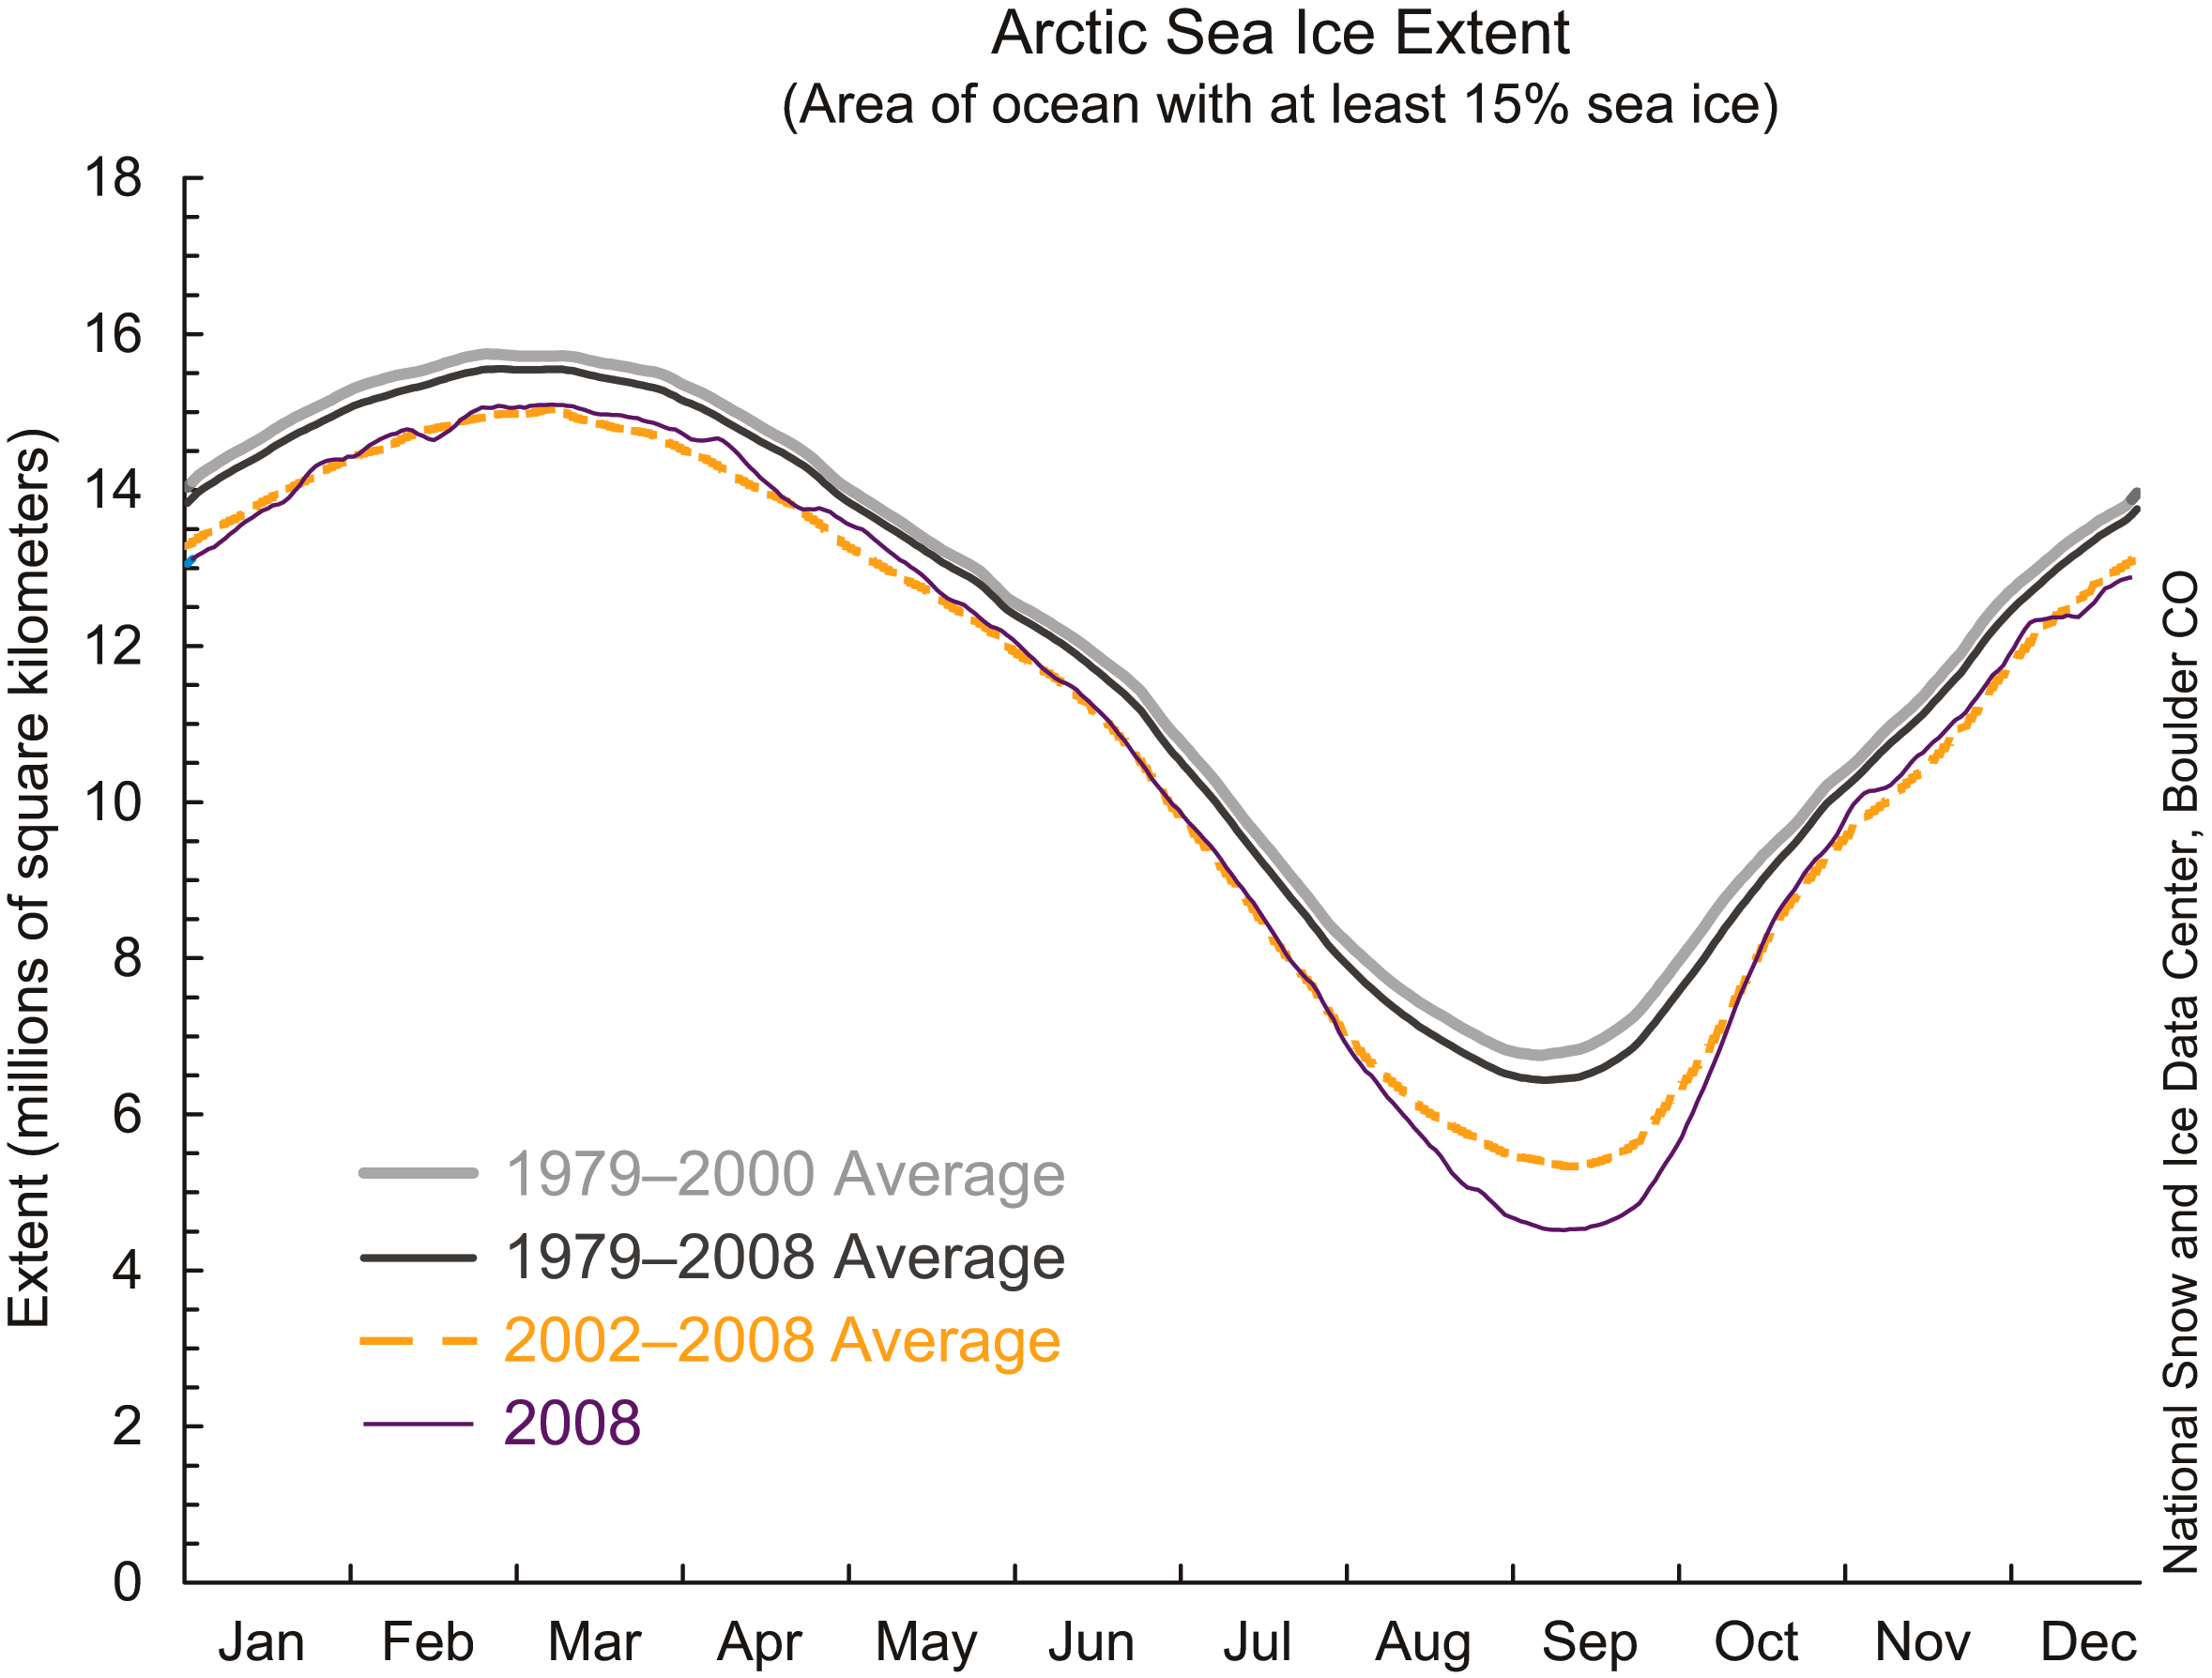 Figure 5. This timeseries is similar to Figure 4, showing the annual cycle of Arctic sea ice extent. However, we also include specfic averages for comparison. Light gray shows the standard 1979 to 2000 long-term average; dark gray shows the 1979 to 2008 average; the dashed yellow line shows the 2002 to 2008 average, a period of steep decline; and solid purple shows 2008. —Credit: National Snow and Ice Data Center
High-resolution image
A second look at the long-term average
In Arctic Sea Ice News & Analysis updates, we have always used sea ice extent data from 1979 to 2000 to calculate the long-term average. 1979 was the year of the first consistent satellite data on sea ice, so the starting point makes sense intuitively. But some have wondered why the long-term average only includes data through 2000, rather than through the current year. For more details on the pros and cons of using the standard long-term average versus an average including the current year, please see Why do you use the 1979–2000 average for comparisons? in our Frequently Asked Questions.
Figure 5 shows what happens to the long-term average when we include the current year, in this case 2008. The light gray line (1979 to 2000) and the dark gray line (1979 to 2008) are extremely close; including data through the current year does not in fact make a large difference.
To illustrate why the 1979 to 2008 average is slightly less than the standard long-term average, we also isolate the 2002 to 2008 average (dashed yellow line). These recent years show the steepest decline in ice extent over the thirty-year record, which explains why including them brings down the 1979 to 2008 average.
Link to this page at the NSIDC (the page changes over time as it is updated): http://nsidc.org/arcticseaicenews/


No comments:
Post a Comment