July 17, 2008
A different pattern of sea ice retreat
Arctic sea ice extent on July 16, 2008, fell roughly between the extent for the same day in 2007 and the long-term average. The spatial pattern of summer ice loss has evolved differently from last year; this reflects the prevailing pattern of atmospheric circulation. Areas of low-concentration ice are also developing at unusually high latitudes.
Note: Analysis updates, unless otherwise noted, now show a single-day extent value for Figure 1, as opposed to the standard monthly average. While monthly average extent images are more accurate in understanding long-term changes, the daily images are helpful in monitoring sea ice conditions in near-real time.
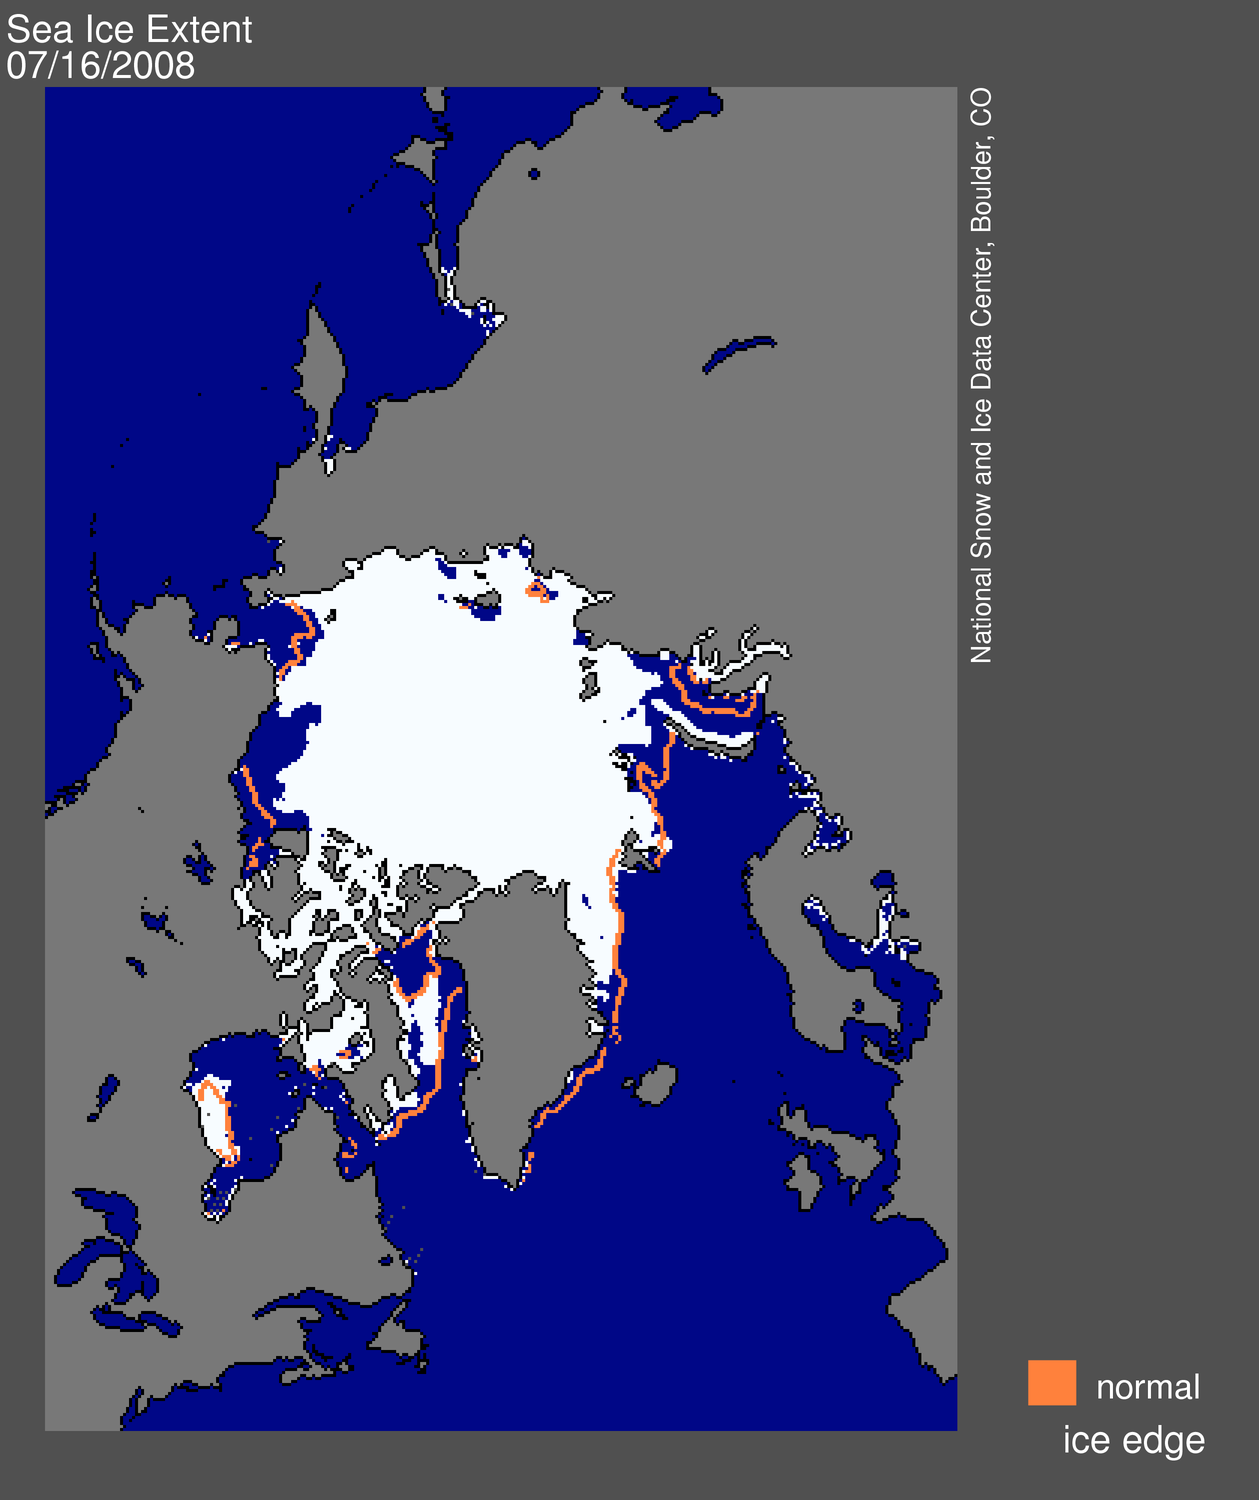
Figure 1. Daily Arctic sea ice extent for July 16, 2008, was 8.91 million sq. km (3.44 million sq. miles). The orange line shows the 1979-2000 average extent for that day. About the data.
Overview of conditions
Arctic sea ice extent on July 16 stood at 8.91 million sq. km (3.44 sq. miles). While extent was below the 1979 to 2000 average of 9.91 sq. km (3.83 million sq. miles), it was 1.05 million sq. km (0.41 million sq. miles) above the value for July 16, 2007 (see Figures 1 and 2).

Figure 2. Daily sea ice extent; the blue line indicates 2008; the gray line indicates extent from 1979 to 2000; the dotted green line shows extent for 2007.
Credit: National Snow and Ice Data Center
See High Resolution Image
Conditions in context
The current pattern of sea ice retreat is noticeably different than last summer, with some areas showing less ice and others showing more. For example, in mid-July 2007, a large area of the southern Beaufort Sea north of Alaska still had ice; this year, it is already ice-free (see Figure 1). in 2007, large areas along the Siberian coast had melted out by mid-July; as of July 16, 2008, the Siberian sector remained largely ice-covered. Although the Siberian area still shows ice, satellite data reveals that the ice is low concentration and thus prone to melting.
Colleagues at the University of Bremen, Germany, post daily satellite images from the NASA Advanced Microwave Sounding Radiometer (AMSR) at http://www.iup.uni-bremen.de:8084/amsr/amsre.html. The images not only show the low ice concentrations in the Siberian sector discussed above; they also show that a large part of the northern Beaufort Sea is covered by ice with low concentrations of 50-75%, and is likely to melt out soon. An unusual area of low ice concentration is also developing near 85 degrees North latitude.
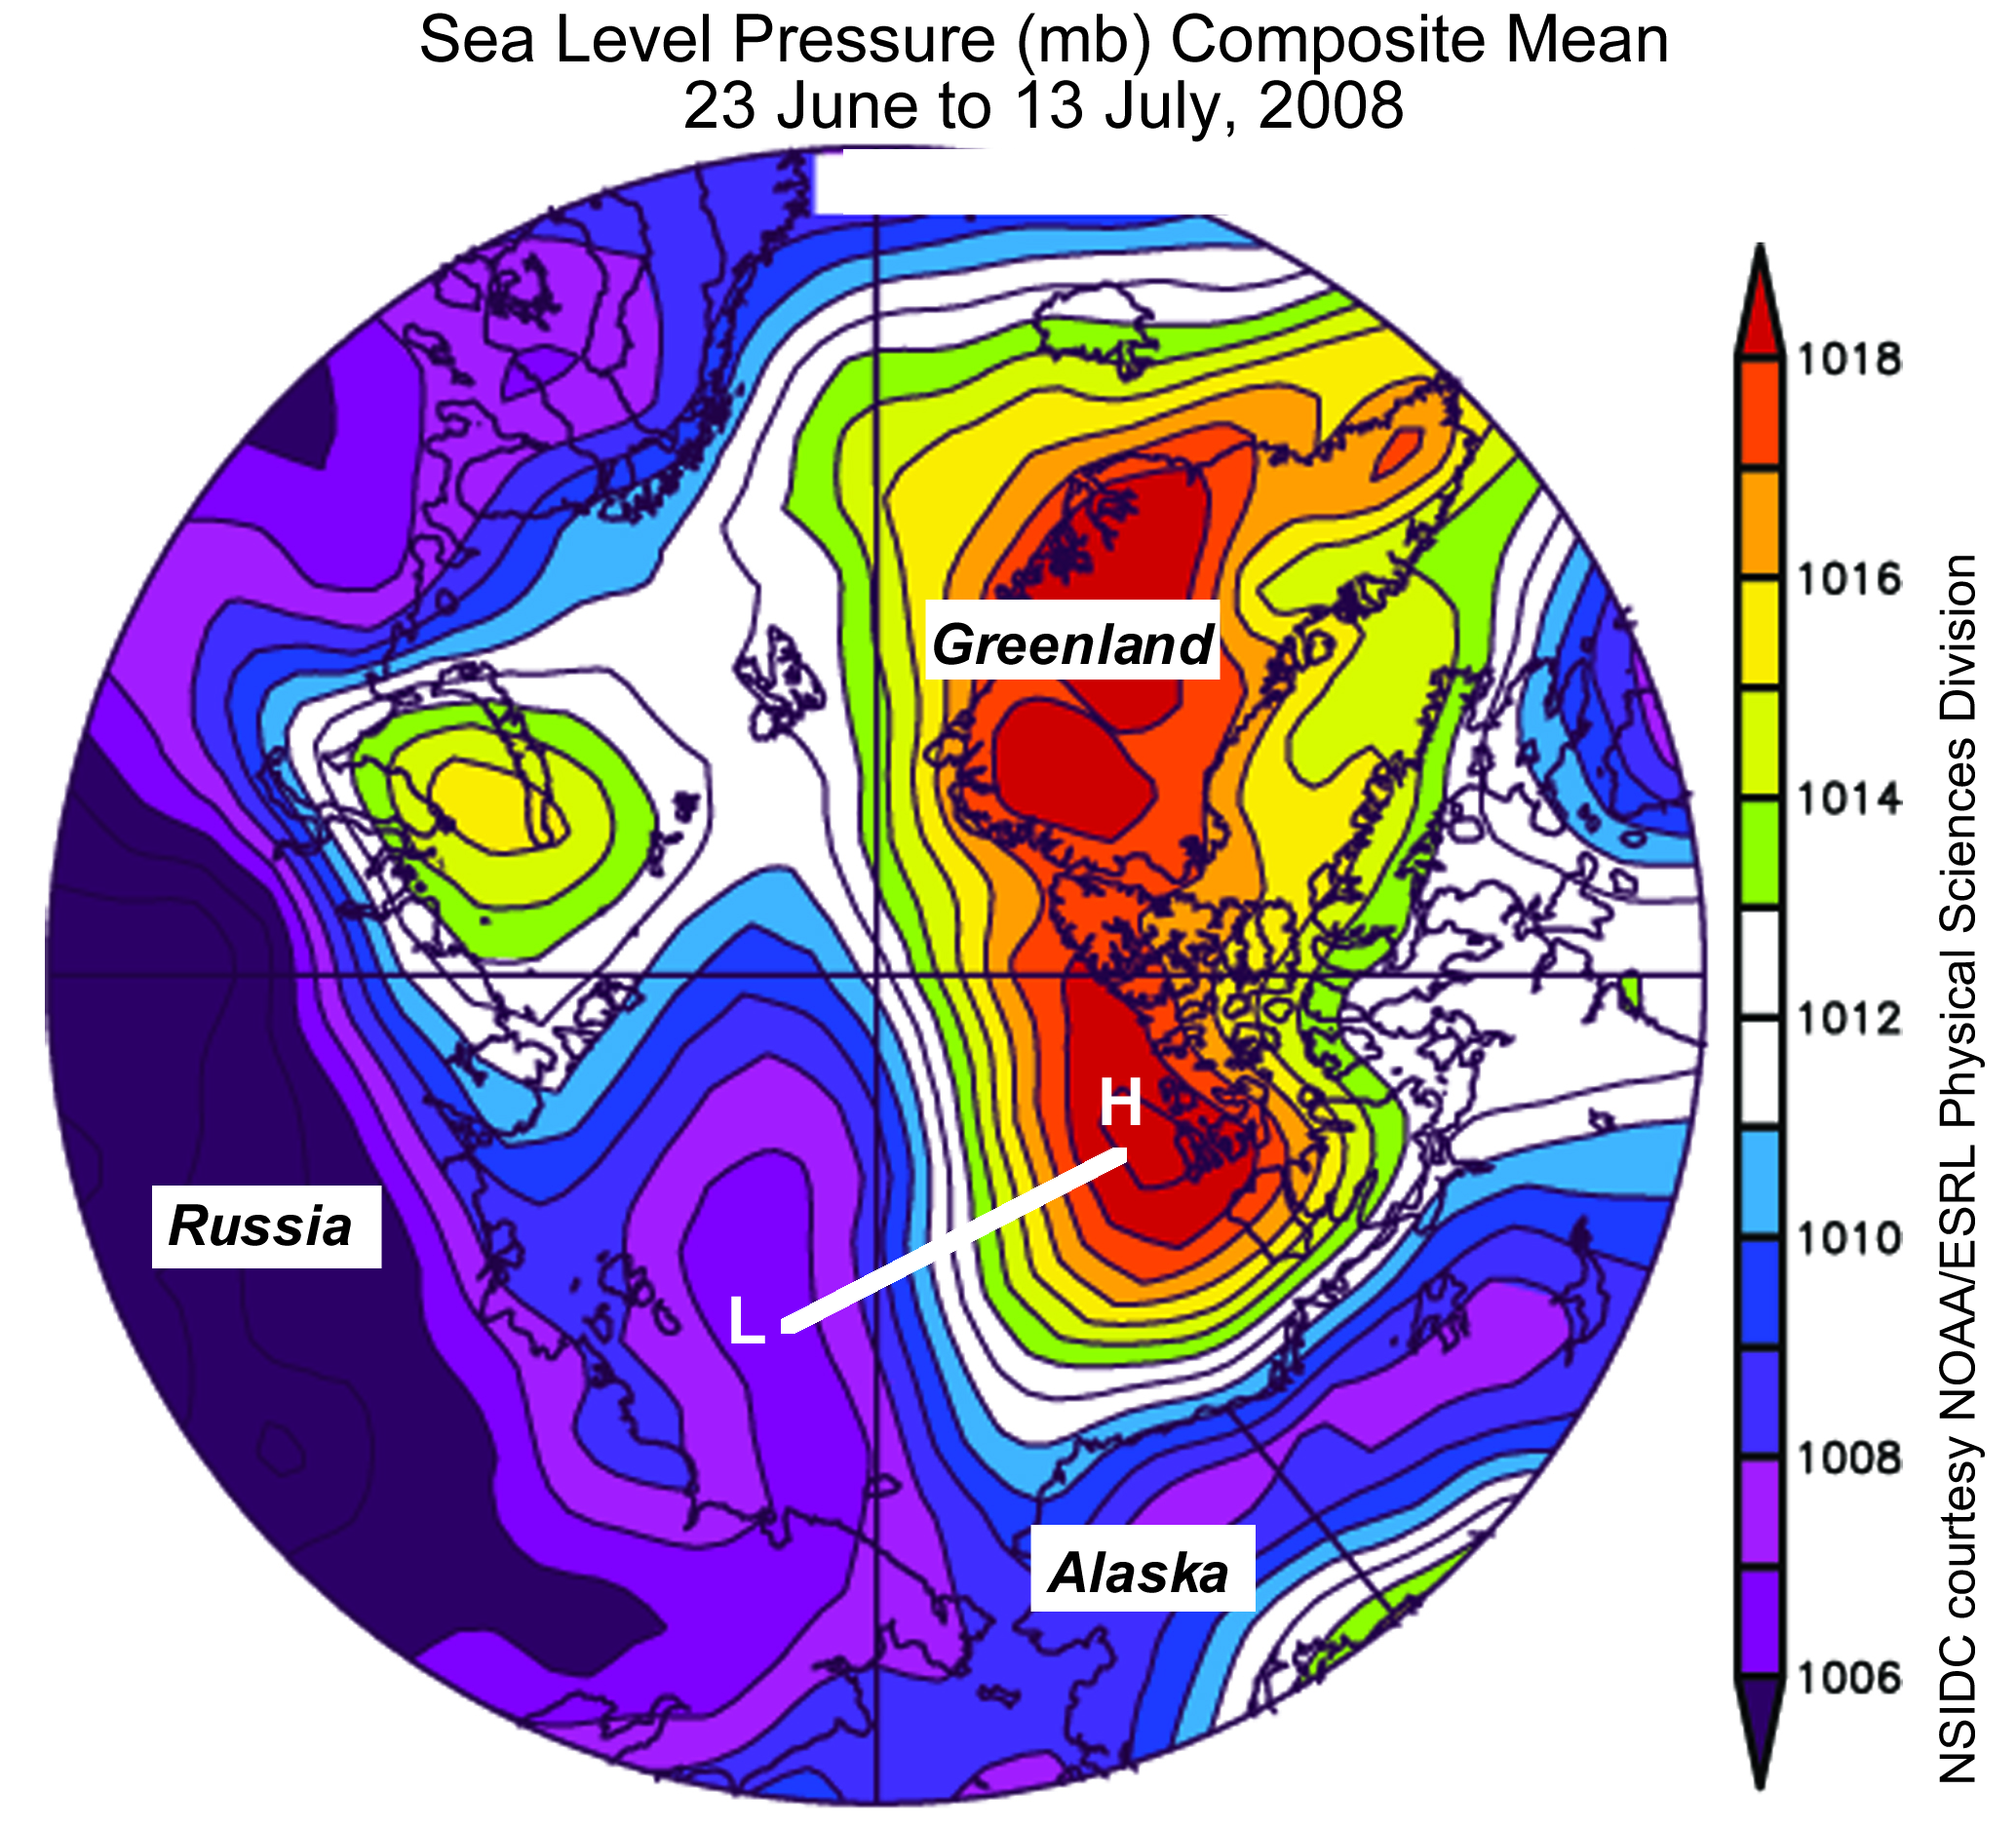
Figure 3: Above is a map of sea-level pressure, averaged for the the three-week period from June 23 through July 13, 2008. Areas of high pressure are shown in yellow and red; areas of low pressure are shown in blue and purple.Thin lines indicate isobars, which connect areas of equal pressure. Winds between high- and low-pressure areas, indicated by "H" and "L," respectively, are from the south.
—Credit: From National Snow and Ice Data Center courtesy Climate Diagnostic Center
See High Resolution Image
Winds from the south
The spatial pattern of sea ice concentration, discussed above, is influenced by atmospheric circulation patterns. Figure 3 shows the pattern of sea-level pressure averaged over the three-week period from June 23 through July 13, 2008.
Winds tend to blow parallel to the isobar lines with a strength proportional to the pressure gradient; the closer the spacing between the isobars, the stronger the wind. The direction of the wind is determined from Buys Ballot's Law, which states that if you are standing with your back to the wind in the Northern Hemisphere, low pressure will be on your left, and high pressure will be on your right.
So, from Figure 3, we can see that the tightly spaced isobars between the high-pressure cell in the Canadian Arctic Islands and lower pressure in the East Siberian Sea points to strong and persistent winds from the south. This wind pattern helps transport sea ice poleward, away from the Alaska coast, and favors the development of open water in the area.


Figure 4. This image is a map of air-temperature anomalies at the 925 millibar level (about 3,000 ft. above the surface), averaged for the three-week period from June 23 through July 13, 2008. Yellow and red indicate areas with above-average temperature; blue and purple indicate areas with below-average temperature.
Warm winds contribute to melt
In addition to pushing sea ice poleward, winds from the south tend to be warmer. Figure 4 shows a map of air-temperature anomalies averaged for the three-week period from June 23 through 13, 2008. While temperatures over most of the Arctic Ocean have been above normal, they have been particularly warm north of Alaska. There, persistent winds from the south are causing strong melt and reduced ice concentrations.
How is this different from what we saw in the record-breaking year 2007? In early July 2007, an atmospheric pattern developed that featured high pressure over the Beaufort Sea. This pattern promoted especially strong sea ice loss. The pattern that has dominated the summer of 2008, so far, seems less favorable for ice loss. However, the melt season has a long way to go. Furthermore, as discussed above, large areas of the pack ice with fairly low concentrations are likely to melt out soon.

Sea ice thickness update
Previous discussion (see April 7, 2008) presented evidence that much of the Arctic Ocean this winter and spring, including the area near the North Pole, was covered with fairly thin, first-year ice. This thin, young ice is vulnerable to melting completely in summer. The large areas of low-concentration ice discussed above reinforce this concern.
Figure 5 shows sea ice thickness for late winter of 2006, 2007, and 2008 derived from the NASA ICESat laser altimeter instrument and provided by Ronald Kwok at the Jet Propulsion Laboratory. Based on Kwok's analysis, the first-year ice that formed since last autumn, while spatially extensive, has a mean thickness of 1.6 m (5.2 ft.), which is close to the thickness seen in 2006 and 2007. Much of this season's first-year ice formed rather late last autumn, so we had expected to see thinner first-year ice.So why is the first-year ice thicker than anticipated? Sparse snow cover last winter may have hastened its growth: less snow on the ice means less insulation from the frigid winter air, and faster ice growth. Much of the snowfall over the Arctic Ocean occurs in early autumn, but early last autumn much of the Arctic Ocean was still ice-free and could not collect snow. Once the ice formed, it grew quickly.
In contrast to the first-year ice, the multi-year ice in 2008 appears to be much thinner than in the past two years. One factor may be the strong basal melt, or melt at the underside of the ice, observed during summer 2007. Based on Kwok's ice motion analysis, another factor could be an unusually high export of thick ice out of the Arctic Ocean through Nares Strait, the narrow strait between the Lincoln Sea and Baffin Bay. This export the multi-year ice outflow through the Fram Strait.
Link to National Snow and Ice Data Center: http://nsidc.org/arcticseaicenews/
Thanks to B. Buckner for a heads up on this information.


2 comments:
One can observe that NSIDC doesn't say much on evolution/predictions this month... Situation may evolve in a not-so-bad way (ie, less worse than last year), due to different wind patterns.
However, I tend to think that the quite thin ice will be much more vulnerable; this ice is fragmented, which augments the size of the ice/water and ice/air interfaces - thus thawing faster...
And, the bulletin seems to occur twice a month now. Sure it's going to be the Summer's Thriller...
Please have a look at Tamino's latest post in his Open Mind blog -- the link is in the upper left-hand corner of my blog.
Post a Comment