Blog Archive

Showing posts sorted by relevance for query sea level rise. Sort by date Show all posts

Thursday, December 12, 2013

Sea Level and Risk of Flooding Rising Rapidly in Mid-Atlantic

by Andrew Freedman, Climate Central, December 12, 2013


During the 20th century, sea levels along the highly populated U.S. Mid-Atlantic coastline between New York and Virginia rose faster than in any other century during the past 4,300 years, according to a new study. And as those sea levels continue to increase as a result of global warming and local land elevation changes, the risks of coastal flooding will dramatically escalate.
The study, by geoscientists at Rutgers and Tufts Universities and published in the new journal “Earth’s Future,” took a comprehensive look at the history of sea level in the Mid-Atlantic, combining sediment records of prehistoric sea level with modern data, which includes readings from tide gauges and satellite instruments. The result is one of the most in-depth examinations of past, present, and future sea level rise of any region in the U.S.
The amusement pier in Seaside Heights, NJ, was heavily damaged by Hurricane Sandy. Credit: Master Sgt. Mark C. Olsen, New Jersey Air National Guard.
The study warns that regional planners will need to factor local rates of sea level rise when making decisions on building any long-lasting infrastructure, from water treatment facilities to Manhattan skyscrapers and Atlantic City casinos.
For example, the study estimated that the New Jersey shore will likely see a sea level rise of about 1.5 feet by 2050, and about 3.5 feet by 2100, at least a foot higher than the average global sea level rise over the rest of the century. Using a middle-range scenario for future sea level rise, the study found that by 2050, flooding caused by a 10-year storm, which has a 10% probability of occurring each year, would exceed all historic storms in Atlantic City.
According to the study, relative sea levels in the Mid-Atlantic region rose at about 0.10 inches per year during the 19th century, and that rate accelerated to 0.15 inches per year during the 20th century. That may not sound like much, but it is already enough to make a major difference when storms strike.
The impact from Hurricane Sandy clearly illustrates that. The study found that a 7.87-inch global sea level rise during the 20th century, which was largely driven by manmade global warming, caused Hurricane Sandy to flood an additional 27 square miles compared to what it would have if the storm had struck in 1880 when sea levels were lower. Using figures from Climate Central’s sea level rise database, the researchers (who were not affiliated with Climate Central) found that sea level rise exposed an additional 83,000 people to coastal flooding, with about 45,000 in New York City and the rest in New Jersey.
While two factors largely control global average sea level — temperature and variations in the volume of the Earth’s ice sheets and mountain glaciers — local rates of relative sea level rise are more complicated.
While the U.N. Intergovernmental Panel on Climate Change (IPCC) projected that global mean sea level rise for 2081-2100 will likely be between 10 and 32 inches, those numbers mean little to local policymakers, who must make decisions based on local sea level rise rates that often differ from the global average. Those differences are the result of several factors, including ocean currents that can cause faster or slower rates of sea level rise in some areas, groundwater depletion, which can result in sinking land, and gradual post-ice age adjustments of the land.
In the Mid-Atlantic region, it turns out, all three of these factors are conspiring to accelerate sea level rise. Every part of the region saw the level rise at a faster rate than the global trend, the study found. In fact, that rate since the early 1900s was nearly double the global average.
Locations that sit atop a coastal plain, such as the Jersey Shore, are seeing the fastest rates of sea level rise compared to those Mid-Atlantic coastal locations that are built on top of bedrock, such as New York City, since the geology of the coastal plain features more settling of the land from groundwater depletion and long-term sediment compaction. Other studies have also identified the Mid-Atlantic as a so-called “hot spot” of sea level rise, but the new research provides more statistical proof that modern sea level rise in this region is outpacing even periods from several thousand years ago. 
“The study highlights the importance of geological data when making predictions for coastal inundation during the 21st century and that it is important to take a regional approach,” Simon Engelhardt, a professor at the University of Rhode Island who was not involved in the new study, said in an email.
Comparison of tide gauges along the coast with the Battery in Manhattan, showing sea levels are rising slightly faster along the coastal plain than in Manhattan. (The tide-gauge records are referenced to a synthetic 1900–1920 datum.)  Click image to enlarge. Credit: Miller et al. 2013.

To put recent rates of sea level rise into historical perspective, the study found there is at least a 95% probability that the rate of sea level rise in the Mid-Atlantic during the 20th century was faster than any century in the past 4,300 years, and a 67% probability that it was faster than any century in more than 6,600 years.
“The sea level rise that we’re seeing now is very significant,” including in a “prehistoric context,” said study co-author Ben Horton of Rutgers University, in an interview.
The study projects that lower Manhattan will see about 8.6 inches of sea level rise by 2030, 15.7 inches by 2050, and 38 inches, or just more than 3 feet, by 2100. The 15.7 inches of sea level rise by 2050 would be sufficient to transform what would be considered a moderate 10-year storm today to reach the same flood level as a 100-year storm would. The higher-end scenario considered in the study would bring 5.5 feet of sea level rise to Lower Manhattan by 2100. That would cause a 10-year storm event to bring flooding comparable to Hurricane Sandy, which brought the highest storm tide on record to Lower Manhattan. Every subway tunnel connecting Manhattan with Brooklyn and Queens flooded, along with transit stations in adjacent areas of New Jersey and all three of the city's major airport hubs.
A separate study published in 2012 found that similar increases in storm surge risk would occur at many other coastal locations in the U.S.
Assuming continued groundwater extraction rates at coastal plain locations, those areas would see a greater amount of sea level rise, the study found. The study projected that those areas could be in for a rise of 9.8 inches by 2030, 1.5 feet by 2050, and about 3.5 feet, by 2100.
While the study shows that the main component of future sea level rise will be from global sea level rise, local land elevation changes should be factored into development decisions, since they will influence the rate and extent of relative sea level rise at the local level. The study noted that there are currently limited tools for policymakers to use to factor in sea level rise to the planning process.
Even the Federal Emergency Management Agency’s newest flood elevation data, released this year and used to help determine federal flood insurance requirements, failed to include sea level rise projections. “They are accordingly relevant to insuring against current risks but do not provide appropriate guidance for long-term planning,” the study said.

Friday, June 15, 2012

Dr. Jeff Masters' take on North Carolina's declaring sea level rise invisible

North Carolina ignores science in sea level planning


by Dr. Jeff Masters, WunderBlog, June 12, 2012


An interesting political battle is underway in North Carolina on how to plan for 21st century sea level rise, newsobserver.com reports. Sea level rise scientists commonly cite one meter (3.3 feet) as the expected global sea level rise by 2100, and more than a dozen science panels from coastal states, including a state-appointed science panel in North Carolina, agree. However, a coastal economic development group called NC-20, named for the 20 coastal counties in North Carolina, attacked the report, saying the science was flawed. NC-20 says the state should rely only on historical trends of sea level rise, and not plan for a future where sea level rise might accelerate. North Carolina should plan for only 8 inches of rise by 2100, based on the historical trend in Wilmington, NC, the group says. Republican state legislators introduced a bill that follows this logic, requiring the North Carolina Coastal Resources Commission to make development plans assuming sea level rise will not accelerate. On Thursday, a state senate committee signed off on the bill, sending it to the full Senate. NC-20 also successfully made an "intense push" to get the North Carolina Division of Emergency Management, which is using a $5 million federal grant to analyze the impact of rising water, to lower its worst-case sea level rise scenario from 1 meter (39 inches) to 15 inches by 2100. 


FIgure 1. Global sea level rise from 1992 to April 2012 as measured by three satellite instruments (TOPEX, Jason-1, and Jason-2). Sea level rise has been relatively constant at about 3.1 mm per year (1.2 inches per decade) during this time period. The big downward dip during 2010 is due to the fact that year had a record amount of precipitation over land areas. By 2011, that precipitation had run-off into the oceans, bringing sea level back up again. Image credit: University of Colorado Sea Level Research Group.

Commentary
East Carolina University geologist Stan Riggs, a science panel member and coastal science expert, said of the proposed legislation, “We’re throwing this science out completely, and what’s proposed is just crazy for a state that used to be a leader in marine science. You can’t legislate the ocean, and you can’t legislate storms.” 


Our climate change blogger, Dr. Ricky Rood, had this to say in his latest post: "I would dismiss the proposed law as an attempt to legislate away that which stands in the way of our desires to consume and build for our personal imperatives. I would dismiss it as politics and note the names of the un-serious politicians for the next election." 


I agree with both of these assessments. The best science we have argues the planet will continue to warm, melting icecaps, causing accelerated sea level rise. Between 1900 and 2007, global sea level rose at 1.7 mm per year (Bindoff et al., 2007). Between 1993 and 2012, sea level rise accelerated to 3.1 mm per year, a 75% increase over the 20th century rate. If this accelerated rate continues to 2100, global sea level rise will be 10.7 inches, which is higher than the 8-inch rise North Carolina is being told to plan for. 


The continuing accelerating trend in Greenland ice loss since 2000 I blogged about last month should make anyone leery of betting that sea level rise will not accelerate even more in the coming decades. Betting that sea level rise won't accelerate this century is like betting that a slowly intensifying tropical storm will maintain that slow rate of intensification, ignoring that the majority of the computer models are predicting the storm will rapidly intensify into a Category 3 hurricane at landfall. Sure, sometimes the models are wrong, but there is good science behind their predictions. If we wait until storm begins its rapid intensification to act, it will be a very costly mistake. The most sound action would be to prepare for the very plausible bad outcome our science is saying is most likely, instead of putting all of our chips on the low-probability, good-for-business outcome we hope for.

Sea, No Evil
Comedian Steven Colbert has a humorous piece on the new North Carolina sea level legislation in his June 4, 2012, Colbert Report. He uses the phrase "Sea, No Evil" to describe the affair. Some quotes:

"It would be a tragedy to lose precious coastal wildlife habitats to coastal flooding. Those habitats should be lost to developers' bulldozers."

"If your science gives you a result that you don't like, pass a law that the result is illegal--problem solved!"

Comedy Central reports on the recent decision by Virginia lawmakers to phase out use of the terms "climate change" and "sea level rise."

Resources:
Scientific America blog on the North Carolina sea level rise battle.
Wunderground's Greenland page.
Wunderground's sea level rise page.


http://www.wunderground.com/blog/JeffMasters/comment.html?entrynum=2118

Saturday, April 10, 2010

Stefan Rahmstorf: A new view on sea level rise

Nature Reports Climate Change, published online 6 April 2010; doi: 10.1038/climate.2010.29

A new view on sea level rise

by Stefan Rahmstorf

Has the IPCC underestimated the risk of sea level rise?
A new view on sea level rise
Recent studies predict that sea level could rise by more than one metre this century if greenhouse gas emissions continue to escalate. STEFAN RAHMSTORF
In its 2007 report1, the Intergovernmental Panel on Climate Change (IPCC) projected a global sea level rise of 18 to 59 centimetres from 1990 to the 2090s, plus an unspecified amount that could come from changes in the large ice sheets covering Greenland and Antarctica.

But the physical climate models used by the IPCC have some limitations, prompting the search for alternative approaches to estimating sea level rise. New semi-empirical approaches are based on the idea that the rate of sea level rise is proportional to the amount of global warming — the warmer it gets, the faster ice melts — and they use past sea level and temperature data to quantify this effect.

Over the course of the twentieth century, the rate of sea level rise has roughly tripled in response to 0.8 °C global warming2. Since the beginning of satellite measurements, sea level has risen about 80% faster, at 3.4 mm per year3, than the average IPCC model projection of 1.9 mm per year. The difference between the semi-empirical estimates and the model-based estimates of the IPCC can be attributed largely to the response of continental ice to greenhouse warming. The IPCC range assumes a near-zero net contribution of the Greenland and Antarctic ice sheets to future sea level rise, on the basis that Antarctica is expected to gain mass from an increase in snowfall. Observations show, however, that both ice sheets have been losing mass at an accelerating rate over the past two decades4.

A number of recent studies taking the semi-empirical approach have predicted much higher sea level rise for the 21st century than the IPCC, exceeding one metre if greenhouse gas emissions continue to escalate (Fig. 1). These new results have found wide recognition in the scientific community, as recent broad-based assessments show5, 6, 7. The question is: how plausible are the new estimates?

Figure 1: Range of rises.

Figure 1 : Range of rises. Unfortunately we are unable to provide accessible alternative text for this. If you require assistance to access this image, or to obtain a text description, please contact npg@nature.comEstimates for twenty-first century sea level rise from semi-empirical models2, 8, 16, 17, 18 as compared to the IPCC Fourth Assessment Report (AR4)1. For exact definitions of the time periods and emissions scenarios considered, see the original references. Full figure and legend (13 KB)

Although the popular media tend to focus on the upper limits of these projections, reaching the upper limits is, by definition, extremely unlikely. And at the high temperatures that produce extreme rises in sea level, predicting the response of the climate system is difficult. Upper limits also depend on how uncertainties are treated. Comparing the central estimates of sea level rise projections is therefore more informative. For a moderately pessimistic emissions scenario, named A1B, which results in about 3 °C global warming above the 1990 level by the 2090s, the IPCC projects 35 cm of sea level rise. This, rather implausibly, assumes no acceleration beyond the rate of sea level rise observed during the past 15 years, despite temperatures increasing by four times as much as in the twentieth century. A recent study by Martin Vermeer and me8, in contrast, yields a central estimate of 124 cm by 2100 and 114 cm by 2095.

All the ice

Semi-empirical models have the merit that they reproduce past sea level rise very well, unlike the physical models used thus far. But they too have a serious limitation: there is no way to ensure that the historic relationship between sea level rise and temperature will continue to hold in future.

So how can we critically assess the robustness of the empirical relationship? Global warming raises sea level through two processes: thermal expansion of the ocean, and the addition of water to the ocean from melting land ice. For thermal expansion, researchers have tested the semi-empirical methods against complex ocean–atmosphere models and found that the sea level response of these vastly more complex physical models is reproduced well8. If the physical models do a good job on thermal expansion, then so will suitable semi-empirical models.

Whether the response of continental ice to warming is well represented by empirical models is harder to judge, though the linear dependence on temperature is similar to that also used in glacier modelling studies and by the IPCC. The semi-empirical approach, however, was recently criticized in the popular media9 on the grounds that it is, to a large extent, calibrated to the past glacier contribution, and that glaciers would be “largely gone by 2050.” Apart from this being just not so, the melting of all glaciers would add 60 cm to global sea level10, a lot more than in the worst-case scenario projected by semi-empirical models for 2050. And that contribution would be in addition to seawater expansion and melting of continental ice sheets.

Perhaps a more important argument is that the semi-empirical method does not treat mountain glaciers separately from ice sheets, but considers all ice as a continuum. The melting rate of an ice surface depends on the local climate, not on whether this ice surface is part of a small mountain glacier or a big ice sheet. The climatic conditions under which glaciers and ice sheets exist overlap. So, for example, the total ice surface found currently in regions with an annual mean air temperature of −12 °C consists of almost equal shares of ice from glaciers and ice sheets. In warmer regions the share from glaciers is larger, and in colder regions the share from ice sheets is larger. At −12 °C annual mean temperature, the ice is already affected by melting during some days of the year. As the global climate warms, some of the glacier ice will vanish, but this will be compensated for as ice at colder temperatures — including that from ice sheets — becomes subject to melting. The linear relationship in the semi-empirical formulae therefore will not fail anytime soon because we are running out of ice to melt.

But this view considers only surface mass balance, without taking account of the kind of rapid, nonlinear ice-flow changes that some glaciologists expect for the future. The semi-empirical approach has been criticized for not accounting for such changes; if they indeed lie in wait, this approach will, if anything, underestimate future sea level rise.

Melt math

Of the IPCC's central estimate for the A1B scenario of 35 cm of sea level rise by the 2090s, most — some 23 cm — is expected to result from thermal expansion of the ocean. If this is correct, we can subtract those 23 cm from our sea level rise estimate of 114 cm to give 91 cm, or 80% of the total rise, that would need to come from land ice melting. Such a scenario is hardly inconceivable, given that land ice has, in fact, contributed 80% of the observed sea level rise over the past five years11.

If two-thirds of glacier ice were lost, this would add 40 cm to the global sea level, which is close to the lower bound of 37 cm recently estimated by glacier experts12. In that case, the percentage contribution of glacier melting to sea level rise would remain the same as in past decades13. The big ice sheets would then need to contribute only about 50 cm — corresponding to less than 1% of their mass — to bring sea level rise up to 114 cm. None of this appears any less plausible than the IPCC's assumptions.

At the end of the last ice age, the Earth slowly warmed by 4–7 °C globally14 and lost almost two-thirds of its land ice in the process. That raised sea level by 120 metres, at rates often exceeding a metre per century1. It seems that nothing in the present ice-sheet configuration would rule out similar rates in future15. How much of the remaining 65 metres' worth of land ice will humans melt if we warm the planet by a further several degrees?

Stefan Rahmstorf is Professor of Physics of the Oceans at the Potsdam Institute for Climate Impact Research in Potsdam, Germany.  e-mail: stefan@pik-potsdam.de

Monday, August 12, 2013

How much will sea levels rise in the 21st Century?

Posted on 5 August 2013 by gpwayne, Skeptical Science

This post is a new 'basic' level rebuttal of the myth: "Sea level rise predictions are exaggerated."

What the science says:

Sea levels are rising faster now than in the previous century, and could rise between 50 cm to 1.5 metres by 2100

Measuring Sea Levels

Sea levels are rising due to thermal expansion and melting of land-based ice. Global warming is causing the oceans to absorb a lot of extra heat (up to 90%). This makes the volume of water expand, and sea levels rise. The Greenland and Antarctic ice caps, and many of the world’s glaciers, are all slowly melting. The runoff feeds into rivers and directly into the oceans. This too adds to sea levels.

Prior to the use of satellite systems, measurements were taken using tide-gauges, devices that measure the height of a water level relative to a fixed point on land. Global estimates of sea level rise were subject to substantial differences in measurement from different parts of the world.

Sea levels change all the time. They are affected by seasons, astronomical tides, storm surges, currents and density, among other influences. Tidal gauges reflect these short term influences, introducing a large margin of error.

The IPCC Fourth Assessment Report described studies that estimated sea level rise for the 20th century between 0.5 and 3.0 mm a year. The most likely range, according to the IPCC, was between 1.0 and 2.0 mm a year.
Satellite altimetry since 1993 provides a more accurate measure of global sea level rise. Three different satellites take measurements: TOPEX/Poseidon (launched 1992), Jason-1 (launched 2001) and Jason-2 (launched 2008).

Figure 1: Source - CSIRO
The IPCC projections are derived from climate models. Using both tide gauge and satellite data, we can see that sea levels are rising. Unfortunately, sea level rise is already tracking the worst-case projections, as this graph shows:
 
 
Figure 2. Sea level change. Tide gauge data are indicated in red and satellite data in blue. The grey band shows the projections of the IPCC Third Assessment report (Allison et al. 2009).

In fact, the climate models underestimated the rate of sea level rise because the rapid melting of the ice sheets and glaciers was not incorporated in the last IPCC report. (It was left out because the data were not considered sufficiently robust).

Damaging Potential

Rising sea levels are widely considered to be the greatest threat posed by climate change. They threaten low-lying countries with inundation, forcing inhabitants to migrate.  Coastal cities and ports could be flooded, as could cities sited near tidal estuaries, like London. Many nuclear installations are built by the sea so they can use sea water for cooling.

The potential for sea level rise is enormous. This is because the ice caps – Greenland and Antarctic – contain huge amounts of fresh water – around 70% of all the freshwater on Earth. Estimates suggest that if the Greenland ice sheet was to melt away to nothing, sea levels would rise around 6 metres. To put that a different way, a loss of just one per cent of the Greenland ice cap would result in a sea level rise of 6 cm. 

If the West Antarctic Ice Sheet (WAIS) were to melt, this would add around 6 metres to sea levels. If the East Antarctic Ice Sheet (EAIS) were to melt as well, seas would rise by around 70 metres.

In a process that is accelerating, all three ice caps are losing mass. While nobody is suggesting any of the ice caps will melt away to nothing, only a small amount of melting would cause great problems.

A 1% loss of ice from these three sources would produce a likely increase in sea levels of around 76 cm. With the thermal expansion implied by such melting, and contributions from melting glaciers, the oceans would actually rise far more.

Predictions for future sea levels

Future sea level rises depend on a number of factors. The amount of CO2 emitted will determine how much global warming takes place. The amount of ice that melts will vary according to the amount of global warming. The same is true of thermal expansion.

Previous estimates of sea level rise have been based on a set of possible outcomes called emissions scenarios. These theoretical scenarios range from emissions which fall very quickly, to emissions that continue to rise even faster than they have already. Scientists then calculate possible outcomes for each scenario.

In the next IPCC report (AR5), due in 2014, a new method has been used. Emission scenarios have been replaced by Representative Concentration Pathways (RCP). Four trajectories were chosen, based not on emissions, but possible greenhouse gas concentrations in the year 2100. From the concentrations, the RCPs project a ‘forcing’ for each pathway (the amount of warming); 2.6, 4.5, 6.0, and 8.5 Watts per metre squared. Each pathway is named after its forcing, e.g., RCP4.5. The lowest emission scenario is also referred to as RCP3PD, because it posits a peak warming of 3 w/m2  by 2070 (~490 ppm CO2 and equivalents), and a reduction to 2.6 w/m2 by 2100. (PD stands for Peak/Decline). 

A draft version of the next report from the IPCC (AR5), due for publication soon, was recently leaked. Although the information is subject to change, the draft report says sea levels are likely to rise by between 29 and 82 centimeters by the end of the century (compared to 18–59 centimeters in the 2007 report).

Other recent studies have projected comparable sea level increases. Jevrejeva 2011, for example, modeled sea level rise using RCP scenarios. This table shows best and worst cases (RCP3PD and RCP8.5), with two in between. The figures for each projection are listed in this table:

Table 1. Projected sea level rise (m) by 2100 for the RCP scenarios. Results presented as median, upper (95% confidence interval) and lower (5% confidence interval) limits, calculated from 2,000,000 model runs. Sea level rise is given relative the period 1980–2000 (Jevrejeva 2011).

Another study (Rahmstorf 2011) obtained much the same results:

Figure 4. Sea level hindcasts and projections for different models calibrated with different temperature and sea level data. The error bars on the right indicate 90% confidence intervals (5–95 percentile, using the GISS temperature dataset); for the proxy-based projection the uncertainty is as presented in Kemp et al. (2011) (Rahmstorf 2011).

What's in the pipeline? 

The 'pipeline' is a term used to describe the slow reaction of the oceans to heating (inertia). Even if we were to stop emitting greenhouse gases tomorrow, the oceans would continue to rise, driven by the heat already stored. (90% of all the sun's energy falling on the surface of Earth is absorbed by the oceans as heat). This sea level rise is said to be 'in the pipeline.'

A paper published in PNAS (Levermann 2013) has found that greenhouse gases emitted today will cause sea levels to rise for several centuries. For every degree of warming, sea levels will rise by more than 2 meters in the next few centuries. The Earth's temperature has already risen 0.8 degrees C over pre-industrial temperatures. 
Jevrejeva 2011 also found increased rates of sea level rise, even if emissions were to stabilise at 490 ppm by 2070 following the scenario in RCP3PD (RCP2.6):

Table 2. Projected sea level rise (m) by 2500 for the RCP scenarios. Results presented as median, upper (95% confidence interval) and lower (5% confidence interval) limits, calculated from 2,000,000 runs of the model. Values of sea level rise are given relative the period 1980–2000.

Conclusion

Based on the new mid-range IPCC  RCP4.5 scenario (around 650 ppm CO2 and equivalents producing a forcing of approximately 4.5 watts/metre2) the most likely sea level rise by 2100 is between 80 cm and 1 metre. Longer term, sea levels will continue to rise even after emissions have been reduced or eliminated. 

Wednesday, December 4, 2013

Experts say the IPCC underestimated future sea level rise

A new study surveys 90 sea level rise experts, who say sea level rise this century will exceed IPCC projections

by John Abraham, Climate Consensus -- The 97%, The Guardian, December 4, 2013


jacksonville sea level
Sea level rise over the next century depends on future greenhouse gas emissions. Photograph: Jon M Fletcher/AP
It looks like past IPCC predictions of sea level rise were too conservative; things are worse than we thought. That is the takeaway message from a new study out in Quaternary Science Reviews and from updates to the IPCC report itself. The new study, which is also discussed in depth on RealClimate, tries to determine what our sea levels will be in the future. What they found isn't pretty.
Predicting of sea level rise is a challenging business. While we have good information about what has happened in the past, we still have trouble looking into the future. So, what do we know? Well it is clear that sea levels began to rise about 100 years ago. This rise coincided with increasing global temperatures.
What causes sea level to rise? Really three things. First, water expands as it heats. Second, glaciers melt and water flows to the oceans. Third, the large ice caps on Greenland and Antarctica can melt and the liquid water enters the ocean; often the water transfer is added by calving at the ice fronts which result in icebergs that float into the ocean. In the past, much of the sea level rise was related to the first cause (thermal expansion). Now, however, more and more sea level rise is being caused by melting ice.
But this is all the past. What we really want to know is, how much will sea level rise in the future? There are a number of ways to predict the future. First, we can look at the deep past and see how sea level changed with Earth temperature long ago.
A second way to predict the future is through computational models. These models are computer programs which create a virtual-reality of the Earth. These virtual reality models are very useful because they allow scientists to play "what if" scenarios; but, they have their weaknesses as well. One of their weaknesses is that they don't necessarily capture all of the phenomena which cause sea level rise. It is believed by most scientists that the computer programs are too conservative.
How does this all relate to the current study? Well the authors took a different approach. They decided to ask the scientists themselves. What do they think sea level rise will be by 2100 and 2300 under different greenhouse gas scenarios? The authors found 360 sea-level experts through a literature survey. They then worked to find contact information for these scientists and finally, they sent a questionnaire. After receiving 90 expert judgments from 18 countries, the results were tallied. So, what do experts think?
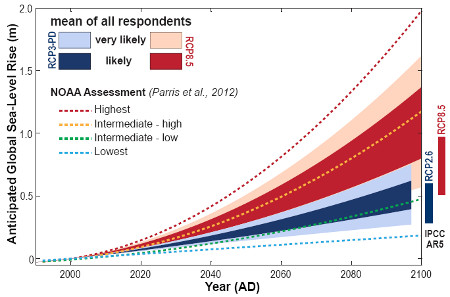
Sea level rise over the period 2000–2100 for high and low warming scenarios. The ranges show the average numbers given across all the experts. For comparison we see the NOAA projections of December 2012 (dashed lines) and the new IPCC projections (bars on the right).Sea level rise over the period 2000–2100 for high and low warming scenarios. The ranges show the average numbers given across all the experts. For comparison we see the NOAA projections of December 2012 (dashed lines) and the new IPCC projections (bars on the right).
According to the best case scenario (humans take very aggressive action to reduce greenhouse gases), the experts think sea level rise will likely be about 0.4–0.6 meters (1.3–2.0 feet) by 2100 and 0.6–1.0 meters (2.0–3.3 feet) by 2300. According to the more likely higher emission scenario, the results are 0.7–1.2 meters (2.3–3.9 feet) by 2100 and 2.0–3.0 meters (6.5–9.8 feet) by 2300. These are significantly larger than the predictions set forth in the recently published IPCC AR5 report. They reflect what my colleagues, particularly scientists at NOAA, have been telling me for about three years.

How should we plan for this rise? Some areas can be protected by expensive walling off of ocean water. Other locations simply cannot be saved. Particularly, in areas that have porous subsurfaces, it isn't possible to stop the rising waters. Dealing with the costs of relocation, storm surges, and rising waters will be expensive. This is just another reason why reducing emissions is the best, most cost effective way of adapting to climate change.
http://www.theguardian.com/environment/climate-consensus-97-per-cent/2013/dec/04/experts-ipcc-underestimated-sea-level-rise

Tuesday, February 26, 2013

Peter Gleick: (Mis)Understanding Sea-Level Rise (SLR) and Climate Impacts


Peter Gleick,  Significant Figures, ScienceBlogs, February 26, 2013

One of the most important and threatening risks of climate change is sea-level rise (SLR). The mechanisms are well understood, and the direction of changes in sea-level is highly certain – it is rising and the rate of rise will accelerate. There remain plenty of uncertainties (i.e., a range of possible outcomes) about the timing and rate of rise that have to do with how fast we continue to put greenhouse gases in the atmosphere, the responses of (especially) ice sheets in Greenland and Antarctica, and the sensitivity of the climate.


Even little changes can have big consequences. As we saw with Superstorm Sandy, where extremely severe weather was combined with a very high tide, on top of sea levels that have risen six to nine inches over the past century, even a little bit of sea-level rise around the world has the potential to cause hundreds of billions of dollars of damages and the displacement of millions of people.
The Pacific Institute, among many other organizations, has been working to understand and evaluate the nature of the threat of sea-level rise and the risks posed to coastal populations, property, and ecosystems. In 1990, a colleague and I published the first detailed mapping and economic assessment of the risks of sea-level rise to the San Francisco Bay Area, looking at populations at risk, the value of property in new flood zones, and the costs of building some kinds of coastal protection (“adaptation”) to protect higher valued assets. That early report can be found here.
Then, in 2009 and 2010, the Pacific Institute, with funding from the State of California, conducted a detailed, high-resolution mapping analysis of the entire coast from Oregon to Mexico. We analyzed a set of sea-level rise scenarios developed by the Scripps Institution of Oceanography and worked with the California Energy Commission, the Metropolitan Transportation Commission, the Ocean Protection Council, the National Oceanic and Atmospheric Administration, the US Geological Survey, FEMA, and others to evaluate the risks to people, property, transportation infrastructure, ecosystems, power plants, wastewater treatment plants, and more, should those scenarios of sea-level rise happen. The full peer-reviewed report, the high resolution maps, specialty maps, and all open source GIS data can be publicly downloaded here. (A peer-reviewed journal article was also published.) That analysis suggests coastal regions are highly vulnerable to even modest sea-level rises with hundreds of thousands of people and more than a hundred billion dollars of infrastructure already in zones at risk of future flooding.
I was reminded this week, however, of the difficulty some people have in understanding the nature of climate risks, when a climate skeptic who shall remain nameless started tweeting his misunderstandings to me without having read our studies (I know this because after I pointed out his errors, he asked me to send the studies to him).  My internet-savvy sons have tried for years (only partly successfully) to teach me: DNFTT. But these tweets offer insights into what might be more general misconceptions, so let me address some of them for those who actually want to help the public understand the real risks of climate change.
Misunderstanding #1: Predication versus Scenario. There is a big difference between a prediction and a scenario. Scenarios are tools for examining how changes in some kind of conditions (such as greenhouse gas concentrations) might affect something else (such as climatic conditions or sea-level). They are stories of possible futures based on a range of assumptions. Almost all studies of climate impacts evaluate scenarios to examine possible future conditions, risks, and threats. Climatologist Gavin Schmidt sometimes uses the following:
  • Forecast: What you think will happen in the future (could be probabilistic), but with no conditionals. Used in weather forecasts, sales forecasts, etc.
  • Prediction: A much broader category of scientific statement that implies a complete specification of the circumstances under which X would be expected.
  • Projection or Scenario: A conditional prediction about the future. i.e., if a certain set of circumstances come to pass, the climate will respond in the following way.
In the case of sea-level rise, climate modelers and oceanographers make projections of how sea-level would react to a range of assumptions about energy use and type, greenhouse gas emissions, and climate and ice sensitivities. These are not predictions. In the case of our reports, we evaluate the implications for coastal regions should these future sea-level rises occur. This is a risk and vulnerability assessment. In fact, for the estimates of sea-level rise in our study, we clearly note that changes could be both smaller or larger, and slower or faster than our evaluation. None of this is actually relevant to our estimate of the things currently at risk from a 1.4 meter rise.
Misunderstanding #2: Linear versus Exponential. There is sometimes confusion in some people’s minds about the difference between a linear trend and an exponential trend. In this case, data on actual changes in sea-level suggest that the recent rates of rise are between 3 and 3.5 millimeters per year. If sea-level changes are linear, then it is easy to project past trends forward: 100 years of rise would add between 0.3 and 0.35 meters. This is what my tweeter did, in an effort to say SLR is a smaller problem than the state-of-the-science 1.4-meter scenario we evaluated. Why the difference? Because climate change, and sea-level responses – are not linear; they are exponential. This means the sea level in the future will rise at an accelerating rate, leading to a much higher end point for any given year. Figure 1 shows this simple concept, but also shows that in the short term, it may be hard to distinguish between the two. A high-school student would get an F for assuming a linear rate for an exponential process. I know of no climate scientist who believes the climate will change in a linear fashion if there is continued exponential growth in greenhouse gas emissions.

Figure 1. Exponential versus linear growth. Note, for a while, it's hard to tell the difference, but then the curves diverge dramatically.
Figure 1. Exponential versus linear growth. Note, for a while, it’s hard to tell the difference, but then the curves diverge dramatically.
Misunderstanding #3: Evaluating Average versus Extreme Risks. Climate scientists are a conservative lot (in the scientific sense, as shown in a recent journal article). As a result, assumptions and scenarios that are typically analyzed (including the ones we used, developed by the Scripps Oceanographic Institute) are in the middle of the range of what could plausibly occur. In particular, even the exponential rate that produces 1.4 meters of rise by around the end of the century includes no rapid acceleration of ice-sheet melt or ablation or other factors that could lead to even faster rates of increase or higher rises. There are some far more disturbing sea-level rise scenarios out there but we didn’t analyze them. Any criticism that the scenarios evaluated were too extreme could be equally balanced by criticism that they were not extreme enough. The most recent report on SLR scenarios for the U.S. offers a range from 0.2 meters to 2 meters by 2100 (see Figure 2).

Figure 2. USGCRP sea-level rise scenarios showing a range. Even more extreme increases are possible, just not considered likely.
Figure 2. USGCRP sea-level rise scenarios showing a range. Even more extreme increases are possible, just not considered likely. Also, note that SLR will not stop in 2100, just because the graph stops there!
Misunderstanding #4: Beware False Dichotomies and Ad Hominem Arguments. This skeptic opened his assault on the sea-level science discussion by arguing that I must not care about sea-level rise because my office was nearly at sea-level. First, a minute spent with Google Earth or a topo map would have shown that our offices are actually around +40 feet above mean sea-level – not in a vulnerable zone even with expected climate change over the next century (barring some more catastrophic scenario), and second, even if my office was in a vulnerable zone, it wouldn’t mean I didn’t care about the future risks of flooding. His ad hominem response was “OK I get it it [sic], the plan is to sit tight and laugh at others [sic] misfortunes.” I know, DNFTT.
Misunderstanding #5. Mitigation versus Adaptation versus Suffering. That same nasty tweet also reveals a deeper misunderstanding about the nature of responses to sea-level rise or any other climate impacts. We only have three options for sea-level rise: trying to reduce the rate of rise (mitigation), coastal defense or retreat (adaptation), and suffering the impacts. People and valuable property in zones threatened by sea-level rise will either suffer greater and greater damage, or will have to be protected with new costly infrastructure, moved away over time in advance of rising seas, or abandoned. These are issues discussed clearly in our studies. Moreover, our work at the Institute explicitly identifies vulnerable populations and strategies to protect them.
This particular climate skeptic lives nowhere near the coast. That could partly explain his lack of understanding or interest in the threats posed by sea-level rise to our extensive coastlines. But the risks facing his own community include growing heat stress and extreme temperatures, loss of inexpensive local hydropower generation, increased forest fire risks, greater air pollution, and, should sea-level rise get really bad, migration of lots of people to his community! More on these risks later.
Let’s put these errors and misunderstandings to rest and begin the necessary climate mitigation and adaptation responses, soon, or those exponential curves will begin to bite.