Blog Archive

Wednesday, June 6, 2012

NSIDC Arctic Sea Ice Report, June 6, 2012: Arctic sea ice variable, ends May below average


Arctic sea ice variable, ends May below average

NSIDC, June 6, 2012


After reaching near-average levels in late April, sea ice extent declined rapidly during the early part of May. The rest of the month saw a slower rate of decline. Ice extent in the Bering Sea remained above average throughout the month.
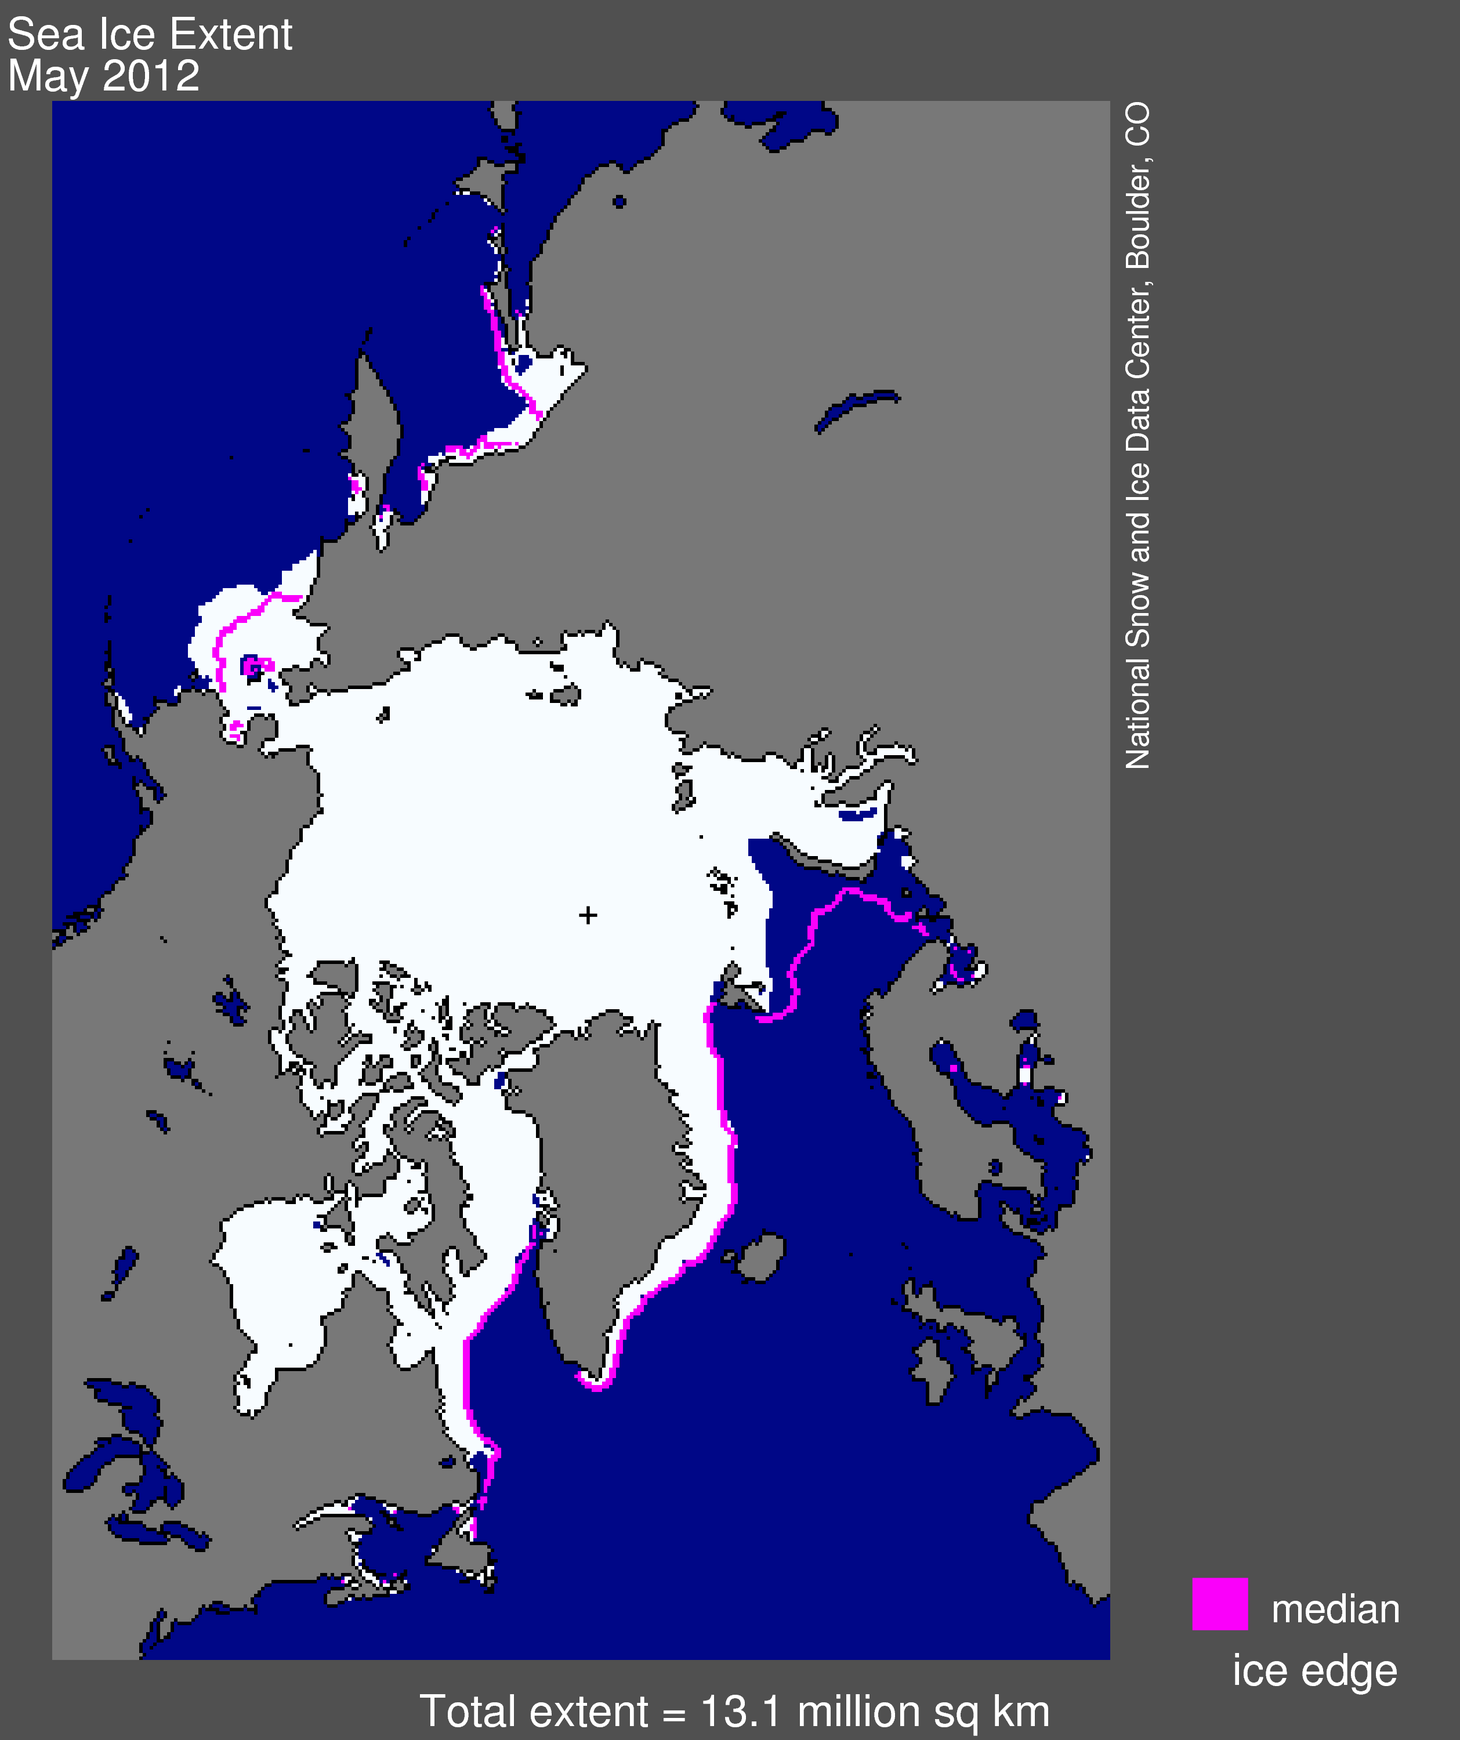
Figure 1. Arctic sea ice extent for May 2012 was 13.13 million square kilometers (5.07 million square miles). The magenta line shows the 1979 to 2000 median extent for that month. The black cross indicates the geographic North Pole. Sea Ice Indexdata. About the data. Credit: National Snow and Ice Data Center. High Resolution Image
Overview of conditions
Arctic sea ice extent for May 2012 averaged 13.13 million square kilometers (5.07 million square miles). This was 480,000 square kilometers (185,000 square miles) below the 1979 to 2000 average extent. This May’s extent was similar to the May 2008 – 2010 extent, but it was higher than May 2011. May ice extent was 550,000 square kilometers (212,000 square miles) above the record low for the month, which happened in the year 2004.
Ice cover remained extensive in the Bering Sea, continuing the pattern observed this past winter and spring. The anomalously heavy ice conditions were countered by unusually low extents in the Barents and Kara Seas, resulting in Arctic-wide ice conditions that remained below normal. By the end of the month, open water areas had begun to form along some parts of Arctic Ocean coast.
While the ice extent for May is not especially low this year, there is little correlation between the extent of the ice cover in May and that at the end of the melt season in September.
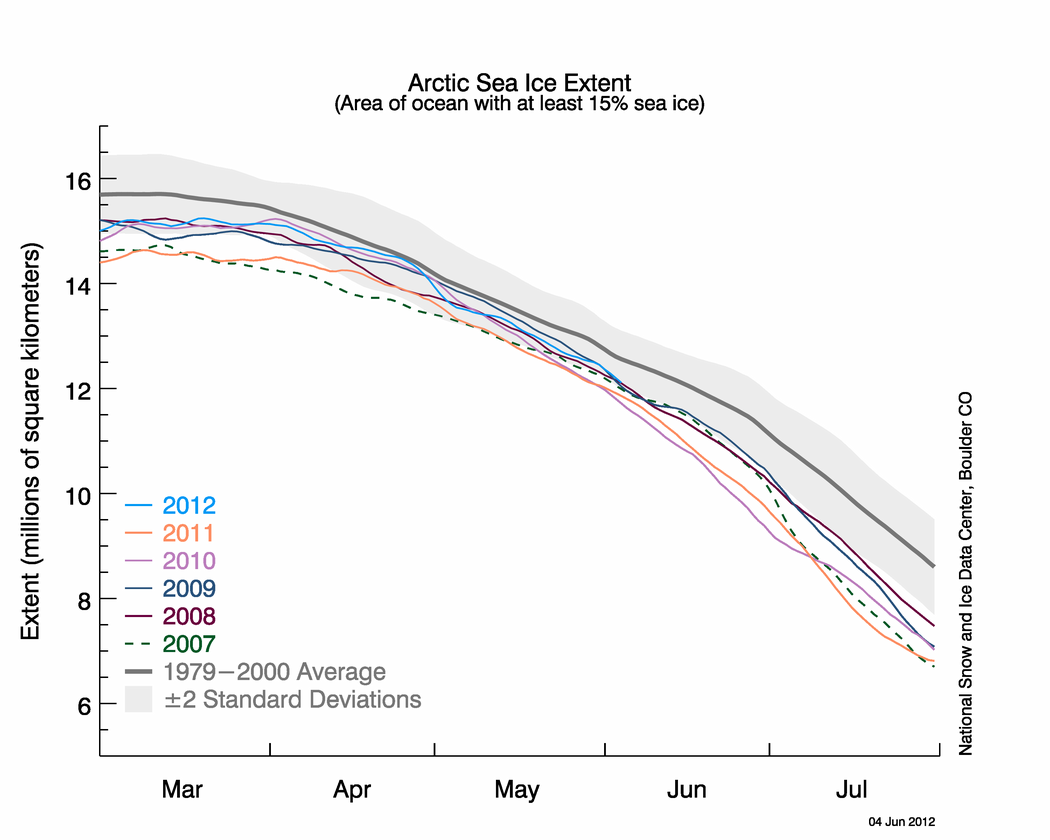
Figure 2. The graph above shows Arctic sea ice extent as of June 4, 2012, along with daily ice extent data for the previous four years. 2012 is shown in blue, 2011 in orange, 2010 in pink, 2009 in navy, 2008 in purple, and 2007 in green. The gray area around the average line shows the two standard deviation range of the data. Sea Ice Index data.  Credit: National Snow and Ice Data Center. High Resolution Image
Conditions in context
For May, the Arctic as a whole lost 1.62 million square kilometers (625,000 square miles) of ice, which was 180,000 square kilometers (69,500 square miles) more than the 1979 to 2000 average. The average daily rate of ice loss was 52,000 square kilometers (20,000 square miles) per day, which was slightly faster than the long-term average of 46,000 square kilometers (18,000 square miles) per day. 


However, the rate of ice loss for the month was composed of two distinct periods: a rapid loss of ice during the first part of the month, followed by near-average rates during the latter part of the month.
Air temperatures for May were higher than usual over the central Arctic Ocean and the Canadian Archipelago. Over the Bering Sea, Hudson Bay, and parts of the East Greenland and Norwegian seas, temperatures were slightly below average.
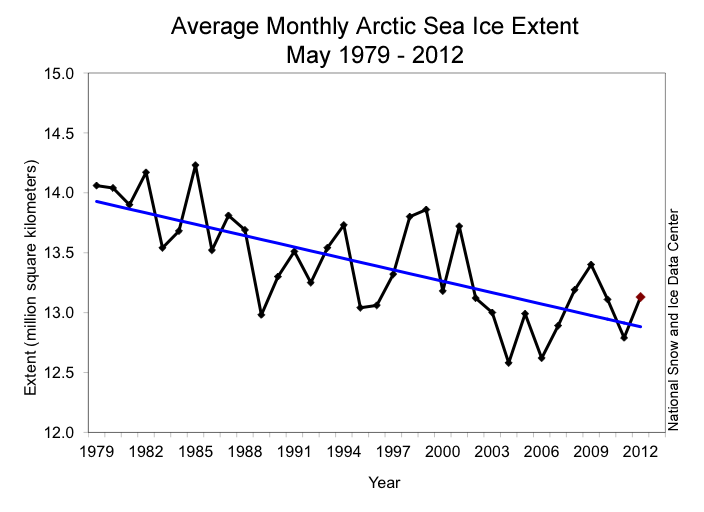
Figure 3. Monthly May ice extent for 1979 to 2012 shows a decline of 2.3% per decade. Credit: National Snow and Ice Data Center. High Resolution Image
May 2012 compared to past years
Arctic sea ice extent for May 2012 was below average for the month, compared to the satellite record from 1979 to 2000. However, the ice extent this May was not as low as it has been in some recent years. Including the year 2012, the linear rate of decline for May ice extent over the satellite record is 2.3% per decade.
May and April have the smallest trends of the year, indicating that spring is a period during the year when there is less variability and conditions tend to converge. It also demonstrates that spring extents are not necessarily indicative of conditions later in the summer.
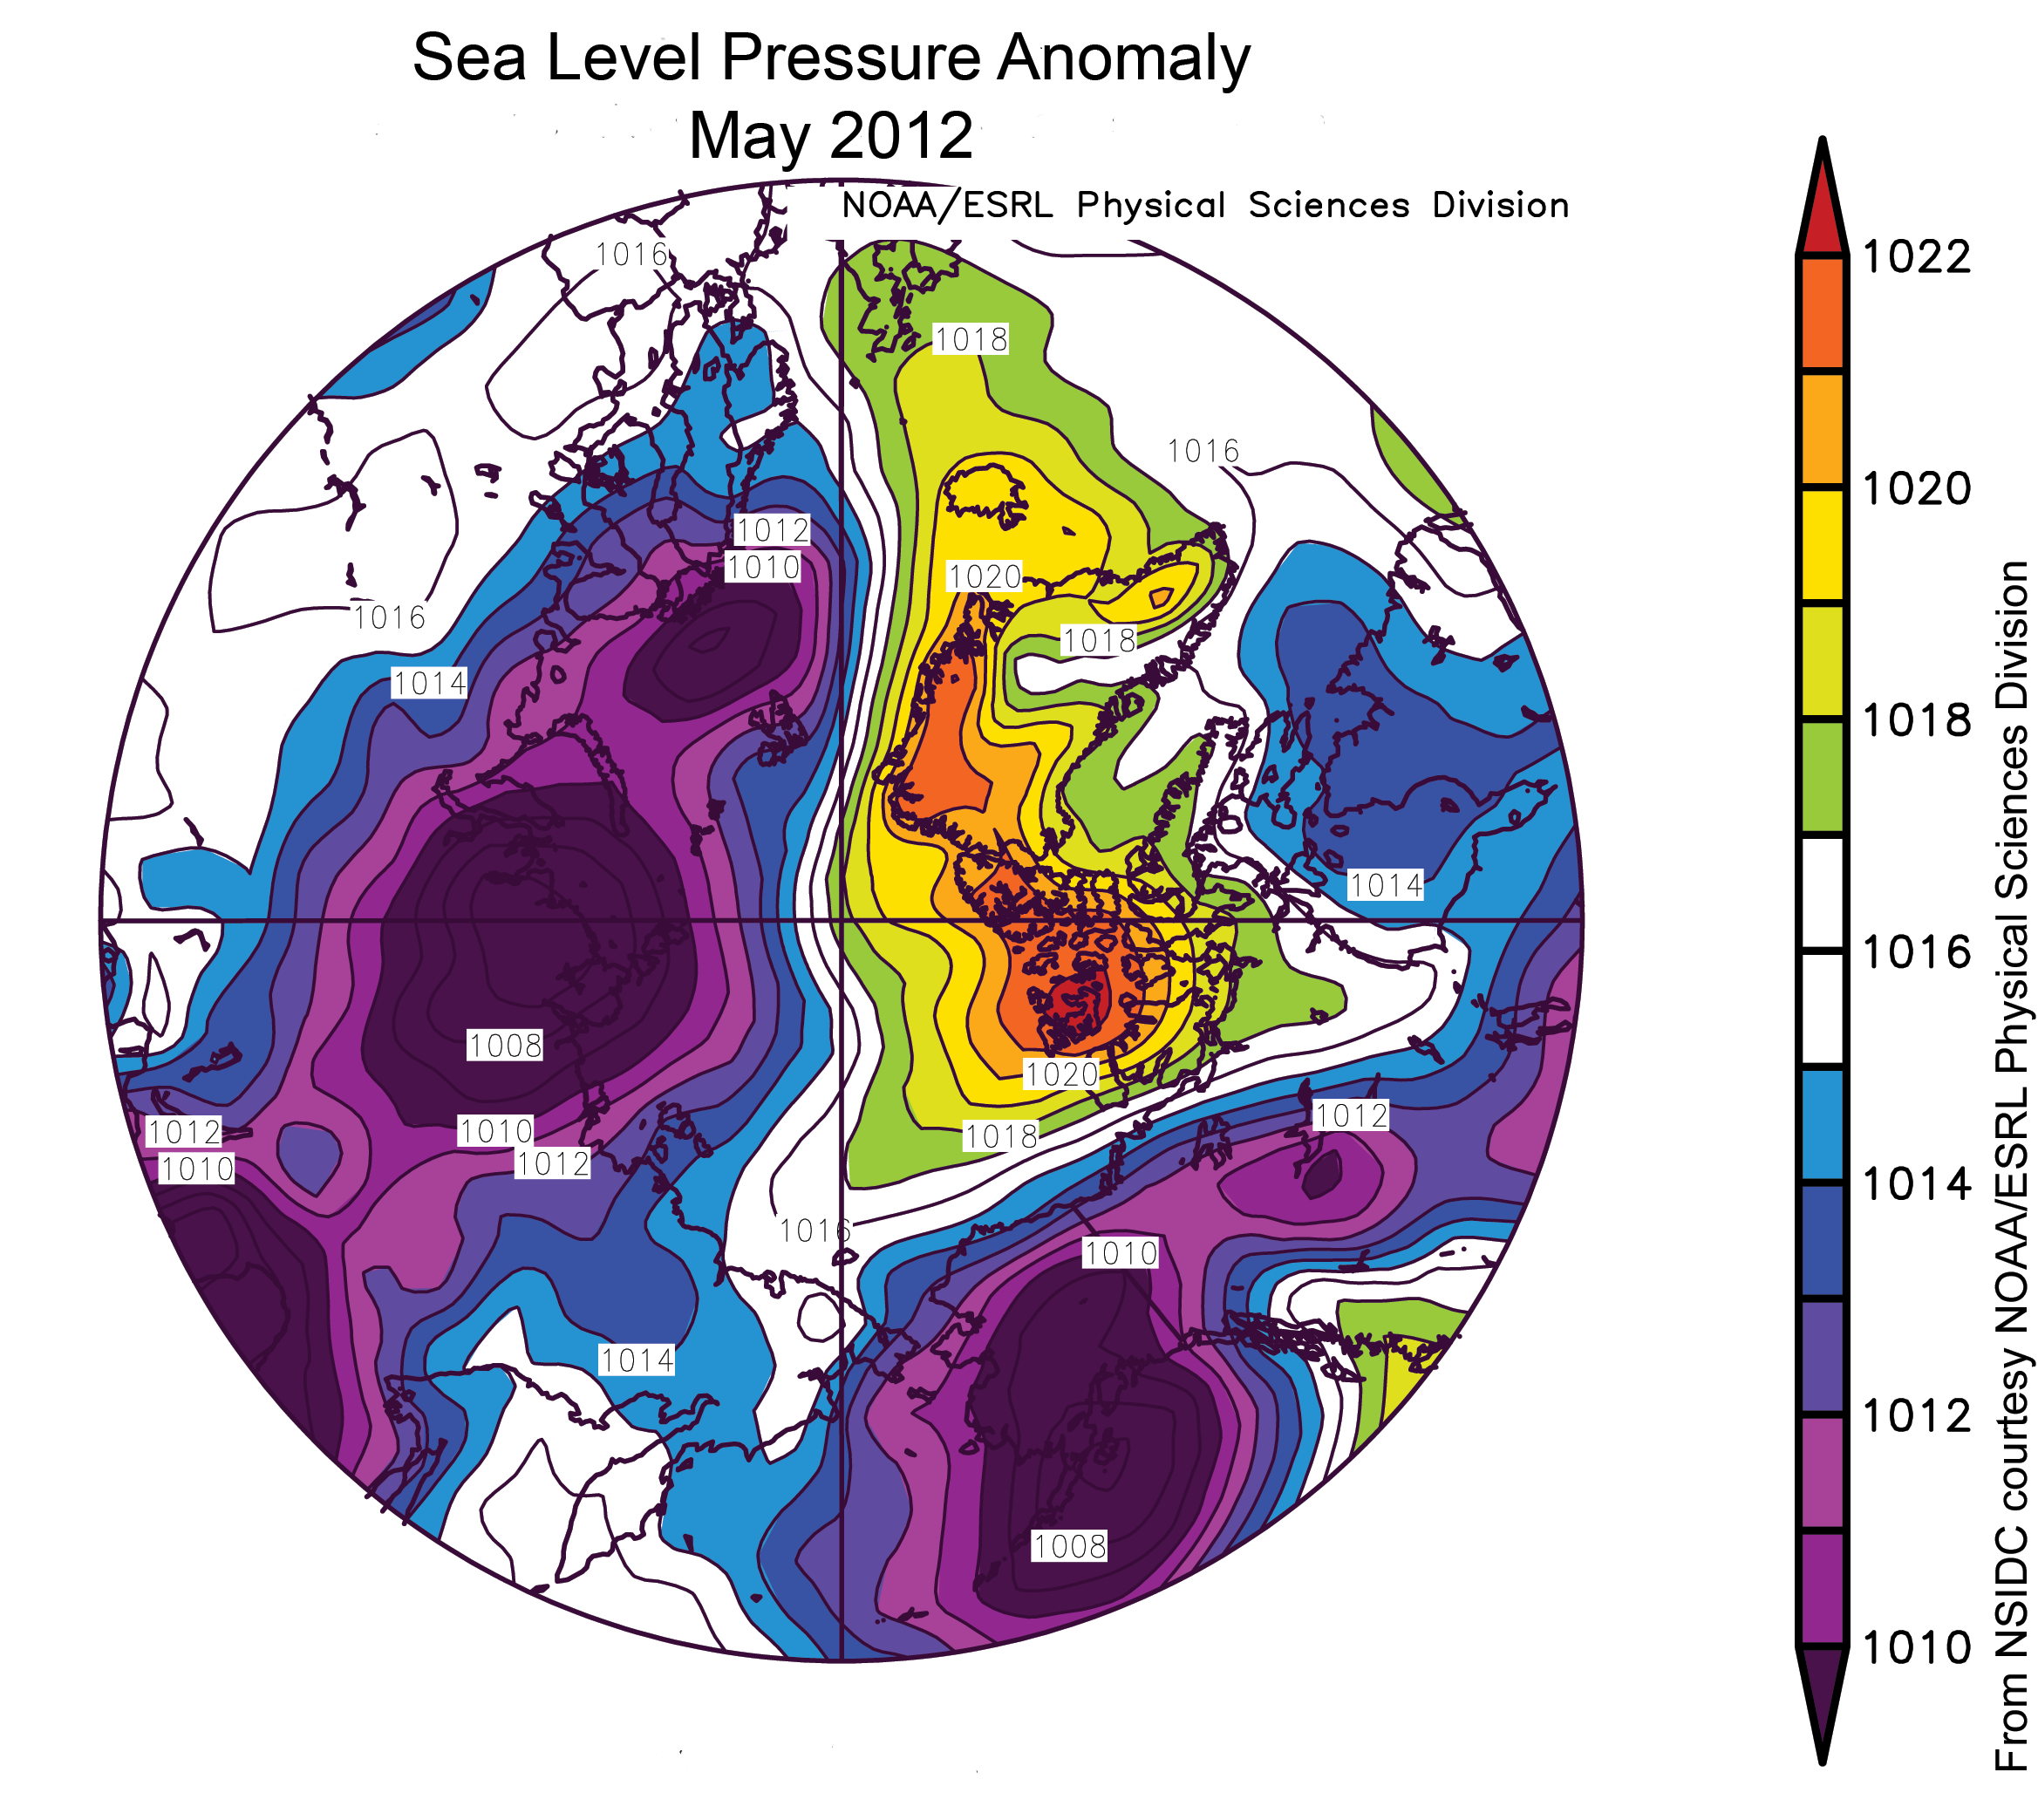
Figure 4. This map of sea level pressure anomalies for May 2012 shows that low pressure continued to dominate off of southern Alaska, resulting in northerly winds in the Bering Sea. Credit: NSIDC courtesy NOAA/ESRL PSD. High Resolution Image
A persistent pattern of extensive ice in the Bering Sea
Continuing the pattern of the past six months, ice cover remained unusually extensive in the Bering Sea. Normally by the end of May, the Bering is largely ice-free, but this year, 350,000 square kilometers (135,000 square miles) of ice remained. As was also the case for February through April, May 2012 had the highest average Bering Sea ice extent for the month in the satellite record.
The higher than normal extent and late spring break up of the ice cover in the Bering Sea are mainly due to unusually low air temperatures and persistent winds from the north, related to a region of low atmospheric pressure centered over Kodiak, Alaska. As these cold winds slowed ice melt, they also pushed the ice edge to the south. The heavy ice in the region may delay the start of Shell Alaska’s Arctic drilling this summer, which will be the first exploratory drilling in the Arctic Ocean in 20 years.
With the overall springtime warming of the Arctic, the ice has nevertheless started to break up and large areas of open water are now present in the northern part of the Bering Sea.
Figure 5. In this Moderate Resolution Imaging Spectroradiometer (MODIS) Arctic Mosaic image for the Beaufort Sea on May 29, 2012, open water is apparent between fast ice along the coast and the broken-up floes off-shore. Toward the bottom of the image, thin clouds can be seen over the open water. 
Credit: NASA/GSFC, Rapid Response. High Resolution Image
Open water areas within the Arctic Ocean
Although ice extent has remained high in the Bering Sea, open water areas have developed in parts of the Arctic Ocean, notably along the coasts of the Beaufort and Laptev seas. These openings are largely driven by winds pushing the ice away from fast ice, ice that is attached to the coast and that does not move with the winds. That the open water areas have not refrozen points to the relatively warm conditions over the Arctic, particularly in the Beaufort Sea.
The ice cover in the southern Beaufort Sea is also substantially broken up, with many individual ice floes instead of a consolidated pack. This makes the ice in this region vulnerable to enhanced melt during summer, as the sun rises higher in the sky and the dark open water areas between the floes readily absorb solar energy.

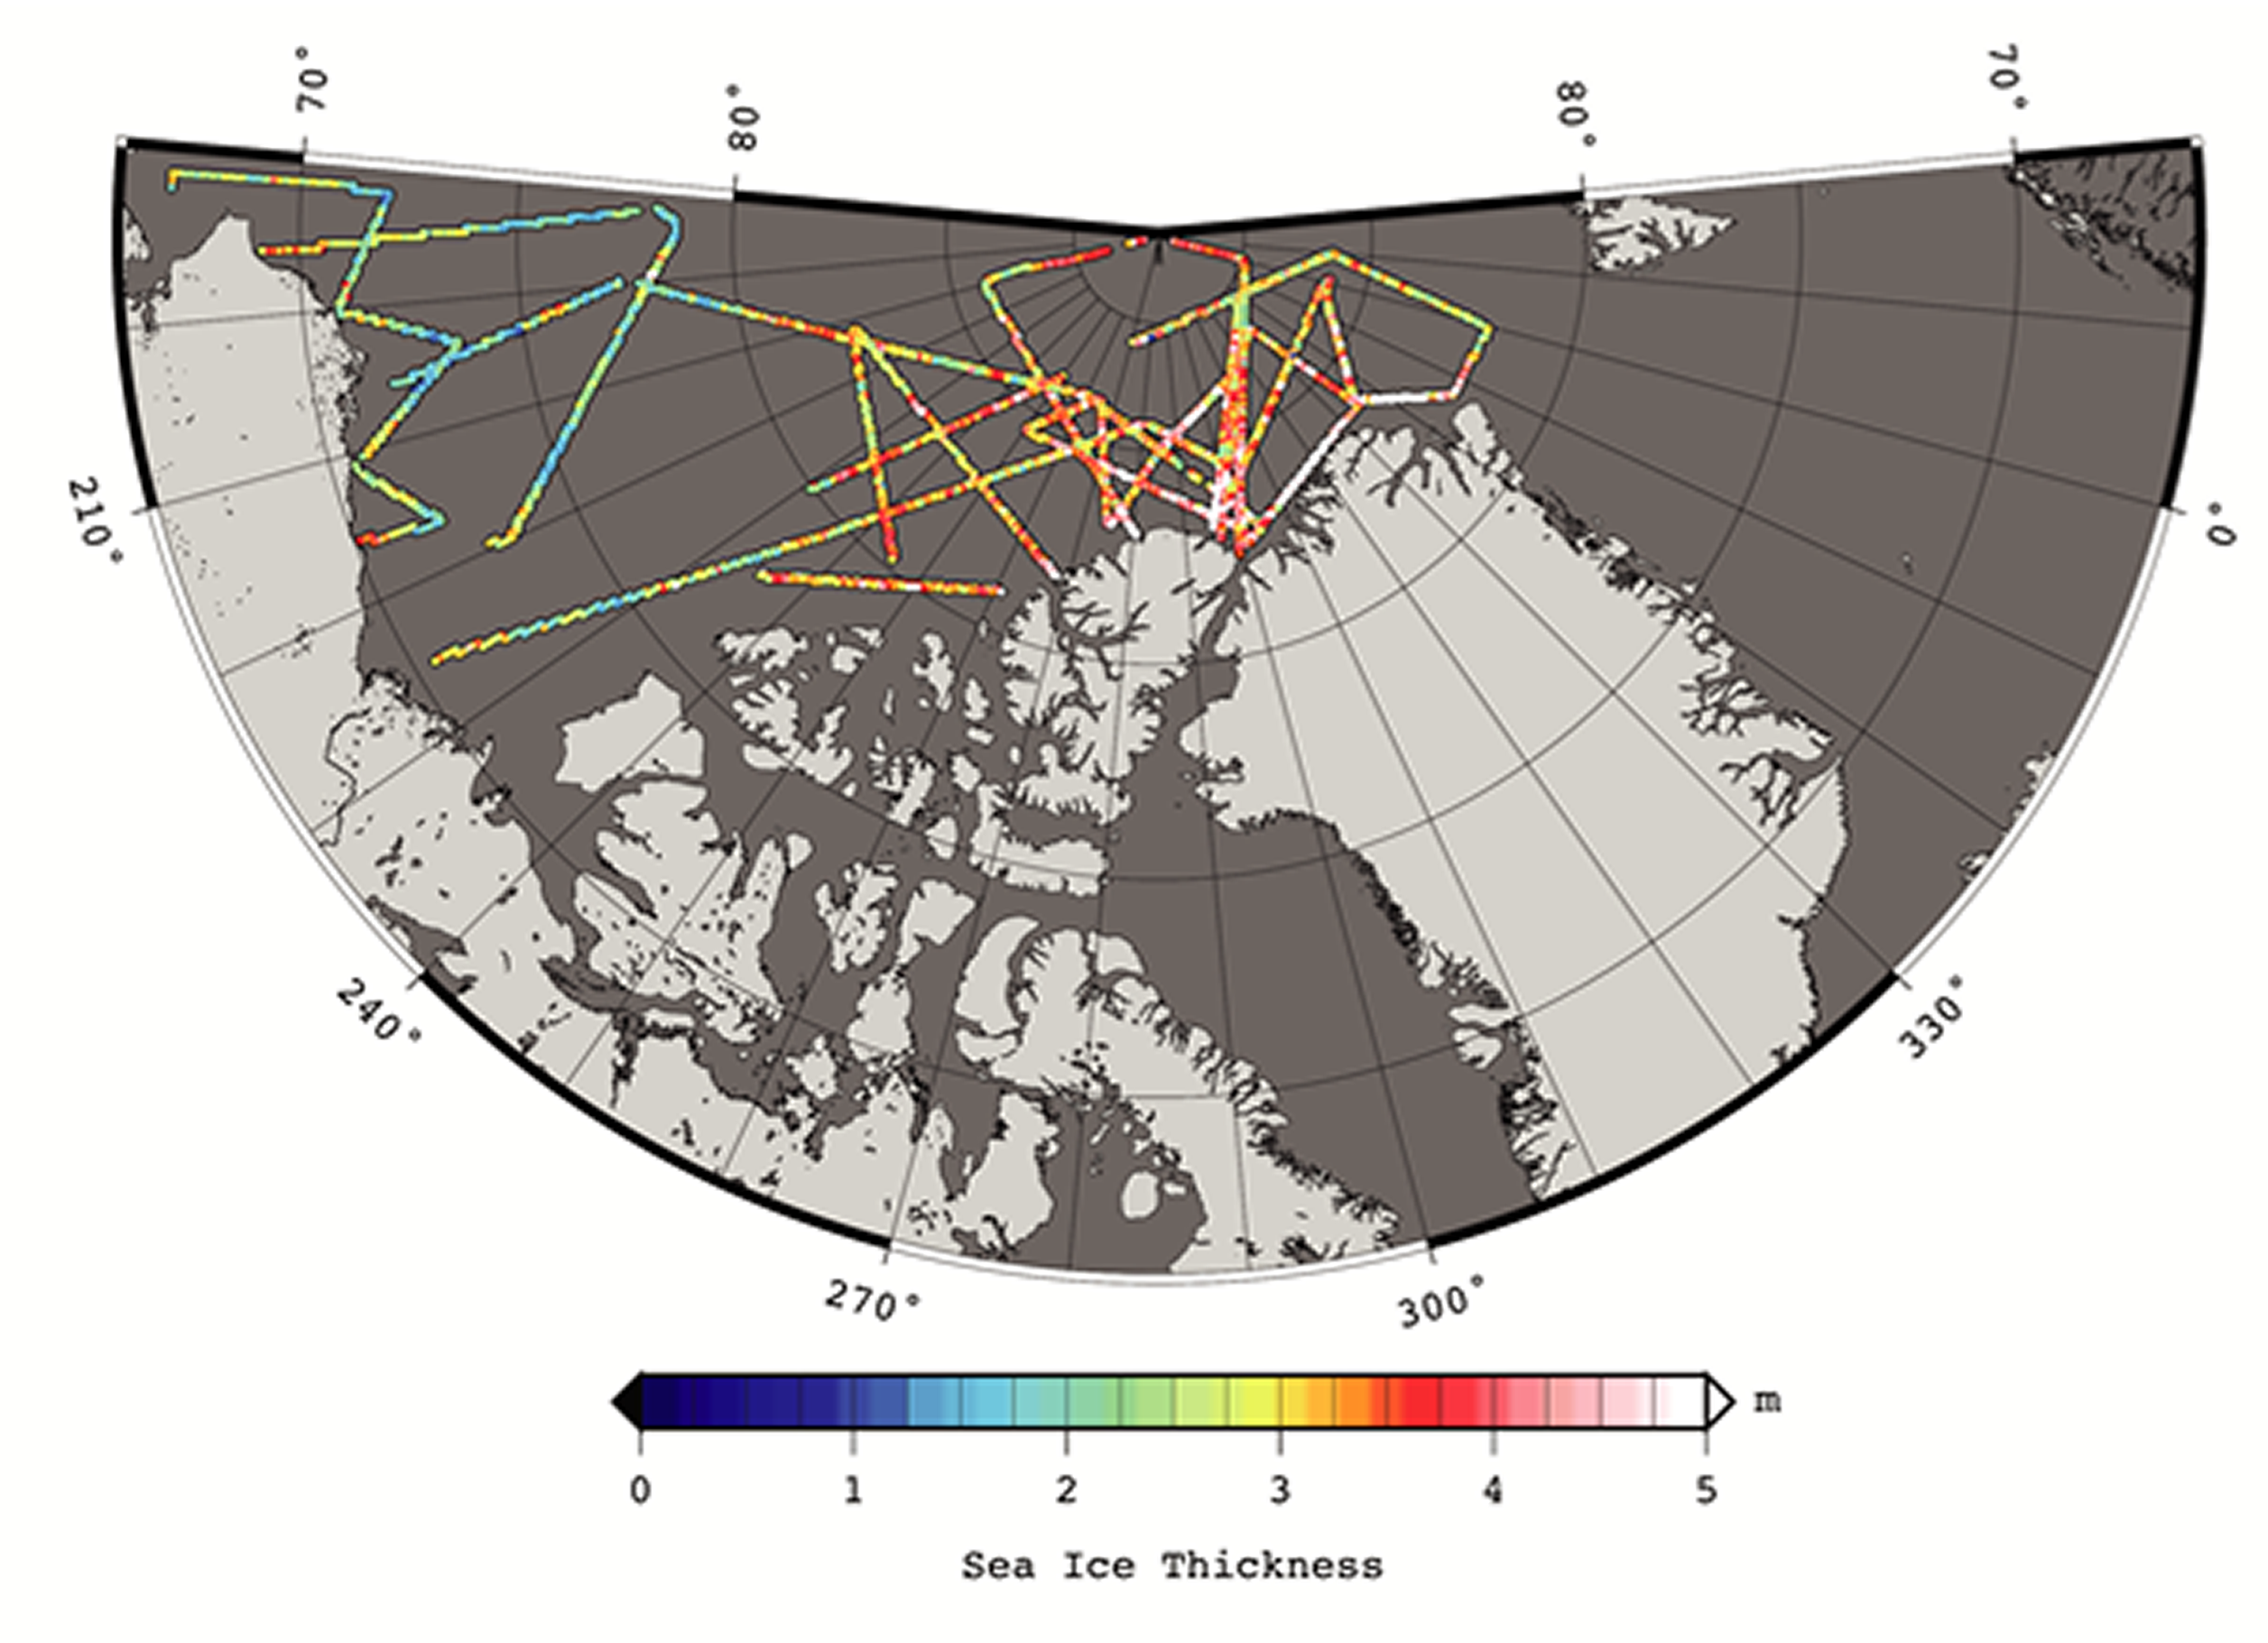
Figure 6. Snow depth on Arctic sea ice (top) and Arctic sea ice thickness (bottom), derived from the 2012 Operation IceBridge “quick-look” data products, spanning March 14 to April 2, 2012. Credit: S. Farrell and N. Kurtz, NASA Goddard Space Flight Center.
High Resolution Image: Figure 6a, Figure 6b
Quicker thickness data from NASA IceBridge
As we discussed last month, thickness information is extremely important for understanding the state of the ice cover. It is particularly important to seasonal forecasts (such as the SEARCH Sea Ice Outlook that will be released later this month), because thinner ice is more likely to melt completely during summer.
Sea ice age can be inferred from satellite data, and can help indicate the locations of relatively thin versus relatively thick ice. But direct measurements of ice thickness have been limited. Satellite missions such as ICESat and CryoSat, which measure ice thickness with altimeters, have been extremely valuable in better understanding overall changes in Arctic sea ice volume.
Currently, the NASA IceBridge mission supplies both sea ice thickness and snow depth measurements in spring, providing timely information on the state of the ice cover as the melt season begins. IceBridge data are collected from aircraft that fly over the ice cover carrying a suite of instruments, including altimeters that can directly measure ice thickness above the surface. These measurements are at high spatial resolution that can also be used to validate satellite data.
This year, the IceBridge Arctic sea ice campaign collected data in late March and early April, and provided data to NSIDC for distribution shortly thereafter. The data, collected from the North American side of the Arctic, indicate thick ice north of Greenland due to wind and ocean current patterns piling ice into thick ridges. In the Beaufort Sea, the offshore ice is fairly thin (1 to 2 meters, or 3 to 6 feet), indicative of first-year ice. Such thin ice will be prone to melt out completely this summer.
Ice along the Alaskan coast is thicker. Thicker ice tends to have a deeper overlying snow cover. The amount of snow is an important factor in the summer melt, because the snow reflects solar energy. The snow must melt away before surface melting of the ice can begin in earnest.

Sunday, June 3, 2012

Mark Boslough: Facts Are Not Negotiable


Facts are not negotiable

by Mark Boslough, Puckerclust blog, June 2, 2012
On April 25, 2012, I wrote a column for the Albuquerque Journal entitled “Climate Change Is Based Only on Fact.”  It was a direct refutation of factual errors in a column that had been published two days earlier called “Global Warming Is Just Propaganda.”  The previous author, Lewis Green, had made a number of incorrect statements (as well as errors of logic) in support of his claim that global warming is a conspiracy by left-wing activists.   I don’t understand why the Journal is willing to give space on their opinion page to absurd conspiracy theories that are demonstrably false (for an ironclad demonstration, see Peter Sinclair’s video showing that high-profile conservatives accept the reality of global warming).  I also listed several irrefutable facts:
♦ Fact: Global warming is real.
♦ Fact: Global warming was successfully predicted by physicists.
♦ Fact: Scientists accept the reality of global warming.
♦ Fact: Climate and weather are not the same thing.
♦ Fact: Global warming is not a left-wing conspiracy.
Unsurprisingly, my list of facts led to a flurry of letters.  Of the six letters published on May 15, four disputed the facts, or argued that they don’t matter.   I respond to those letters here.
Larry Harrah wrote “Full Disclosure Applies to Both Sides.”  I realize that letter titles are not written by the author, but by the opinion page editor, so I don’t blame Mr. Harrah for the faux balance implying the existence of “both sides” of some scientific debate.  The debate over the reality of global warming really is over.  Of 47,000 members of the American Physical Society, only 206 objected to the APS statement: “The evidence is incontrovertible: Global warming is occurring.” Of those 206, only a handful have any expertise on climate science, and of those, none have published contrary evidence. Scientific debate is not about petitions and objections, it requires publications and data. By this definition, there is no debate.
Mr. Harrah wrote that my letter “…withheld some pertinent facts not supporting its thesis…”  These included:
  • Three recent reports that there has been no change in mean global temperature during the first decade of the 21st century.
  • Two periods of unusual warming and icecap melting in the fifth and sixth centuries and in the 11th and 12th centuries.
However, even if both of these facts were true, they would not constitute evidence against the facts I provided.  I do not know what reports Mr. Harrah is referring to or if they were published in the peer-reviewed scientific literature or not (and I welcome a comment from him with citations to published scientific research).  But regardless of what the reports say, here is a plot of the actual temperature data:
NASA GISS
Whatever the recent reports claim about no global mean temperature change during the first decade of this century, the data do not support it.  Much has been made about the anomalously high temperature during the super El Nino year of 1998 (when tropical Pacific surface temperatures were exceptionally warm, slowing the rate at which the ocean absorbs heat from the atmosphere).   Remarkably, the 2011 temperature, which nearly broke this record, was in a La Nina year with low sea surface temperatures, when the oceans are soaking up much more heat.  But these relative fluctuations are a measure of interannual variability, not climate.  A better measure of climatological temperature is indicated by the red curve, which is a five-year running average.  This climatological temperature has continued to increase (even 5 years is too short to represent the true climate, which is customarily defined as a 30-year average, and requires at least 17 years, according to recent research).
The other claim that there were two periods of unusual warming and icecap melting many years ago would not contradict any of the facts I cited, even if true, so I do not understand the relevance in this context.  It is worth noting that similar such claims have been made that have turned out not to be true.  For example, business advocate Raymond Keating—in testimony to House Small Business Committee (June 4, 1998)—said, “During the past 3,000 years, there have been five extended periods when it was distinctly warmer than today.”  It turns out that his testimony was quoting a Wall Street Journal opinion piece that was based on politician/activist Arthur Robinson’s misrepresentation of actual published data (this is why I require that claims made in Puckerclust comments include citations to peer-reviewed scientific literature).
Mr. Harrah also exhibits a misunderstanding of the role of water vapor in human-caused global warming.  He is correct that water vapor is actually the dominant greenhouse gas, but he is incorrect that it is not of our making.  The increased amount of water vapor is because the air is warmer, which is directly attributable to human-generated pollution consisting of non-condensible heat-trapping gases like CO2.  The CO2 causes a little warming, which evaporates more water, which causes a lot more warming in a vicious cycle of amplification.
I absolutely agree with Mr. Harrah’s final remark: “Politicizing science can lead to meaningless or even bad choices where we squander our resources!”   I have always argued that facts trump politics.  That goes for both conservatives and liberals.
Joseph Yardumian writes, in “Climate Change Predates Your Car,” that our planet has undergone a number of climate cycles over the last 50,000 years.  Again, this is not evidence against human-caused global warming.  Humans cause forest fires with careless use of matches and vehicles with faulty catalytic converters and spark arrestors.  There is published evidence for forest fires in North America before cars were invented and before humans even occupied the continent.  It would be equally absurd to use that as evidence that we don’t have to be careful not to start them now.
Burke E. Nelson says, “Don’t Panic: We’ve Been Here Before.”  He asserts without evidence that civilizations advanced and people prospered during times of warming, but not so during times of cooling (this would seem to contradict the fact that the Enlightenment, the founding of our nation, and the beginning of the industrial revolution all took place during the height of the Little Ice Age).
Dr. Nelson (who says he has a “Ph.D. in science”) reminds us that what is now New Mexico was covered by an inland sea.  What he fails to mention is that this was 100 million years ago, long before the Laramide orogeny (mountain-building event) that created the Rockies, and when North America occupied a different part of the globe (a bit closer to the tropics and much further east).  I suspect that Dr. Nelson would not want our pollution to return the Earth to the conditions of the Cretaceous, which were more amenable to habitation by dinosaurs and ferns than to people, livestock, and edible fruits and vegetables.  Fortunately, the earth hasn’t been continuously warming at the current rate since then, or it would be much hotter than the sun!
Dr. Nelson rightly points out the “warm Coke effect.”  As a little bit of CO2 pollution warms up the oceans, as it is now doing, the water exsolves (releases) more CO2 into the air, causing another dangerous cycle of reinforcement: another reason that a little bit of human-caused warming ends up doing a lot more damage than naively expected.
Dr. Nelson also sites Fred Singer and William Happer, both of whom are associated with political pressure organizations like the Heartland Institute and the George C. Marshall Institute, and have become better known for their activism than their science.   Fred Singer and the Heartland Institute (which distributed the book cited by Dr. Nelson) are also known for publishing fabricated climate data.  More recently, the Heartland Institute has been under fire for erecting billboards making nasty personal attacks against the scientific community.
Likewise, Prof. Happer has pushed hard to politicize the science (as indicated by the quotes cited by Nelson, in which he resorts to name-calling and comparing the mainstream scientific community to a “a cult”).  Prof. Happer has apparently abandoned publishing his disagreements in the scientific literature in favor of conservative online media like The American Thinker.
Finally, virtually any logical thinker understands why it is ludicrous to argue that CO2 cannot be harmful because it comprises less than one half of one percent our atmosphere.  Unless we argue that this concentration of other substances can be safely ignored, this idea is flat out silly.  Should we ignore this amount of:
  • fecal coliform bacteria in our drinking water?
  • drugs in our bloodstream?
  • asbestos fibers in the air we breathe?
  • members of the American Physical Society who dispute the incontrovertible evidence?
I suspect Dr. Nelson would say no.
William E. Keller, in “So-Called Facts Bear Closer Inspection,” challenges the facts that I listed.   Surprisingly, Dr. Keller appeals to the post-modern idea that there is no real objective reality.  In his attempt to refute my statement that climatological temperature continues to increase, he says, “it depends on whose thermometer you are using.”  But reality is not dependent on the means of measurement.  Either it is getting warmer, or it’s not.  In a bizarre crossing-over of conservative suspicion of mainstream science with liberal muddled thinking, Dr. Keller seems to adopt Deepak Chopra’s idea that “there is no objective reality ‘out there’ that is independent of the observer.”
Furthermore, Dr. Keller claims that we only know the temperature over land, and that “what is happening over the other 70 percent [of the Earth's surface] is not clear.”  What is remarkable is that someone who is so opinionated about a subject would be unaware of the massive amount of data, both direct measurements and remote sensing, on sea surface temperatures (which by the way, are also increasing).
Dr. Keller also claims that NASA satellites show that temperatures in the lower troposphere have remained quite constant for the last 25 years, but fails to cite any peer-reviewed literature.  On the contrary, a survey of publications in scientific journals reveals that there has been an increase (Skeptical Science has a nice summary).
Dr. Keller grasps at straws when he criticizes my mention of predictions in the 1950s because I don’t give temperature units.  It is customary when writing for an American audience in a U.S. newspaper to use degrees F (C is used outside the US).  If you don’t believe me, turn to the weather page and see if they give temperature units!  For the record, a good overview of this prediction is given by Gilbert Plass (1959) “Carbon Dioxide and Climate,” Scientific American, July, p. 41-47.  One can listen to an interview with the author here.
Dr. Keller speculates that I “might not have looked hard enough” to attract contrarians to my session at my annual climate session.  But I specifically invited them in a letter to the Heartland Institute.  Notably, my contact at Heartland suggested that I would need to pay for contrarians to attend (which is apparently how the sponsors of the Santa Fe conference were able to attract some of them).
Finally, Dr. Keller confuses stocks and flows, a common mistake among those who deny the facts.  He says that only 5.6% of the CO2 flux into the atmosphere comes from humans.  But if not all of this 5.6% (flow) is re-captured and sequestered by nature, the concentration (stock) will continue to increase, exactly as observed.  And according to the laws of physics, so will the temperature.

Fukushima in Peril (and us, too)


Fukushima in Peril


Its official! A building can be leaning and have bulging walls supporting a massive tank of liquid on the top floor, and still be secure from any earthquake! This means the world is safe!
The Wall Street Journal just reported that TEPCO doesn’t have a plan to deal with the collapse of Spent Fuel Pool 4 at the Fukushima nuclear reactor in Japan. Yet a host of scientists, nuclear experts and researchers, say we facing a situation right now that is so serious that it literally threatened our very existence, for the entire Northern Hemisphere is at risk of becoming largely uninhabitable if the building collapses.
According to U.S. Army General Albert Stubblebine of the Natural Solutions Foundation, the situation is extremely serious and poses a significant danger to our entire civilization. Since TEPCO and the Japanese government have refused the entombment option (as the Russians did with Chernobyl) the world is at the mercy of nature. A mistake here would cause the deaths of tens of millions of people across the globe. Read report here.
 When the highly radioactive Spent Fuel Rods are exposed to air, there will be massive explosions releasing many times the amount or radiation released thus far. Bizarrely, they are stored three stories above ground in open concrete storage pools. Whether through evaporation of the water in the pools, or due to the inevitable further collapse of the structure, there is a severe risk. United States public health authorities agree that tens of thousands of North Americans have already died from the Fukushima calamity. When the final cataclysm occurs, sooner rather than later, the whole Northern Hemisphere is at risk of becoming largely uninhabitable.
The Japanese ambassador Murata writes to UN Secretary General: ‘It is no exaggeration to say that the fate of Japan and the whole world depends on No. 4 reactor’. Before the Committee, Ambassador Murata strongly stated that if the crippled building of reactor unit 4 (with 1,535 fuel rods in the spent fuel pool 100 feet (30 meters) above the ground) collapses, not only will it cause a shutdown of all six reactors but will also affect the common spent fuel pool containing 6,375 fuel rods, located some 50 meters from reactor 4. In both cases the radioactive rods are not protected by a containment vessel; dangerously, they are open to the air. This would certainly cause a global catastrophe like we have never before experienced. He stressed that the responsibility of Japan to the rest of the world is immeasurable. Such a catastrophe would affect us all for centuries. Ambassador Murata informed us that the total numbers of the spent fuel rods at the Fukushima Daiichi site excluding the rods in the pressure vessel is 11,421.”
And this is what Mr. Robert Alvarez, US reactor pools expert, had to say: “In recent times, more information about the spent fuel situation at the Fukushima-Dai-Ichi site has become known. It is my understanding that of the 1,532 spent fuel assemblies in reactor No. 304 assemblies are fresh and unirradiated. This then leaves 1,231 irradiated spent fuel rods in pool No. 4, which contain roughly 37 million curies (~1.4E+18 Becquerel) of long-lived radioactivity. The No. 4 pool is about 100 feet above ground, is structurally damaged and is exposed to the open elements. If an earthquake or other event were to cause this pool to drain this could result in a catastrophic radiological fire involving nearly 10 times the amount of Cs-137 released by the Chernobyl accident.
The infrastructure to safely remove this material was destroyed as it was at the other three reactors. Spent reactor fuel cannot be simply lifted into the air by a crane as if it were routine cargo. In order to prevent severe radiation exposures, fires and possible explosions, it must be transferred at all times in water and heavily shielded structures into dry casks. As this has never been done before, the removal of the spent fuel from the pools at the damaged Fukushima-Dai-Ichi reactors will require a major and time-consuming re-construction effort and will be charting in unknown waters. Despite the enormous destruction cased at the Da–Ichi site, dry casks holding a smaller amount of spent fuel appear to be unscathed.
You may also read Dr. Michio Kaku who stated “People don’t realize that the Fukushima reactor is on a knife’s edge; it’s near the tipping point. A small earthquake, another pipe break, another explosion could tip it over and we could have a disaster much worse, many times worse than Chernobyl. It’s like a sleeping dragon.” Full text here.
He also said on the 28th that, “Radiation levels are 1,000 milliseverts/hour. This means that workers will come down with radiation sickness with only 15 minutes of exposure. Some workers will die after 6 hours of exposure. The meaning of all this is: if radiation levels continue to rise, and workers are forced to evacuate, the accident will be in free fall.” Dr. Kaku called for an immediate entombment of the plant after the disaster began.  Now it might be too late for that and will take too long to do it.
Also an independent report from Fairewinds.

Friday, June 1, 2012

Heidi Cullen, NYT: Clouded Forecast

Clouded Forecast


by Dr. Heidi Cullen, The New York Times, May 31, 2012


OUR ability to forecast the weather is in big trouble.
Last month, the National Research Council concluded that the nation’s system of Earth-observing satellites is in a state of “precipitous decline” and warned of a “slowing or even reversal of the steady gains in weather forecast accuracy over many years.”
This worrisome development puts all of us in harm’s way and should particularly trouble us as the annual six-month hurricane season begins today.
Gathering timely and accurate weather data is, of course, vital to saving lives. The deadliest hurricane ever to strike the United States hit Galveston, Texas, on September 8, 1900, killing as many as 8,000 people. Scientists had lacked the tools to predict the storm’s severity.
We have made tremendous progress in the accuracy of our hurricane forecasting (and overall weather forecasting) since then, much of it a result of government-owned satellites that were first launched in the 1960s and now provide about 90% of the data used by the National Weather Service in its forecasting models. Satellite and radar data and the powerful computers that crunch this information are the foundation of the weather information and images we get. Thanks to these instruments, for instance, the 5-day hurricane track forecast we get today is more accurate than the 3-day forecast from just 10 years ago.
These satellites also monitor volcanic eruptions, rising sea levels, melting ice sheets, the depletion of stratospheric ozone and ocean surface temperatures. Emergency beacons from aviators and mariners in distress can also be pinpointed by these satellites. Scientists who study the atmosphere and the ocean need continuous weather data to track large-scale climate variations (like El Niño) and long-term environmental trends like global warming.
Weather observations even bear on national security. Accurate wind and temperature forecasts are critical in deciding whether to launch an aircraft that will require midflight refueling.
But those capabilities, and our overall ability to monitor the planet, are slipping. The causes identified by the research council, an arm of the National Academy of Sciences, are many: technological failures, cost increases, changes in Congressional and administration priorities and — above all — the failure to devote adequate resources. For example, the annual budget for NASA’s Earth Science Division has fallen to below $1.5 billion from about $2 billion a decade ago, far below what scientists agree is needed.
The new report found that the number of actual and planned satellite missions could decline from 23 this year to only 6 in 2020, reducing the number of Earth-observing instruments in space from 90 now to about 20 in 2020.
To make matters worse, in the last three years, two Earth-observing satellites costing more than $700 million failed to reach orbit and crashed into the ocean.
In its May report, the council warned of a “coming crisis” in which “our ability to observe and understand the Earth system will decline.” The National Oceanic and Atmospheric Administration, which includes the National Weather Service, expects a data gap of at least 12 months, beginning in 2017, between the time one satellite crucial for accurate weather forecasts and warnings stops functioning and its replacement is up and running. Without such data, the Weather Service would have been at a serious disadvantage sizing up the dangerous snowmaggedon blizzard of 2010 that paralyzed the East Coast. Forecasters would have underestimated the snowfall by 10 inches, according to the Weather Service.
We live on a small planet with increasingly big problems. Extreme weather, climate change, population pressure and the depletion of our natural resources are all expected to worsen in our lifetimes. This is not the time to take our eyes off the planet we call home.
[ENVISAT stopped working this year, meaning I have no eye in the sky on the Greenland ice sheet changes, anymore.]
Heidi Cullen is a scientist at Climate Central, which communicates scientific findings to the public.

Jason Box: Greenland Ice Sheet Getting Darker


Greenland Ice Sheet Getting Darker


The following provides detail to a story run by NOAA entitled Greenland Ice Sheet Getting Darker…


by Jason E. Box, MeltFactor


Freshly fallen snow under clear skies reflects 84% (albedo= 0.84) of the sunlight falling on it (Konzelmann & Ohmura, 1995). This reflectivity progressively reduces during the sunlit (warm) season as a consequence of ice grain growth, resulting in a self-amplifying albedo decrease, a positive feedback. Another amplifier; the complete melting of the winter snow accumulation on glaciers, sea ice, and the low elevations of ice sheets exposes darker underlying solid ice. The albedo of low-impurity snow-free glacier ice is in the range of 30% to 60% (Cuffey & Paterson, 2010). Where wind-blown-in and microbiological impurities accumulate near the glacier ice surface (Bøggild et al., 2010), the ice sheet albedo may be extremely low (20%) (Cuffey & Paterson). Thus, summer albedo variability exceeds 50% over parts of the ice sheet where a snow layer ablates by mid-summer, exposing an impurity-rich ice surface (Wientjes & Oerlemans, 2010), resulting in absorbed sunlight being the largest source of energy for melting during summer and explaining most of the inter-annual variability in melt totals (van den Broeke et al., 2008, 2011).


The photo below shows how dark the ice sheet surface can become in the lowest ~1,000 m elevation in the “ablation area” after the winter snow melts away and leaves behind an impurity-rich surface. This dark area is where the albedo feedback with melting is strongest.


August 12, 2005, 8 p.m. local time, I took this photo from a helicopter flying over the ice sheet surface at ~1,500 feet altitude. This is how much darker the Greenland ablation area is than a fresh snow surface that blankets it in wintertime. Along much of the southwestern ice sheet at the lowest 1,000 m in elevation, impurities concentrate near the surface and produce this dark surface. Not all of the ice sheet is this dark, only the lower ~1/3 of the elevation profile of the ice sheet is. However, as melting increases on the ice sheet, so does the area exposed that is this dark.

Satellite observations from the NASA Moderate-Resolution Imaging Spectroradiometer (MODIS)  indicate a significant Greenland ice sheet albedo decline (-5.6±0.7%) in the June-August period over the 12 melt seasons spanning 2000-2011. According to linear regression, the ablation area albedo declined from 71.5% in 2000 to 63.2% in 2011 (time correlation = -0.805, 1-p=0.999). The change (-8.3%) is more than two times the absolute albedo RMS error (3.1%). Over the accumulation area, the highly linear (time correlation = -0.927, 1-p>0.999) decline from 81.7% to 76.6% over the same period also exceeds the absolute albedo RMS error.


Greenland ice sheet average reflectivity or albedo (multiply by 100 to get % units) for 12 summer (June-August) periods.

Because of extreme 2010 melt and little snow accumulation during the melt season (Tedesco at al., 2011) and afterward, the ice sheet albedo remained more than two standard deviations below the 2000-2011 average in October. Like year 2010, 2011 albedos are more than 1 S.D. below the 2000-2011 mean.


Year 2011 albedo (multiply by 100 to get % units) over the Greenland ice sheet is the lowest observed in the 12 years since MODIS observations began day 65 year 2000. 11-day running median Greenland ice sheet albedo from Moderate Resolution Imaging Spectroradiometer (MODIS) MOD10A1 data. The dashed line represents the 2000-2011 daily average.

Darkening of the ice sheet in the 12 summers between 2000 and 2011 permitted the ice sheet to absorb an extra 172 quintillion joules of energy, nearly 2 times the annual energy consumption of the United States (about 94 quintillion joules in 2009).


This decline is not only over the lowest elevations, but occurs high on the ice sheet where melting is limited.


The greatest changes in reflectivity (or albedo, multiply by 100 to get % units) are found where a relatively dark surface of impurity rich "glacier ice" emerges once the snow cover melts. It's natural for snow cover to melt away at the lowest elevations of a glacier or ice sheet. However, the period of time over which the ice sheet surface is bare has increased significantly since year 2000 when these observations become available.

A significant albedo decline of 4.6±0.6% in the 2000-2011 period from a year 2000 value of 83.0% is observed for the accumulation area, where warming surface temperatures are enhancing snow grain metamorphosis.


References at link:  http://www.meltfactor.org/blog/?p=453

Riverdale residents block eviction and construction of road by Aqua America to remove 3 million gallons of water daily from the Susquehanna River (that is in severe drought) to be used for fracking


BREAKING: Riverdale Residents Blockade Aqua America Construction Road

From the campaign to Save the Riverdale Mobile Home Park.  Come join the encampment!
*PLEASE FORWARD WIDELY TO PRESS CONTACTS*
For Immediate Release: June 1, 2012
Contact: saveriverdale@gmail.com; Alex Lotorto: 570-269-9589, alotorto@gmail.com; Deb Eck (Resident): 570-772-3335; Kelly Finan: 570-877-2417, Kelly@kellyfinan.com
Riverdale Residents Blockade Aqua America Construction Road
Piatt Township, PA – Riverdale residents and supporters have blockaded access to a mobile home community that is facing imminent displacement at the hands of Aqua America, a major water withdrawal company that supplies natural gas drillers in the Marcellus Shale region.
Approximately thirty residents and allies are currently blockading entrance roads to the community.  Supporters have also placed tired and wooden boards at the entrance, alongside banners reading  “Aqua America Kills Community” and “We Will Fight For Our Homes.”  A Range Resources security vehicle arrived onsite Friday morning, and security officials videotaped residents, blockaders, and license plate numbers before leaving.
The blockade was launched to halt Aqua America’s plans to begin construction of a withdrawal facility for water from the Susquehanna River to be used in hydraulic fracturing (“fracking”) operations.  Aqua America recently purchased the entire Riverdale mobile home unit to be used as a withdrawal site, and has issued lease termination notices to 32 Riverdale families.  Construction is set to begin on June 1, and it is unclear what additional steps Aqua America will take to displace those families who are choosing to remain.
The dismantling of the community has left many residents in tears over the loss of their home. Deb Eck, one of the remaining residents, stated, “This park isn’t just a bunch of trailers with a bunch of people who don’t know each other. We’re all friends. We’re all neighbors. It’s a community. It’s one big family.”
The Susquehanna River Basin Commission (SRBC) permitted construction of the Riverdale water withdrawal facility in March.  The SRBC, comprised of representatives from the White House and the governors of New York, New Jersey, and Pennsylvania, granted 48 withdrawal permits at its March meeting, despite the objections of concerned residents.  Aqua America has been permitted to withdraw up to three million gallons of river water daily.  Susan Obleski, spokeswoman for the SRBC, stated that the Susquehanna has been facing severe drought this spring “at levels that haven’t been seen since 1910 and 1946.”
Fracking has been linked to cases of water contamination in towns across the country including Dimock, PA, and Pavilion, WY.  The gas industry is exempted from the Clean Water and Safer Drinking Water Acts and as a result, many of the chemicals used in drilling are unknown.  Pennsylvania law restricts the ability of local governments to regulate fracking operations and gags doctors from sharing information about chemicals used in fracking with public health officials. Pennsylvania’s Department of Environmental Protecting is facing criticism for its refusal to list the Susquehanna River as “impaired” under the Clean Water Act.  According to John Arway of Pennsylvania’s Fish and Boat Commission, there has been a significant increase in fish with black lesions in the Susquehanna since last summer.
Friday’s blockade is one of a series of escalating actions in resistance to increased fracking operations in the Marcellus and Utica shale regions.  Pennsylvania activists disrupted the SRBC’s March hearing and have blockaded trucks carrying drillrigs in Lycoming County, and eleven Ohioans have been arrested for anti-fracking actions since last November.  Additional major anti-fracking events scheduled for this summer include a takeover of the Ohio statehouse on June 17, the Earth First Rendezvous from July 1-7, a Youngstown-based action camp from July 13-17, and a July 28 convergence in Washington, D.C.
Residents and supporters are committed to stopping construction of the water withdrawal facility that threatens to raze their community.  They are demanding that Aqua America permit residents to remain in the homes, compensate those who have already left, and allow for the return of all residents who have already been displaced.  Residents have requested that more supporters converge in defense of the Riverdale mobile home park and to, in Deb Eck’s words, “help us keep the River in Riverdale.”
“We are here in solidarity with the residents of Riverdale, who are on the frontlines of the devastation that fracking is causing across Pennsylvania,” said blockader Lauren Zygmont.  “We are putting our bodies on the line to send a message to perpetrators of environmental injustice worldwide: as long as you continue to sacrifice communities like Riverdale for profit, you can expect resistance.”

Thursday, May 31, 2012

Greenland's Loss of Ice Mass During the Last 10 Years Is Unusually High Compared to Last 50 Years


Greenland's Loss of Ice Mass During the Last 10 Years Is Unusually High Compared to Last 50 Years


ScienceDaily (May 29, 2012) — Loss through melting and iceberg calving during the last 10 years is unusually high compared to the last 50 years

Greenand icebergs. (Credit: Copyright GFZ)
The Greenland ice sheet continues to lose mass and thus contributes at about 0.7 millimeters per year to the currently observed sea level change of about 3 mm per year. This trend increases each year by a further 0.07 millimeters per year. The pattern and temporal nature of loss is complex. The mass loss is largest in southwest and northwest Greenland; the respective contributions of melting, iceberg calving and fluctuations in snow accumulation differing considerably.


This result has been published by an international research group led by the GFZ German Research Centre for Geosciences in the latest issue of Earth and Planetary Science Letters, 1 June 2012. The result was made possible by a new comparison of three different types of satellite observations: measurements of the change in gravity by changes in ice mass with the satellite pair GRACE, height variation with the laser altimeter on the NASA satellite ICESat and determination of the difference between the accumulation of regional atmospheric models and the glacier discharge, as measured by satellite radar data.
For the first time and for each region, the researchers could determine with unprecedented precision which percentage melting, iceberg calving and fluctuations in rainfall have on the current mass loss. "Such an increase in mass loss in the northwest after 2005 is partly due to heavy snowfall in the years before," says GFZ scientist Ingo Sasgen, head of the study. "The previous mass gain was reduced in subsequent years. Similarly in eastern Greenland: In the years 2008 and 2009 there was even a mass increase." As the researchers were able to show, this was not due to decreased glacier velocities, but because of two winters with very heavy snowfall. Meanwhile, the loss of ice mass continues here. For all studied regions the melting and calving periods between 2002 and 2011 are extraordinarily high compared to those of the last five decades.
The work was created in the framework of the Helmholtz Climate Initiative REKLIM of the Helmholtz Association and the EU project ice2sea. Due to the study, the researchers can get a little closer to understanding the current developments of the Greenland ice sheet. Ingo Sasgen: "We now know very well how calving glaciers and melting contribute to the current mass balance, and when regional trends are largely caused by rainfall variations. And we also know where our measurements must be improved." One such area is north-western Greenland, where the comparison of data indicates an abrupt increase in the calving rate, which was detected by the radar data inadequately. The REKLIM/ice2sea scientists want to find out what causes this increase and if it has a continuous or episodic character. A necessary prerequisite is a sufficiently long time series of measurements that is to be created by the continued precise gravity measurements in the context of the new satellite mission GRACE-FO (Gravity Recovery And Climate Experiment – Follow On).

Jeff Masters: Unprecedented May heat in Greenland; update on 2011 Greenland ice melt

Unprecedented May heat in Greenland; update on 2011 Greenland ice melt


by Dr. Jeff Masters, wunderblog, May 31, 2012


The record books for Greenland's climate were re-written on Tuesday, May 29th, when the mercury hit 24.8 °C (76.6 °F) at Narsarsuaq, Greenland, on the southern coast. According to weather records researcher Maximiliano Herrera, this is the hottest temperature on record in Greenland for May and is just 0.7 °C (1.3 °F) below the hottest temperature ever measured in Greenland. The previous May record was 22.4 °C (72.3 °F) at Kangerlussuaq (called Sondre Stormfjord in Danish) on May 31, 1991. The 25.2 °C at Narsarsuaq on June 22, 1957, is the only June temperature measured in Greenland warmer than yesterday's 24.8 °C reading. Wunderground's extremes page shows that the all-time warmest temperature record for Greenland is 25.5 °C (77.9 °F) set on July 26, 1990. The exceptional warmth this week was caused by the combination of an intense ridge of high pressure and a local foehn wind, said the Danish Meteorological Institute. 


The unusual May heat has extended to Scotland, which had its hottest May temperature on record on May 25 at Achnagart: 29.3 °C (85 °F). 


Greenland's Narsarsuaq has seen a string of 3 consecutive days over 70 °F this week:  the 3rd, 7th, and 12th warmest days there since record keeping began in 1941. The ridge of high pressure responsible is expected to stay in place several more days, bringing additional 70 °F days over southern Greenland. The warm May temperatures could be setting the stage for a big Greenland melt season this summer -- the International Research Institute for Climate and Society (IRI) is predicting a 50-60% that the southern two-thirds of Greenland will experience above-average temperatures this summer. They forecast just a 10-15% chance of below-average temperatures. 


Figure 1. Difference between the number of melt days in 2011 and the average number of melt days during the period 1979-2010. Large sections of the island experienced twenty more days with melting conditions than average. Image credit: Arctic Report Card -- John Wahr.

Why Greenland is important
If the massive icecap on Greenland were to melt, global sea level would rise 7 meters (23 ft). Temperatures in Greenland are predicted to rise 3 °C by 2100, to levels similar to those present during that warm period 120,000 years ago. During that period, roughly half of the Greenland ice sheet melted, increasing sea level by 2.2-3.4 meters (7.2-11.2 ft.) However, the 2007 IPCC report expects melting of the Greenland ice sheet to occur over about a 1,000-year period, delaying much of the expected sea level rise for many centuries. 


While Greenland's ice isn't going to be melting completely and catastrophically flooding low-lying areas of the earth in the next few decades (sea level is only rising about 3 mm per year or 1.2 inches per decade at present), the risk later this century needs to be taken seriously. Higher sea levels will cause increased erosion, salt water intrusion, and storm surge damage in coastal areas, in addition to a loss of barrier formations such as islands, sand bars, and reefs that would normally protect coastal zones from battering by waves and wind. Additionally, coastal zones are sites of incredible economic and agricultural activity, which would also be negatively affected by higher sea levels. 


Currently, melting ice from Greenland is thought to cause about 0.7 mm/year of global sea level rise, which is about 20-25% of the global total, according to an international research group led by the GFZ German Research Centre for Geosciences, in an article published the latest issue of Earth and Planetary Science Letters, 1 June 2012. In 2007, the IPCC estimated that Greenland ice melt was responsible for only 10-15% of the total global sea level rise. Ice loss in Greenland is accelerating, and if current ice loss trends continue for the next ten years, Greenland's contribution to sea level rise will double to 1.4 mm/yr by 2022. The increased ice loss in Greenland is being driven by a combination of warmer air temperatures, warmer ocean temperatures, and loss of Arctic sea ice. Ocean temperatures surrounding Southern Greenland have increased by 1-2 °C since 1990 (figure at right).

Figure 2. Monthly unsmoothed values of the total mass (in gigatons, Gt), of the Greenland ice sheet from the GRACE satellites. On the horizontal axis, each year begins on 1 January. Each small + symbol is a monthly value. Between 2003 and 2009, Greenland lost an average of 250 gigatons of ice per year. In 2011, the loss was 70% greater than that. Image credit: Arctic Report Card -- John Wahr.

Update on the 2011 Greenland melt season
According to the 2011 Arctic Report Card, it was another very warm year in Greenland in 2011, which led to substantial melting of the ice. Here are some of the highlights from the report:

(1) The area and duration of melting at the surface of the Greenland ice sheet in summer 2011 were the third highest since 1979.

(2) Increased surface melting and below average summer snowfall in recent years has made the icecap steadily darker. In 2011, the icecap had the lowest reflectivity (albedo) of any year since satellite measurements of reflectivity began in 2000.

(3) The area of glaciers that empty into the sea continued to decrease, though at less than half the rate of the previous 10 years.

(4) Total ice sheet mass loss in 2011 was 70% larger than the 2003-2009 average annual loss rate of -250 gigatons per year. According to satellite gravity data obtained since 2002, ice sheet mass loss is accelerating.

Resources:
Wunderground's Greenland page.
Wunderground's sea level rise page.
Danish Meteorological Institute's extremes page for Greenland.


http://www.wunderground.com/blog/JeffMasters/comment.html?entrynum=2110


