Blog Archive

Saturday, December 3, 2011

Discovery Channel still deciding on David Attenborough's episode, "On Thin Ice," from his famous BBC series, Frozen Planet, while climate denier, Nigel Lawson, spews the usual lies about the reality of climate change

Temporarily Frozen Planet, Permanently Frozen Objectivity

by dana1981, Skeptical Science, December 3, 2011

The BBC has produced a new series titled Frozen Planet, which is a documentary about the Arctic and Antarctic that includes an episode on climate change called On Thin Ice. Sadly, the BBC feels that sales in the climate denial-heavy United States will be more successful if it drops the climate change episode in sales of the series abroad. The Discovery Channel has not yet decided whether to carry On Thin Ice in its USA broadcast of the series.
Recently, the series' narrator, Sir David Attenborough wrote an article about his travels to the Arctic, and his concerns about the rapid global warming-enduced melting he observed there and its numerous adverse impacts.  The article was published by the British magazine The Radio Times.
Nigel Lawson, a British former conservative politician and journalist, took issue with Attenborough's article and responded with his own article also published by The Radio Times.  In his response, Lawson criticizes Attenborough for a supposed lack of objectivity, but it would appear that Lawson's definition of "objectivity" involves little more than regurgitating long-debunked climate myths.  In fact, were Lawson a Skeptical Science reader, he would have known better than to make these false and misleading arguments, because we have debunked several of them in the very recent past.

Arctic Sea Ice Death Spiral

Lawson begins his list of criticisms of Attenborough's article by repeating the same myth we debunked when made by Roger Pielke, Sr., less than a month ago - that Antarctic sea ice gain offsets Arctic sea ice loss.
"Had [Attenborough] wished to be objective, he would have pointed out that, while satellite observations do indeed confirm that the extent of arctic sea ice has been declining over the past 30 years, the same satellite observations show that, overall, Antarctic sea ice has been expanding over the same period."
Had Lawson wished to be objective, he would have pointed out that the small, statistically insignificant increase in Antarctic sea ice extent is no match for the rapid decline in Arctic sea ice extent (Figure 1).
global sea ice extent
Figure 1. National Snow and Ice Data Center (NSIDC) Antarctic, Arctic, and global (sum of the two) sea ice extents with linear trends. The data are smoothed with a 12-month running average.
Had he wished to be objective, Lawson would also have noted that the decline in Arctic ice volumeis even more rapid and concerning than the decline in extent  (ice is three dimensional, after all). And an objective Lawson might have mentioned that he mass of the Antarctic ice sheet, especially the West Antarctic Ice Sheet (WAIS) is declining. Or that despite the slight increase in Antarctic sea ice extent, the Southern Ocean is warming - faster than the global trend, in fact.

Polar Bear Population Decline

Lawson proceeded to regurgitate the popular myth that polar bear populations are thriving:
"Had [Attenborough] wished to be objective, he would have pointed out that the polar bear population has not been falling, but rising."
Had Lawson wished to be objective, he would not have made this false assertion.  According to a 2009 report by the IUCN Polar Bear Specialist Group, of the 19 recognised subpopulations of polar bears, 8 are in decline, 1 is increasing, 3 are stable and 7 don’t have enough data to draw any conclusions. Figure 2 compares the data for 2005 and 2009.
 
Figure 2. Subpopulation status of polar bears for 2005 and 2009 (Source: Polar Bear Specialist Group).
The overall polar bear population is indeed declining, in large part due to the aforementioned rapid decline in Arctic sea ice.  The early retreat of summer sea ice means that bears have less time to hunt and therefore less time to build up fat reserves.  Additionally, the fragmentation and reduction in sea ice forces the bears to swim longer distances, using up some of their fat reserves. It also forces the bears to spend more time on land, with increased interactions with humans potentially leading to higher mortality.

Clouds Will Not Save Us from Global Warming

Lawson's next false assertion involves the cloud feedback:
"Had [Attenborough] wished to be objective, he would have mentioned that recent research findings show that the increased evaporation from the Arctic ocean, as a result of warming, will cause there to be more cloud cover, thus counteracting the adverse effect he is so concerned about."
Had Lawson wished to be objective, he would not have such a false, unsubstantiated statement. It's difficult to tell whether Lawson's assertion here is based on the myth that globally, clouds will dampen global warming as a significantly negative feedback which was debunked by most recently and thoroughly by Dessler (2010):
"the short-term cloud feedback had a magnitude of 0.54 +/- 0.74 watts per square meter per kelvin, meaning that it is likely positive."
or whether Lawson is referring to research specific to the cloud feedback in the Arctic region.  If the latter, he would still be incorrect. While it's true that clouds have a cooling effect via reflecting incoming solar radiation (increased albedo), had Lawson wished to be objective, he would have noted that clouds also have a competing warming effect by increasing the greenhouse effect.
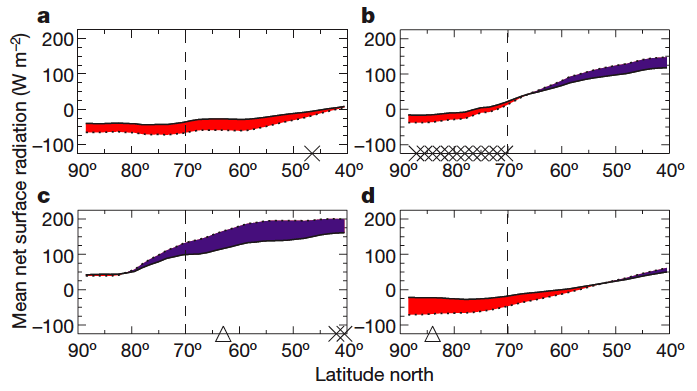
Screen and Simmonds (2010) found that in the Arctic, the warming effect of the cloud feedback is greater in the spring, fall, and winter (Figure 3).  After all, during most of the year the Arctic doesn't get very much sunlight, so the influence of increased cloud reflectivity is not very large, except in summer.
arctic clouds
Figure 3. Impacts of cloud-cover changes on the net surface radiation.  Mean net surface radiation (short-wave plus long-wave) over the 1989–2008 period under cloudy-sky (solid lines) and clear-sky (dotted lines) conditions. Means are averaged around circles of latitude for winter (a), spring (b), summer (c) and autumn (d). The fluxes are defined as positive in the downward direction. Red shading indicates that the presence of cloud has a net warming effect at the surface. Blue shading indicates that the presence of cloud has a net cooling effect at the surface. The dashed lines show the approximate edge of the Arctic basin. Symbols show latitudes where increases (triangles) and decreases (crosses) in total cloud cover significant at the 99% uncertainty level are found.
As Figure 3 shows, the net Arctic cloud feedback is very slightly negative (cooling) in the summer (Figure 3c), and positve in the winter, spring, and autumn (Figures 3a, b, d).  The question is whether the overall feedback is neutral or positive.  Screen and Simmonds conclude:
"In short, we find no evidence of changes in cloud cover contributing to recent near-surface Arctic warming."
However, cloud cover changes in the Arctic certainly aren't having the cooling effect that Lawson asserts.

Global Warming Continues

Lawson then repeats one of the favorite climate denialist myths - that global warming has magically stopped:
"Had [Attenborough] wished to be objective, he would have noted that, while there was indeed a modest increase in mean global temperature (of about half a degree Centigrade) during the last quarter of the 20th century, so far this century both the UK Met Office and the World Meteorological Office confirm that there has been no further global warming at all."
This myth is very easily debunked in Figure 4, and repeating it is no sign of objectivity.
skeptics v realists v3
Figure 4. BEST land-only surface temperature data (green) with linear trends applied to the timeframes 1973-1980, 1980-1988, 1988-1995, 1995-2001, 1998-2005, 2002-2010 (blue), and 1973-2010 (red). 
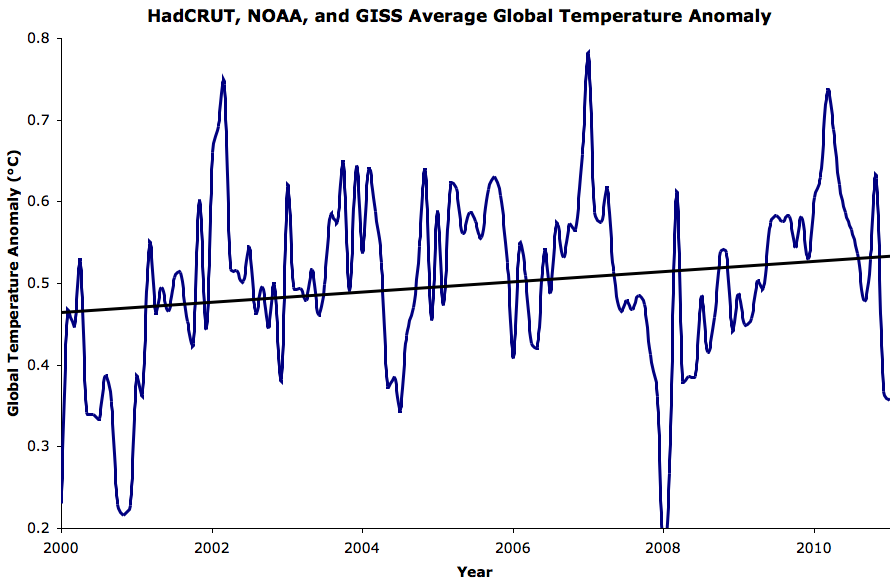
Even if we go along with Lawson's cherrypicked starting date, his claim of "no further global warming at all" since 2000 is simply wrong (Figure 5).
warming since 2000
Figure 5. Average global surface temperature anomaly from HadCRUT, NOAA, and GISS since 2000 (blue), and linear trend (black).
The linear trend in this data since 2000 is 0.063 °C warming per decade.  Lawson has conveniently selected the HadCRUT data, which has a known cool bias.  The average of the NOAA and GISS data since 2000 produces a 0.085 °C warming trend per decade.  Even if we cherrypick the timeframe (since 2000) and dataset (HadCRUT), there is still a warming trend (0.02 °C per decade).  Of course none of these trends is statistically significant, because 10 years is too short of a timeframe to establish statistical significance.  Lawson is focusing on short-term noise rather than long-term signal, as Figure 4 illustrates.  Nevertheless, his assertion of no warming is wrong.

Lawson Reveals His Motives

Lawson closes his article by spreading myths about climate solutions:
"if there is a resumption of warming, the only rational course is to adapt to it, rather than to try (happily a lost cause) to persuade the world to impoverish itself by moving from relatively cheap carbon-based energy to much more expensive non-carbon energy."
In fact, Lawson has crammed two myths into this closing sentence. Firstly, economic studies consistently show that climate mitigation is cheaper than adaption. Secondly, while the market price of fossil fuel energy is generally cheaper than renewable energy, when we account for all the costs, many renewable sources are cheaper in reality due to the massive external costs not reflected in the market price of coal (Figure 6).
coal costs
Figure 6. Average US coal electricity price vs. MMN11 and Epstein (2011) best estimate coal external costs.
If Lawson were truly objective, he would not ignore these inconvenient but very real costs.

Misinformation is not Objectivity

In every case, Lawson's "objectivity" is nothing more than repeating myths and spreading misinformation. Perhaps Lawson would feel more at home in the United States, where climate denial prohibits scientifically-sound presentations like Attenborough's from being shared with the public, and where presenting Lawson's brand of misinformation is encouraged as being "fair and balanced."

Friday, December 2, 2011

Grim Report Card - Greenland Ice Sheet 2011 Update by NOAA: J. E. Box, J. Cappelen, C. Chen, D. Decker, X. Fettweis, D. Hall, E. Hanna, B. V. Jørgensen, N. T. Knudsen, W. H. Lipscomb, S. H. Mernild, T. Mote, N. Steiner, M. Tedesco, R. S. W. van de Wal & J. Wahr

Greenland Ice Sheet

J. E. Box1, J. Cappelen2, C. Chen1, D. Decker1, X. Fettweis3, D. Hall5, E. Hanna4,
B. V. Jørgensen2, N. T. Knudsen6, W. H. Lipscomb7, S. H. Mernild7, T. Mote8,
N. Steiner9, M. Tedesco9, R. S. W. van de Wal10, and J. Wahr11


1Byrd Polar Research Center, The Ohio State University, Columbus, OH, U.S.A.
2Danish Meteorological Institute, Copenhagen, Denmark
3Department of Geography, University of Liège, Liège, Belgium
4Department of Geography, University of Sheffield, U.K.
5NASA Goddard Space Flight Center, Greenbelt, MD, U.S.A.
6Department of Geology, Aarhus University, 8000 Aarhus, Denmark
7Los Alamos National Laboratory, Los Alamos, NM 87545, U.S.A.
8Department of Geography, University of Georgia, Athens, GA, U.S.A.
9City College of New York, New York, NY, U.S.A.
10Institute for Marine and Atmospheric Research Utrecht, Utrecht University,
Utrecht, The Netherlands
11Cooperative Institute for Research in Environmental Sciences,
University of Colorado Boulder, Boulder, CO, U.S.A.


November 29, 2011

Highlights

  • A persistent and strong negative North Atlantic Oscillation (NAO) index was responsible for southerly air flow along the west of Greenland, which caused anomalously warm weather in winter 2010-11 and summer 2011.
  • The area and duration of melting at the surface of the ice sheet in summer 2011 were the third highest since 1979.
  • The lowest surface albedo observed in 12 years of satellite observations (2000-2011) was a consequence of enhanced surface melting and below normal summer snowfall.
  • The area of marine-terminating glaciers continued to decrease, though at less than half the rate of the previous 10 years.
  • In situ measurements revealed near record-setting mass losses concentrated at higher elevations on the western slope of the ice sheet, and at an isolated glacier in southeastern Greenland.
  • Total ice sheet mass loss in 2011 was 70% larger than the 2003-09 average annual loss rate of -250 Gt y-1. According to satellite gravity data obtained since 2002, ice sheet mass loss is accelerating.

Meteorological station records (J. E. Box and J. Cappelen)

Surface air temperatures from Greenland long-term meteorological stations are characterized by a record-setting warm winter, unusually cold spring (March-May) and a record-setting warm late summer in the northwest of the island (Table HTC3). At Upernavik, summer 2011 was the warmest since the Beginning of Records (BR) in 1873. Similarly, at Thule AFB, July 2011 and the summer season (June-August) was the warmest on record since BR 1961. At Kangerlussuaq, April 2011 was the coldest on record since BR 1949. April 2011 cold anomalies exceeding 2 standard deviations below the 1971-2000 normal were observed at west Greenland stations Nuuk and Paamiut. Surface air temperatures at the ice sheet Summit station since BR 1987 were below normal during March-June.

Table HTC3. Greenland station air temperature anomalies in the 12-month period before September 2011 relative to 1981-2010. (Enlarged table in PDF)


Table 3 -- Greeland station air temperature anomalies


* Winter includes December of previous year. Values exceeding 2 standard deviations are color coded.

Upper air temperatures (J. E. Box)

Seasonally-averaged 2011 upper air temperature data available from twice-daily radiosonde observations (Durre et al. 2006) in the vicinity of Greenland (see Table HTC4 for site locations) indicate anomalous tropospheric warmth in summer and winter and mid-tropospheric cold anomalies in spring (Fig. HTC8). The typical asymmetry between the tropospheric and stratospheric anomalies is most evident in winter, when record-setting cold anomalies were observed above 100 hPa. Mid-stratospheric atmospheric mass is low and prone to extremes. The overall warm pattern near the surface at 1000 hPa is consistent with a warming trend prevailing since reliable records began in 1964 and which has been most pronounced since the mid-1980s (Box & Cohen 2006).

Fig. 8 -- Upper air temperature anomalies
Fig. HTC8. Upper air temperature anomalies relative to the 1981-2010 baseline in winter, spring and summer of 2011.

Atmospheric circulation and air temperature (X. Fettweis)

Summer 2011 was characterized by a constant negative North Atlantic Oscillation (NAO) index for the entire season; a -2.4 standard deviation anomaly in comparison with the 1971-2000 JJA NAO average. Consequently, the 2011 atmospheric flow was characterised by warm air advection from the south along the western coast (Fig. HTC9). The circulation anomaly (Fig. HTC9) caused significant summer temperature departures from normal (Fig. HTC10) and drier conditions than normal at the south of the ice sheet (Fig. HTC11). The effects of the circulation anomaly also extended into the Canadian Arctic Islands, where there were strong positive temperature anomalies and negative glacier mass balances (see the essay on Glaciers and Ice Caps).


Fig. 9 -- Geopotential height anomalies for summer
Fig. HTC9. Geopotential height anomalies for summer (JJA) 2011 (referenced to the 1981-2010 mean) at 500 hPa from the NCEP/NCAR Reanalysis. The blue and magenta lines plot the summer (JJA) mean geopotential height at 500 hPa in 2011 and during 1971-2000, respectively. The arrows show the direction of the main air flows.


Fig. 10 -- Summer (JJA) mean 2011 near-surface temperature anomalies simulated by MAR
Fig. HTC10. Summer (JJA) mean 2011 near-surface temperature (Kelvin) anomalies simulated by MAR (Fettweis et al. 2011) relative to the period 1981-2010. Areas where temperature anomalies were at least twice the 1981-2010 standard deviation are hatched.


Fig. 11 -- Summer (JJA) snowfall anomaly simulated by MAR
Fig. HTC11. Summer (JJA) snowfall anomaly (mm water equivalence) simulated by MAR (Fettweis et al. 2011) relative to the period 1981-2010. Areas where temperature anomalies were at least twice the 1981-2010 standard deviation are hatched.

Greenland coastal precipitation (S. H. Mernild, J. Cappelen, B. V. Jørgensen, W. H. Lipscomb, J. E. Box, and E. Hanna)

Changes in Greenland precipitation over time are of interest for understanding fluctuations in glacier and ice sheet mass balance and freshwater runoff to the ocean. Long-term changes are difficult to quantify, however, because Greenland meteorological stations are sparsely and non-uniformly distributed. Here, observed precipitation data (uncorrected for gauge catch efficiency and type) from eight DMI (Danish Meteorological Institute; DMI 2000, 2010) synoptic stations are examined, from Kangerlussuaq (continental west) to Qaqortoq in southwest Greenland and from Tasiilaq (maritime east) to Station Nord in the northeast (Table HTC4).

Table HTC4. Greenland station precipitation (uncorrected) anomalies by season for 2011 relative to 1981-2010. (Enlarged table in PDF)


Table 4 -- Greenland station precipitation anomalies


§Anomalies are in mm water equivalent (w.e.), with respect to the 1981-2010 base period. No precipitation data exist from July and August 2011 for Illoqqortoormiut. In cases when the monthly precipitation is zero for two or more months, the next highest year is mentioned in the table. Bold values indicate values that meet or exceed 2 standard deviations from the base period. Red characters indicate record-setting values. The winter values include December from the previous year.
In 2011, a clear pattern of below-average annual (September through August) precipitation is evident at the west, southwest and southeast stations, with the largest anomalies in the south (above one standard deviation). In east and northeast Greenland, precipitation was above average. Overall, precipitation in 2011 was less extreme than in 2010, when annual precipitation reached a record low since BR 1961 in Qaqortoq and a record high since 1961 at Station Nord. No annual precipitation records were set in 2011. Remarkable extremes occurred; Kangerlussuaq had the wettest February and driest April on record (RB 1976) and Danmarkshavn had the wettest spring (March to May) and the driest June on record (RB 1949).

Surface melting (T. Mote and M. Tedesco)

Greenland ice sheet surface and near-surface melt above ~1% liquid water content is estimated from thresholds in 19 GHz horizontally-polarized brightness temperatures measured by the spaceborne SSM/I instrument (Mote & Anderson 2005). These data indicated that the melt area for the period June through August 2011 ranked the third greatest since 1979, after 2007 and 2010 in that order. The years were ranked based on the seasonal melt departure (SMD), the sum of the daily melt extent anomalies over each summer (Mote 2007). These annual ranking are sensitive to the length of the selected season. Expanding the season from 15 May to 15 September drops 2011 to the 6th most extensive melt year, following 2010, 2007, 2002, 1998, and 2005, in that order. More extensive than average melt was evident from early June through early August 2011 (Fig. HTC12). An average of 31% of the ice sheet area was melting during June through August 2011, compared to 33% in 2007 and 32% in 2010. No other year since 1979 had an average greater than 30%; the 1981-2010 average was 24.1%.
Fig. 12 -- Fractional area of the Greenland Ice Sheet identified as melting
Fig. HTC12. Fractional area (%) of the Greenland Ice Sheet identified as melting from SSM/I. The standard deviation of the 1981-2010 period is shaded.
Melting in Greenland in 2011 was still above the 1979-2010 average and was exceptionally high over the western mid-elevations. The number of melting days in 2011, estimated from spaceborne microwave observations using the approach in (Tedesco 2007), did not break the previous record set in 2010. Year 2011 is 6th for melting, after 2010, 2007, 1998, 2002, 2005. The updated trend for the area of the ice sheet subject to melting is 16,800 km2 per year, close to the trend estimated with 2010 of 17,202 km2 per year. The 2011 departure of the number of melting days from the 1979-2010 baseline is illustrated in Fig. HTC13. In 2011, melting at high elevations (above 2500 m) was ~1 standard deviation above the 1979-2010 average (versus the ~2 standard deviations of 2010). Melting in 2011 was above average over most of Greenland, with large positive anomalies (e.g., longer melting with respect to the average) occurring especially in the west and northwest, with melting lasting up to ~30 days longer than the average.
Fig. 13 -- Melting degree day anomaly in 2011
Fig. 13 -- Scale
Fig. HTC13. Melting degree day anomaly in 2011 relative to the 1979-2010 baseline.

Albedo (J. E. Box and D. K. Hall)

A dominant source of energy for melting is absorbed solar irradiance, which depends on the surface solar reflectivity from ~0.3 µm to ~4 µm in wavelength, known as the albedo. Freshly fallen snow under clear skies has an albedo of ~0.84 (Konzelmann & Ohmura 1995). Over time, and with increasing temperature, snow grain size increases as crystals metamorphose and grow (Wiscombe & Warren 1980, Dozier et al. 1981, Warren 1982) resulting in a decrease in albedo. Melting snow albedo can have values of 0.74 (see measurement summary in Patterson 1994). Impurity-rich ice sheet albedo retrievals from the MODIS sensor on the NASA Terra platform (the MOD10A1 product; Klein & Stroeve 2002) can be as low as 0.31 averaged over 5 x 5 km areas, in agreement with the value recommended by Cuffey and Patterson (2011).

Negative albedo anomalies are widespread over the ice sheet during the 2011 melt period. Figure HTC14 illustrates the 2011 anomalies for summer (June-August), when solar irradiance is highest and the albedo is lowest in magnitude. The albedo anomaly is much larger over the regions where darker bare ice is exposed after the previous winter's snow accumulation has ablated. Fig. HTC15 illustrates the significant albedo decline for the ice sheet.
Fig. 14 -- Summer (JJA) albedo anomaly in 2011
Fig. HTC14. Summer (JJA) albedo anomaly in 2011 relative to the 2000-2008 period.


Fig. 15 -- Greenland ice sheet albedo
Fig. HTC15. Greenland ice sheet albedo from MODIS (Moderate Resolution Imaging Spectroradiometer) observations, 2000-2011.

Surface mass balance along the K-Transect (R. S. W. van de Wal and X. Fettweis)

The 150 km long K-Transect is located near Kangerlussuaq at 67°N between 340 m and 1500 m above sea level (a.s.l.) on the western flank of the ice sheet (van de Wal et al. 2005). Along the K-transect the surface mass balance (the balance between snowfall (positive mass) and melt water runoff (negative mass) during 2010-2011 was less negative than the previous record-breaking year (2008-2009). Remarkably, only at the two highest sites was the mass balance exceptionally negative like the previous year (2009-2010) (Fig. HTC16). The latter is in agreement with preliminary regional atmosphere simulations. This implies that the weighted-average mass balance over the last year is the second lowest mass balance in 21 years. Sites S8 and S9, the two highest sites in the ablation area, account for approximately 50% of the weighted-average mass balance of the entire transect. The strong ablation just below the equilibrium line in the last two years is likely related to the limited snowfall during the preceding winters.

Fig. 16 -- Water equivalent surface mass balance as a function of elevation
Fig. HTC16. Water equivalent (w.e.) surface mass balance as a function of elevation along the K-Transect during 2010-11, 2009-10 and 2008-09 and for the 20-year average (1990-2010).

Figure HTC17 illustrates the cumulative surface mass balance around the equilibrium line altitude at 1500 m. a.s.l. From a slightly positive value at the end of the 1990s there has been a change to a clearly negative value, suggesting an upward migration of the equilibrium line altitude. The equilibrium line elevation at the end of summer 2011 is estimated to be 1720 m. a.s.l. Low accumulation rates are followed by stronger ablation rates in summer 2007 and 2010. This is likely also to be the case in 2011, though the accumulation record of 2010-2011 is not yet available.

Fig. 17 -- The cumulative mass balance in the vicinity of the equilibrium line altitude
Fig. HTC17. The cumulative mass balance in the vicinity of the equilibrium line altitude (67 °N, 50 °W) along the K-Transect.

Surface mass balance from MAR simulations (X. Fettweis)

The observationally-constrained Modèle Atmosphérique Régional (MAR) (Fettweis et al., 2011) is coupled with a one-dimensional multi-layered energy balance snow model (Gallée & Schayes 1994, Lefebre et al. 2003) to simulate surface mass balance over the ice sheet. The skill of MAR has been demonstrated by Fettweis (2007) and Tedesco et al. (2011). The past 51 years of surface mass balance (SMB) components are illustrated in Fig. HTC18. The positive meltwater runoff anomaly in 2011 (Table HTC5) results from a conjunction of warmer conditions along the western coast resulting from anomalies in general circulation and drier conditions (mainly at the south of the ice sheet) allowing low albedo values (enhancing the melt) to be maintained through the whole summer. Although the melt season started late in 2011, at the beginning of June, the dry and warm conditions caused record bare ice exposure, which enhanced the melt. Moreover, at the south of the ice sheet, lower winter accumulation than normal allowed the earlier appearance of the bare ice in the ablation zone. Consequently, the SMB rate simulated by MAR from Sep 2010 to Aug 2011 (Table HTC5) is the second lowest in 50 years after 2010.

Fig. 18 -- Greenland ice sheet surface mass balance anomalies
Fig. HTC18. Greenland ice sheet surface mass balance (GrIS SMB) anomalies in Gt/yr simulated by MAR (Modèle Atmosphérique Régional) relative to 1971-2000.


Table HTC5. Surface mass balance (SMB), snowfall and runoff anomalies in 2011 relative to the 1971-2000 base period from MAR.


SMBSnowfallRunoff
Gt/year-344.3-86.3-273.1
Normalized value-3.6-1.54.4

Greenland mass changes from GRACE (J. Wahr)

GRACE satellite gravity solutions (Velicogna & Wahr 2006) are used to estimate monthly changes in the total mass of the Greenland ice sheet (Fig. HTC19). From the end of April 2010 through the end of April 2011, which roughly corresponds to the period between the beginning of the 2010 and 2011 melt seasons, the ice sheet cumulative loss was -430 Gt, 70% (or 2 standard deviations) larger than the 2003-09 average annual loss rate of -250 Gt y-1. This 2010/2011 mass loss is equivalent to a eustatic sea level rise contribution of 1.1 mm, and is the largest annual loss rate for Greenland in the GRACE record (2002-present), 180 Gt more negative than the 2003-09 average. 2005-2006 had almost as much mass loss as 2010-2011, when evaluated between April/May points. Using GRACE data, Rignot et al. (2011) find an acceleration of Greenland ice sheet mass budget deficit during 1979-2010, in close agreement with an independent mass balance model.
Fig. 19 -- Monthly unsmoothed values of average surface mass density
Fig. HTC19. Monthly unsmoothed values of the total mass (in Gigatons, Gt), of the Greenland ice sheet from GRACE. On the horizontal axis, each year begins on 1 January. Each small + symbol is a monthly value.

Marine-terminating glacier area changes (J. E. Box, D. Decker, C. Chen)

Marine-terminating glaciers are of particular interest because they represent the outlets through which the inland ice can move most quickly and in the largest quantities out to the ocean. Iceberg calving from these glaciers represents an area reduction that can be balanced by forward motion of the ice by flow. Changes at the fronts of marine-terminating outlet glaciers cause flow speed variations by modulating the balance of driving and resistive stresses (Meier & Post 1987, Joughin et al. 2008). Generally, retreat leads to flow acceleration and, in turn, mass loss from the ice sheet, which contributes to sea level rise.
Daily surveys using cloud-free MODIS visible imagery (Box & Decker 2011: http://bprc.osu.edu/MODIS/) indicate that in the year prior to end of the 2011 melt season, marine-terminating glaciers collectively lost an area of 45 km2. This is 84 km2 smaller than the average annual loss rate of the previous 10 years (124 km2 yr-1) (Fig. HTC20). Glacier area change measurements from the 1980s and 1990s (Howat & Eddy 2011) indicate an increased rate of ice area loss in the most recent decade.
Fig. 20 -- Cumulative net annual area change
Fig. HTC20. Cumulative net annual area change for the 39 widest marine-terminating glaciers of the Greenland ice sheet (after Box & Decker 2011). The dashed line is a least-squares regression line.
While the overall area change was negative for 2011, 9 of 39 glaciers grew in area relative to the end of the 2010 melt season. These nine include some of the most productive marine-terminating glaciers, in terms of ice volume discharge. The top ice area gainers included Petermann glacier (+13 km2), which lost ~275 km2 in August 2010, Helheim glacier (+8 km2) and the "79" glacier (+7 km2). One of the most productive east Greenland glaciers, Kangerdlugssauq, increased by +6 km2.

The four glaciers with the largest ice loss were: Humboldt (-20 km2), Zachariae (-19 km2), Steenstrup (-15 km2) and Jakobshavn (-9 km2). According to the linear regression fit in Fig. HTC20, the average annual loss rate for the 39 Greenland glaciers in the past 11 years is 122 km2 year-1. Since 2000, the net area change of the 39 widest marine-terminating glaciers is -1369 km2, nearly 16 times the size of Manhattan Island, New York.

Mittivakkat Gletscher: The longest-observed mountain glacier in Greenland (S. H. Mernild, N. T. Knudsen and E. Hanna)

Mittivakkat Gletscher in southeast Greenland (17.6 km2; 65° 41' N, 37° 48' W) has been surveyed for surface mass balance and glacier front fluctuations since 1995 and 1931, respectively (Knudsen & Hasholt 2002, Mernild et al. 2011). The glacier terminus (at the center line) retreated about 22 m (Fig. HTC21) in 2011, 12 m less than the observed record of 34 m in 2010, and approximately 1,600 m in total since the maximum Little Ice Age extension around 1900 and by approximately 1,300 m since 1931. In 2011, net ablation was recorded at all elevations between the summit (930 m a.s.l.) and the terminus (180 m a.s.l.), indicating that the ELA for Mittivakkat was above 930 m a.s.l., and 200 m above the average since mass balance observations began. The total 2011 mass budget loss was 2.45 m water equivalent (w.e.), 0.29 m w.e. higher than the observed record loss in 2010 and significantly greater than the 16-yr average loss of 0.97±0.19 m w.e. yr-1 (Fig. HTC22).

Fig. 21 -- Mittivakkat Gletscher outlines
Fig. HTC21. The location of the Mittivakkat Gletscher margin delineated as thick lines for 1931, 1943, 1972, 1999, 2005, 2009, 2010, and 2011 (pink). The 1931, 1943, and 1972 margins were estimated from aerial photographs, the 1999 margin from Landsat 5, and the 2005 margin from Quickbird. The more recent 2009, 2010, and 2011 margins were obtained from topographic surveys (Kern Theodolite observations) and GPS measurements. The Mittivakkat Gletscher outline is shown at left with a black square indicating the photographic area (background photograph: DigitalGlobe, Quickbird 2005 and updated from Mernild et al. 2011).


Fig. 22 -- Observed annual water equivalent mass balance
Fig. HTC22. Observed annual water equivalent (w.e.) mass balance of the Mittivakkat Gletscher, southeast Greenland, from 1995 to 2011 (updated from Mernild et al. 2011).


http://www.arctic.noaa.gov/reportcard/greenland_ice_sheet.html

John Mashey: Skeptics Prefer Pal Review Over Peer Review: Chris de Freitas, Pat Michaels And Their Pals, 1997-2003

Skeptics Prefer Pal Review Over Peer Review: Chris de Freitas, Pat Michaels And Their Pals, 1997-2003


by John Mashey, DeSmogBlog, November 30, 2011


Imagine for a moment that climate change skeptics actually submitted their anti-science arguments for publication in a credible peer-reviewed journal. Now imagine that, after thorough examination and debunking by their peers, these skeptics finally admitted their many false claims and assumptions, and perhaps some or all moved on to contribute meaningfully to the vast body of science confirming manmade climate change?
Ok, back to reality.
Instead, the skeptics' greatest and most-often cited (by them) "peer-reviewed studies" appeared in the journal Climate Research between 1997-2003. This journal has been considered credible at certain points in its history, and many fine papers have appeared there.
But according to my new analysis [PDF] of the papers published in Climate Research, there is a very clear gap in credibility during the years 1997-2003 when Chris de Freitas served as one of the journal's editors. During this time, de Freitas oversaw the publication of 14 papers from notorious skeptics - half of them authored by fossil fuel industry pal Pat Michaels - many of which would not have survived rigorous and honest peer review at any other credible journal. 
A few months ago, another journal's editor resigned over a paper that should not have been accepted due to a poor peer review process. It reminded many of us of the more drastic case of Climate Research (CR), where several editors resigned in 2003 in the wake of a colossally poor paper by Willie Soon and Sallie Baliunas, accepted for publication by none other than Chris de Freitas.
It was certainly not the first de Freitas-endorsed paper to pass weak editorial processes at Climate Research, but when incoming Editor-in-Chief Hans von Storch suggested the paper should not have been published, he endeavored to fix editorial processes to prevent such problems.  The publisher did not agree, so von Storch and other editors resigned.
At the time, climate scientists were rightly concerned that CR had become a magnet for poor science. When the hacked CRU emails appeared in 2009, climate skeptics tried to invert reality, claiming that several widely-published climate scientists had conspired to subvert peer review. 
The skeptic echo chamber lauded Chris de Freitas as a noble martyr, a cry that has grown louder this month in the aftermath of the so-called "Climategate 2.0" illegal release of more of the CRU scientists' emails.
This isn't a novel experience when it comes to skeptic "science" efforts. Recall The Wegman Report for example, which attempted to criticize legitimate climate science for "bad" peer review, although it had no such peer critique itself.  A follow-on article, which also had bypassed peer review, ultimately earned a retraction for plagiarism.  
If there seems to be a pattern here, there is. Reality bites back, and it appears set to do so again now.
Last June, Pat Michaels wrote "Pal Review and Peer Review…" This inspired me to revisit the Climate Research episode in a more detailed fashion, and I began checking 700+ papers published there.
As it turns out, the problem was more pervasive than climate scientists had suspected at the time.
My analysis of the Climate Research papers shows that:
  • From 1990 to 1996, CR published zero papers from any of the pals:
    Sallie Baliunas, Robert Balling, John Christy, Robert Davis, (Chris de Freitas), David Douglass, Vincent Gray, Sherwood Idso, PJ Knappenberger, Ross McKitrick, Pat Michaels, Eric Posmentier, Arthur Robinson, Willie Soon, and Gerd-Rainer Weber. DeSmogBlog readers may recognize these names, since most appear in the DeSmogBlog Research Database. They have long histories of cooperation in climate anti-science.
  • Chris de Freitas became an editor and then accepted 14 papers from the pals between 1997-2003. With de Freitas as an editor, Climate Research provided a platform which the pals would quickly embrace to sneak through anti-science papers.
  • After the mass resignation of CR editors in 2003, no more pals’ papers were accepted via de Freitas. After a few more papers via others, the pals published no more in CR.
  • But clearly the Climate Research + Chris de Freitas combination presented a skeptic-friendly opportunity to publish questionable papers, while it lasted.
Not all papers were bad, but some others were dubious.  Even reasonable-looking palspapers often included mesages that might not be justified by the text, but that might make nice quotes for doubt-production.
Michaels authored 7 of the 14 papers, about half of his total "peer-reviewed" production during that period.  Perhaps Michaels might fairly be called "King of the Pals."
The attached PDF analysis shows the chronologies and social networks of the pals, followed by summaries of the papers in the context of Michaels' and de Freitas' publications.  The Excel spreadsheet lists the papers and their attributes.
The scientists were defending peer review from abuse, as was their responsibility to science. de Freitas a martyr for good science?  I don't think so.

Image credit: John T Takai / Shutterstock.
AttachmentSize
pal.review.papers.xls184.5 KB
Pal-review-by-John-Mashey.pdf1.58 MB
http://www.desmogblog.com/skeptics-prefer-pal-review-over-peer-review-chris-de-freitas-pat-michaels-and-their-pals-1997-2003

Wednesday, November 30, 2011

"Rising methane emissions in response to climate change in Northern Eurasia during the 21st century," by Xudong Zhu et al., ERL 6 (2011); doi:10.1088/1748-9326/6/4/045211

Environmental Research Letters, 6(4) (November 2011) 045211; doi:10.1088/1748-9326/6/4/045211 


Rising methane emissions in response to climate change in Northern Eurasia during the 21st century


Xudong Zhu1, Qianlai Zhuang1,2, Min Chen1, Andrey Sirin3, Jerry Melillo4, David Kicklighter4, Andrei Sokolov5 and Lulu Song6


Abstract


We used a biogeochemistry model, the Terrestrial Ecosystem Model (TEM), to examine the methane (CH4) exchanges between terrestrial ecosystems and the atmosphere in Northern Eurasia from 1971 to 2100. Multiple model simulations using various wetland extent datasets and climate change scenarios were conducted to assess the uncertainty of CH4 fluxes, including emissions and consumption. On the basis of these simulations we estimate the current net emissions in the region to be 20–24 Tg CH4 yr − 1 (1 Tg = 1012 g), two-thirds of which are emitted during the summer. In response to climate change over the 21st century, the annual CH4 emissions in the region are projected to increase at a rate of 0.06 Tg CH4 yr − 1, which is an order of magnitude greater than that of annual CH4 consumption. Further, the annual net CH4 emissions are projected to increase by 6–51% under various wetland extent datasets and climate scenarios by the end of the 21st century, relative to present conditions. Spatial patterns of net CH4 emissions were determined by wetland extent. Net CH4 emissions were dominated by wetlands within boreal forests, grasslands and wet tundra areas in the region. Correlation analyses indicated that water table depth and soil temperature were the two most important environmental controls on both CH4 emissions and consumption in the region. Our uncertainty analyses indicated that the uncertainty in wetland extent had a larger effect on future CH4 emissions than the uncertainty in future climate. This study suggests that better characterization of the spatial distribution and the natural diversity of wetlands should be a research priority for quantifying CH4 fluxes in this region.


http://iopscience.iop.org/1748-9326/6/4/045211

CBS: Historic Texas drought could leave lasting impact -- "It was basically off the charts," said John Nielsen-Gammon, a climatologist for the state of Texas. "Based on past history, you wouldn't expect to see it happen in maybe 500 or a 1,000 years."

Historic Texas drought could leave lasting impact

By
Anna Werner, CBS News, November 30, 2011


On Tuesday, the drought in Texas was declared the worst in a century, across nearly the whole state. The drought ranges from severe to exceptional.
It is expected to last until next summer. But as CBS News correspondent Anna Werner reports, the damage could go on for years.
At the Mainstay Farm south of Fort Worth, owner Marianna Wilson still takes school kids on hayrides. They can run a maze or cook marshmallows. What they can't do this year is watch someone cut down a fresh Christmas tree.
"Well you're gonna lose trees from year to year," said Wilson when asked how this year compares to last. "But no, it was bad."
Normally Wilson's fields would be filled with customers cutting their own Christmas trees. But this year the farm lost a quarter of its trees -- 1,500 trees that have died in the drought.
"When you turn on an oven for 80-90 days that we had dry," said Wilson, "it's like baking anything that's outside."
"It was basically off the charts," said John Nielsen-Gammon, a climatologist for the state of Texas. "Based on past history, you wouldn't expect to see it happen in maybe 500 or a 1,000 years.
"One more year and we're already talking about probably a drought more severe than anything we've ever had," he said. "This will become for them the drought of record."
The weather phenomenon known as La Nina is expected to continue to keep rain away from Texas. The impact will be felt for years to come.
Already, damage to agriculture is more than $5 billion as ranchers are forced to sell off cattle they can't feed. The state's reservoirs are 40 percent below normal and communities like Groesbeck, Texas may run out of water within weeks.
To replace the trees she lost, farmer Wilson shipped in extra Frasier firs from North Carolina and she's planting more of a drought-resistant strain of Christmas trees. She says they grow well in this climate: they're from Arizona.


