Blog Archive

Monday, October 5, 2009

Lester R. Brown: Civilization can be saved from climate change and food shortages

Civilization can be saved from climate change and food shortages


wheat100209_optBY LESTER R. BROWN, IPS NEWS AGENCY
COMMENTARY
WASHINGTON — In early 2008, Saudi Arabia announced that, after being self-sufficient in wheat for over 20 years, the non-replenishable aquifer it had been pumping for irrigation was largely depleted.
In response, officials said they would reduce their wheat harvest by one-eighth each year until production would cease entirely in 2016. The Saudis would then import virtually all the grain consumed by their Canada-sized population of nearly 30 million people.

The Saudis are unique in being so wholly dependent on irrigation. But other, far larger, grain producers such as India and China are facing irrigation water losses and could face grain production declines.

Emerging Trends Threaten Food Security

Fifteen percent of India's grain harvest is produced by overpumping its groundwater. In human terms, 175 million Indians are being fed with grain produced from wells that will be going dry. The comparable number for China is 130 million. Among the many other countries facing harvest reductions from groundwater depletion are Pakistan, Iran, and Yemen.

The tripling of world wheat, rice, and corn prices between mid-2006 and mid-2008 signaled our growing vulnerability to food shortages. It took the worst economic meltdown since the Great Depression to lower grain prices.

Past decades have witnessed world grain price surges, but they were event-driven — a drought in the former Soviet Union, a monsoon failure in India, or a crop-withering heat wave in the U.S. Corn Belt. This most recent price surge was trend-driven, the result of our failure to reverse the environmental trends that are undermining world food production.

These trends include — in addition to falling water tables — eroding soils and rising temperatures from increasing greenhouse gas emissions. Rising temperatures bring crop-shrinking heat waves, melting ice sheets, rising sea level, and shrinking mountain glaciers.

With both the Greenland and West Antarctic ice sheets melting at an accelerating pace, sea level could rise by up to six feet during this century. Such a rise would inundate much of the Mekong Delta, which produces half of the rice in Vietnam, the world's second-ranking rice exporter. Even a three-foot rise in sea level would cover half the riceland in Bangladesh, a country of 160 million people. And these are only two of Asia's many rice-growing river deltas.

The world's mountain glaciers have shrunk for 18 consecutive years. Many smaller glaciers have disappeared. Nowhere is the melting more alarming than in the Himalayas and on the Tibetan plateau where the ice melt from glaciers sustains not only the dry-season flow of the Indus, Ganges, Yangtze, and Yellow rivers but also the irrigation systems that depend on them. Without these glaciers, many Asian rivers would cease to flow during the dry season.

The wheat and rice harvests of China and India would be directly affected. China is the world's leading wheat producer. India is second. (The United States is third.) With rice, China and India totally dominate the world harvest. The projected melting of these glaciers poses the most massive threat to food security the world has ever faced.

The Harbinger of Civilization's Demise?

The number of hungry people, which was declining for several decades, bottomed out in the mid-1990s at 825 million. In 2009 it jumped to over one billion. With world food prices projected to continue rising, so too will the number of hungry people.

We know from studying earlier civilizations such as the Sumerians, Mayans, and many others, that more often than not it was food shortages that led to their demise. It now appears that food may be the weak link in our early twenty-first century civilization as well.

Will we follow in the footsteps of the Sumerians and the Mayans or can we change course — and do it before time runs out? Can we move onto an economic path that is environmentally sustainable? We think we can. That is what Plan B 4.0 is about.

Mobilizing to Save Civilization

Plan B aims to stabilize climate, stabilize population, eradicate poverty, and restore the economy's natural support systems. It prescribes a worldwide cut in net carbon emissions of 80% by 2020, thus keeping atmospheric CO2 concentrations from exceeding 400 ppm.

Cutting carbon emissions will require both a worldwide revolution in energy efficiency and a shift from oil, coal, and gas to wind, solar, and geothermal energy.

The shift to renewable sources of energy is moving at a pace and on a scale we could not imagine even two years ago.

Consider the state of Texas. The enormous number of wind projects under development, on top of the 9,000 megawatts of wind generating capacity in operation and under construction, will bring Texas to over 50,000 megawatts of wind generating capacity (think 50 coal-fired power plants) when all these wind farms are completed. This will more than satisfy the needs of the state's 24 million residents.

Nationwide, new wind generating capacity in 2008 totaled 8,400 megawatts while new coal plants totaled only 1,400 megawatts. The annual growth in solar generating capacity will also soon overtake that of coal. The energy transition is under way.

The United States has led the world in each of the last four years in new wind generating capacity, having overtaken Germany in 2005. But this lead will be short-lived. China is working on six wind farm mega-complexes with generating capacities that range from 10,000 to 30,000 megawatts, for a total of 105,000 megawatts. This is in addition to the hundreds of smaller wind farms built or planned.

Wind is not the only option. In July 2009, a consortium of European corporations led by Munich Re, and including Deutsche Bank, Siemens, and ABB plus an Algerian firm, announced a proposal to tap the massive solar thermal generating capacity in North Africa and the eastern Mediterranean.

Solar thermal power plants in North Africa could economically supply half of Europe's electricity. The Algerians note that they have enough harnessable solar energy in their desert to power the world economy. (No, this is not an error.)

The soaring investment in wind, solar, and geothermal energy is being driven by the exciting realization that these renewables can last as long as the earth itself. In contrast to investing in new oil fields where well yields begin to decline in a matter of decades, or in coal mines where the seams run out, these new energy sources can last forever.

At a Tipping Point

We are in a race between political tipping points and natural tipping points. Can we cut carbon emissions fast enough to save the Greenland ice sheet and avoid the resulting rise in sea level? Can we close coal-fired power plants fast enough to save at least the larger glaciers in the Himalayas and on the Tibetan Plateau? Can we stabilize population by lowering fertility before nature takes over and halts population growth by raising mortality?

Yes. But it will take something close to a wartime mobilization, one similar to that of the United States in 1942 as it restructured its industrial economy in a matter of months. We used to talk about saving the planet, but it is civilization itself that is now at risk.

Saving civilization is not a spectator sport. Each of us must push for rapid change. And we must be armed with a plan outlining the changes needed.

*Lester R. Brown is founder and president of the Earth Policy Institute. "Plan B 4.0: Mobilizing to Save Civilization" can be downloaded for free at www.earth-policy.org/.

Link:  http://www.newjerseynewsroom.com/science-updates/civilization-can-be-saved-from-climate-change-and-food-shortages



Across Arctic, time may run out on timeless spectacle of migrating caribou; warming blamed

Across Arctic, time may run out on timeless spectacle of migrating caribou; warming blamed


ON THE PORCUPINE RIVER TUNDRA, Yukon Territory - Here on the endlessly rolling and tussocky terrain of northwest Canada, where man has hunted caribou since the Stone Age, the vast antlered herds are fast growing thin. And it's not just here.

Across the tundra 1,500 kilometers (1,000 miles) to the east, Canada's Beverly herd, numbering more than 200,000 a decade ago, can barely be found today.

Halfway around the world in Siberia, the biggest aggregation of these migratory animals, of the dun-colored herds whose sweep across the Arctic's white canvas is one of nature's matchless wonders, has shrunk by hundreds of thousands in a few short years.

From wildlife spectacle to wildlife mystery, the decline of the caribou — called reindeer in the Eurasian Arctic — has biologists searching for clues, and finding them.

They believe the insidious impact of climate change, its tipping of natural balances and disruption of feeding habits, is decimating a species that has long numbered in the millions and supported human life in Earth's most inhuman climate.

Many herds have lost more than half their number from the maximums of recent decades, a global survey finds. They "hover on the precipice of a major decline," it says.

The "People of the Caribou," the native Gwich'in of the Yukon and Alaska, were among the first to sense trouble, in the late 1990s, as their Porcupine herd dwindled. From 178,000 in 1989, the herd — named for the river crossing its range — is now estimated to number 100,000.

"They used to come through by the hundreds," James Firth, 56, of the Gwich'in Renewable Resources Board said as he guided two Associated Press journalists across the tundra.

Off toward distant horizons this summer afternoon, only small groups of a dozen or fewer migrating caribou could be seen grazing southward across the spongy landscape, green with a layer of grasses, mosses and lichen over the Arctic permafrost.

"I've never seen it like this before," Firth said of the sparse numbers.

More than 50 identifiable caribou herds migrate over huge wilderness tracts in a wide band circling the top of the world. They head north in the spring to ancient calving grounds, then back south through summer and fall to winter ranges closer to northern forests.

The Porcupine herd moves over a 250,000-square-kilometer (100,000-square-mile) range, calving in the Arctic National Wildlife Refuge, near Alaska's north coast, where proposals for oil drilling have long stirred opposition from environmentalists seeking to protect the caribou.

The global survey by researchers at the University of Alberta, published in June in the peer-reviewed journal Global Change Biology, has deepened concerns about the caribou's future.

Drawing on scores of other studies, government databases, wildlife management boards and other sources, the biologists found that 34 of 43 herds being monitored worldwide are in decline. The average falloff in numbers was 57% from earlier maximums, they said.

Siberia's Taimyr herd has declined from 1 million in 2000 to an estimated 750,000, as reported in the 2008 "Arctic Report Card" of the U.S. National Oceanic and Atmospheric Administration.

The Taimyr is the world's largest herd, but Canada and Alaska have more caribou, and the Alberta study reported that 22 of 34 North American herds are shrinking. Data were insufficient to make a judgment on seven others.

In an AP interview, Liv Solveig Vors, the June report's lead author, summarized what is believed behind the caribou crash: "Climate change is changing the way they're interacting with their food, directly and indirectly."
Global warming has boosted temperatures in the Arctic twice as much as elsewhere, and Canadian researchers say the natural balance is suffering:

Unusual freezing rains in autumn are locking lichen, the caribou's winter forage, under impenetrable ice sheets. This was the documented cause in the late 1990s of the near-extinction of the 50,000-strong Peary caribou subspecies on Canada's High Arctic islands.

lways tormented and weakened caribou, but warmer temperatures have aggravated this summertime problem, driving the animals on crazed, debilitating runs to escape, and keeping them from foraging and fattening up for winter.


The springtime Arctic "green-up" is occurring two weeks or more earlier. The great caribou migrations evolved over ages to catch the shrubs on the calving grounds at their freshest and most nutritious. But pregnant, migrating cows may now be arriving too late.

Vors said caribou are unlikely to adjust.

"Evolutionary changes tend to take place over longer time scales than the time scale of climate change at the moment," she said. Climatologists foresee northern temperatures rising several degrees more this century unless global greenhouse gas emissions are sharply reduced soon.

Caribou herds have gone through boom-and-bust cycles historically, but were never known to decline so uniformly worldwide.

Leading Canadian specialist Don Russell, coordinator of a new global network formed to more closely monitor what's happening to the herds, said experts are focusing on "what has changed between this decline and previous declines."

"We've seen a number of areas where climate change is playing a big role, and we see some very dramatic trends," he said in an interview in Whitehorse, the Yukon territorial capital.

In neighboring Northwest Territories, the territorial government on Sept. 24, 2009, reported results of its aerial survey of the Bathurst herd: Its population has dropped to about 32,000, from 128,000 in 2006.

"The numbers are not getting better. There's no good news, no indication of recovery," J. Michael Miltenberger, the environment and natural resources minister, said by telephone from Yellowknife, the capital.
He said "there's a huge issue" with the Beverly herd, which numbered 276,000 in 1994, ranging over the Canadian tundra 1,500 kilometers (1,000 miles) due north of North Dakota.

"We've been flying north to south, east to west," Miltenberger said. "By our count, with the Beverly herd, they've all but disappeared."

Climate change is piling problem upon problem on the caribou, he said, including bogging them down in thawing permafrost and lengthening the wildfire season, burning up their food.

"The cumulative impact is bringing enormous pressure on the caribou," he said.

And that puts pressure on Canada's "first nations," who for at least 8,000 years have relied on the harvest of caribou meat for the winter larder, have settled along migration routes, have built their material culture around the animal — using skin, bones and sinews for clothing, shelter, tools, thread, even their drums.

"There are probably ominous implications for communities relying on caribou," Russell said.

Such reliance is mirrored in Siberia and northern Scandinavia, where the Sami people make a hard living herding reindeer as livestock. Freezing rains there are reported to have forced Sami to buy fodder to substitute for ice-locked forage.

Here in the timeless, silent beauty of Gwich'in country, his people may face "hard decisions," Firth acknowledged, perhaps to limit their hunt to ease the pressure. Last week, the Yukon government took a first step, restricting hunting to bulls, to spare reproducing cows.

"The future of the Gwich'in and the future of the caribou are the same," the Gwich'in often say. But even more may be at stake.

On this summer day above the Arctic Circle, binoculars found a group of caribou being stalked and circled by a hungry grizzly bear, a needy predator and another link in an intricate, interdependent natural web that may be unraveling, year by year and degree by degree, on the tundra.

Link:   http://www.startribune.com/world/63476582.html

Sunday, October 4, 2009

Nike said to be quitting Chamber of Commerce post over climate controversy

Nike said to be quitting Chamber of Commerce post over climate controversy

As Exelon becomes the latest energy firm to quit the business group over its anti-climate legislation stance, pressure mounts on Nike to follow suit. From BusinessGreen.com, part of the Guardian Environment Network
Nike 'We Run Together' Paula Radcliffe ad
Nike 'We Run Together' advert: reports suggest Nike will no longer run together with the US Chamber of Commerce because of its stance on climate change.

The US Chamber of Commerce's controversial calls to put the latest climate science "on trial" as part of its campaign to block proposed carbon legislation could yet prompt another high-profile walk out, after reports emerged that Nike was to quit it's post on the trade group's board.

According to reports on the Politico blog, the company is to release a statement relinquishing its board position at the Chamber in protest at the group's lobbying against tougher US climate change legislation. However, it will stop short of leaving the group altogether so that it can "advocate for climate change legislation" from within the group.

The news comes after shareholder groups yesterday wrote to Nike calling on the sportswear giant to quit the trade group.

According to reports, three socially responsible investor groups -- Green Century Funds, Newground Social Investment and the Basilian Fathers of Toronto -- have written to the company arguing that it is no longer in the firm's interest to be associated with a group that is lobbying to block US climate change legislation.

In an open letter to Nike chief executive Mark Parker, Kristina Curtis, president of Green Century Equity Fund, said that the investment firm was "dismayed that Nike has not taken a more aggressive stance" against the Chamber, particularly given that it has been a vocal supporter of tighter climate change legislation through its position as a founding member of the Business for Innovative Climate and Energy Policy group.

Curtis added that the decision last week by US energy firms Pacific Gas & Electric Company (PG &E) and PNM Resources to leave the Chamber of Commerce over its climate change stance had set a "new standard for corporate responsibility in the face of profoundly unsustainable actions" that Nike should now follow.

Earlier this month, the Chamber's vice president for environment, technology and regulatory affairs gave an interview to the Los Angeles Times in which he called for a series of public hearings on the science the EPA used to justify its recent decision that carbon dioxide represents a health risk and can be regulated under the Clean Air Act.

Likening the proposed hearings to the 1920s Scopes Trial on evolution, Kovacs said that the hearings would represent the "science of climate change on trial."

The Chamber has since tried to soften its stance slightly, arguing that the analogy was "inappropriate" and that it is simply calling for hearings on the extent to which global warming poses a threat, rather than on climate science itself.

But the move has still prompted a flurry of high-profile walk outs from firms lobbying for more ambitious action on climate change. In the latest development, US nuclear energy giant Exelon this week announced that it will join PG&E and PNM Resources in not renewing its membership.

Speaking at a meeting of the American Council for an Energy Efficient Economy, Exelon chairman and chief executive John W. Rowe said that the company had left the chamber as a direct result of its "stridency against carbon legislation", adding that putting a price on carbon emissions through a national cap-and-trade scheme was "essential" to tackling climate change.

Link:  http://www.guardian.co.uk/environment/2009/oct/01/nike-chamber-commerce

Black carbon poses threat to Himalayan and Tibetan plateau glaciers

Soot clouds pose threat to Himalayan glaciers

Fumes from wood fires and from diesel engines accelerate melting, Indian scientists warn
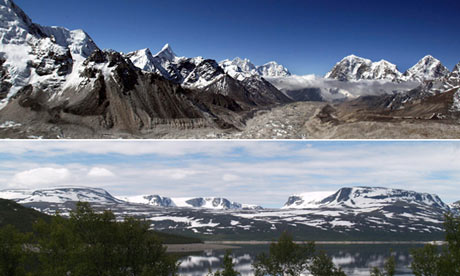
Mountains erosion : Himalayas and Glacially eroded mountains in Jotunheimen in Norway
Top: Aerial photograph of the Khumbu Glacier and the Everest Himalayan range. Bottom: Glacially eroded mountains in Jotunheimen in Norway. Photograph: David Lundbek Egholm (bottom) and Paula Bronstein/Getty Images

Glaciers in the Himalayas and the Tibetan plateau that feed the river systems of almost half the world's people are melting faster because of the effects of clouds of soot from diesel fumes and wood fires, according to scientists in India and China.

The results, to be announced this month in Kashmir, show for the first time that clouds of soot – made up of tiny particles of "black carbon" emitted from old diesel engines and from cooking with wood, crop waste or cow dung – are "unequivocally having an impact on glacial melting" in the Himalayas.

Scientists say that, while the threat of carbon dioxide to global warming has been accepted, soot from developing countries is a largely unappreciated cause of rising temperatures. Once the black carbon lands on glaciers, it absorbs sunlight that would otherwise be reflected by the snow, leading to melting. "This is a huge problem which we are ignoring," said Professor Syed Hasnain of the Energy and Resources Institute (Teri) in Delhi. "We are finding concentrations of black carbon in the Himalayas in what are supposed to be pristine, untouched environments."

The institute has set up two sensors in the Himalayas, one on the Kholai glacier that sits on the mountain range's western flank in Kashmir and the other flowing through the eastern reaches in Sikkim. Glaciers in this region feed most of the major rivers in Asia. The short-term result of substantial melting is severe flooding downstream.

Hasnain says India and China produce about a third of the world's black carbon, and both countries have been slow to act. "India is the worst. At least in China the state has moved to measure the problem. In Delhi no government agency has put any sensors on the ground. [Teri] is doing it by ourselves."

In August this year Yao Tandong, director of China's Institute of Tibetan Plateau Research, projected "a 43% decrease in glacial area by 2070", adding that "more and more scientists have come to recognise the impact of black carbon in glacial melting."

Black carbon's role has only recently been recognised – it was not mentioned as a factor in the UN's major 2007 report on climate change –but this month the UN environment programme called for cuts in black carbon output. In November it will publish a report stating that 50% of the emissions causing global warming are from non-CO2 pollutants.

Decreasing black carbon emissions should be a relatively cheap way to significantly curb global warming. Black carbon falls from the atmosphere after just a couple of weeks, and replacing primitive cooking stoves with modern versions that emit far less soot could quickly end the problem. Controlling traffic in the Himalayan region should help ease the harm done by emissions from diesel engines.

Both New Delhi and Beijing, say experts, have been reluctant to come forward with plans on black carbon because they do not want attention diverted from richer nations' responsibility to cut carbon dioxide emissions.

At a high-level forum on energy in Washington on Thursday, India's environment minister, Jairam Ramesh, rejected attempts to link black carbon to the efforts to reach an international agreement to cut greenhouse gas emissions. Black carbon had no place in the Copenhagen negotiations towards a global pact on global warming, he said. "Black carbon is another issue. I know there is now a desire to bring the black carbon issue into the mainstream. I am simply not in favour of it."

Link:  http://www.guardian.co.uk/environment/2009/oct/04/climate-change-melting-himalayan-glaciers

Carbon-dioxide emissions are turning the waters of the Arctic Ocean into acid at an unprecedented rate, putting vital food chain at risk, scientists have discovered

Arctic seas turn to acid, putting vital food chain at risk

With the world's oceans absorbing six million tonnes of carbon a day, a leading oceanographer warns of eco disaster
Carbon-dioxide emissions are turning the waters of the Arctic Ocean into acid at an unprecedented rate, scientists have discovered. Research carried out in the archipelago of Svalbard has shown in many regions around the north pole seawater is likely to reach corrosive levels within 10 years. The water will then start to dissolve the shells of mussels and other shellfish and cause major disruption to the food chain. By the end of the century, the entire Arctic Ocean will be corrosively acidic.

"This is extremely worrying," Professor Jean-Pierre Gattuso, of France's Centre National de la Recherche Scientifique, told an international oceanography conference last week. "We knew that the seas were getting more acidic and this would disrupt the ability of shellfish – like mussels – to grow their shells. But now we realise the situation is much worse. The water will become so acidic it will actually dissolve the shells of living shellfish."

Just as an acid descaler breaks apart limescale inside a kettle, so the shells that protect molluscs and other creatures will be dissolved. "This will affect the whole food chain, including the North Atlantic salmon, which feeds on molluscs," said Gattuso, speaking at a European commission conference, Oceans of Tomorrow, in Barcelona last week. The oceanographer told delegates that the problem of ocean acidification was worse in high latitudes, in the Arctic and around Antarctica, than it was nearer the equator.

"More carbon dioxide can dissolve in cold water than warm," he said. "Hence the problem of acidification is worse in the Arctic than in the tropics, though we have only recently got round to studying the problem in detail."

About a quarter of the carbon dioxide pumped into the atmosphere by factories, power stations and cars now ends up being absorbed by the oceans. That represents more than six million tonnes of carbon a day.
This carbon dioxide dissolves and is turned into carbonic acid, causing the oceans to become more acidic. "We knew the Arctic would be particularly badly affected when we started our studies, but I did not anticipate the extent of the problem," said Gattuso.

His research suggests that 10% of the Arctic Ocean will be corrosively acidic by 2018; 50% by 2050; and 100% ocean by 2100. "Over the whole planet, there will be a threefold increase in the average acidity of the oceans, which is unprecedented during the past 20 million years. That level of acidification will cause immense damage to the ecosystem and the food chain, particularly in the Arctic," he added.

The tiny mollusc Limacina helicina, which is found in Arctic waters, will be particularly vulnerable, he said. The little shellfish is eaten by baleen whales, salmon, herring and various seabirds. Its disappearance would therefore have a major impact on the entire marine food chain. The deep-water coral Lophelia pertusa would also be extremely vulnerable to rising acidity. Reefs in high latitudes are constructed by only one or two types of coral – unlike tropical coral reefs which are built by a large variety of species. The loss of Lophelia pertusa would therefore devastate reefs off Norway and the coast of Scotland, removing underwater shelters that are exploited by dozens of species of fish and other creatures.

"Scientists have proposed all sorts of geo-engineering solutions to global warming," said Gattuso. "For instance, they have proposed spraying the upper atmosphere with aerosol particles that would reduce sunlight reaching the Earth, mitigating the warming caused by rising levels of carbon dioxide.

"But these ideas miss the point. They will still allow carbon dioxide emissions to continue to increase – and thus the oceans to become more and more acidic. There is only one way to stop the devastation the oceans are now facing and that is to limit carbon-dioxide emissions as a matter of urgency."

This was backed by other speakers at the conference. Daniel Conley, of Lund University, Sweden, said that increasing acidity levels, sea-level rises and temperature changes now threatened to bring about irreversible loss of biodiversity in the sea. Christoph Heinze, of Bergen University, Norway, said his studies, part of the EU CarboOcean project, had found that carbon from the atmosphere was being transported into the oceans' deeper waters far more rapidly than expected and was already having a corrosive effect on life forms there.
The oceans' vulnerability to climate change and rising carbon-dioxide levels has also been a key factor in the launching of the EU's Tara Ocean project at Barcelona. The expedition, on the sailing ship Tara, will take three years to circumnavigate the globe, culminating in a voyage through the icy Northwest Passage in Canada, and will make continual and detailed samplings of seawater to study its life forms.

A litre of seawater contains between 1 bn and 10 bn single-celled organisms called prokaryotes, between 10 bn and 100 bn viruses and a vast number of more complex, microscopic creatures known as zooplankton, said Chris Bowler, a marine biologist on Tara.

"People think they are just swimming in water when they go for a dip in the sea," he said. "In fact, they are bathing in a plankton soup."

That plankton soup is of crucial importance to the planet, he added. "As much carbon dioxide is absorbed by plankton as is absorbed by tropical rainforests. Its health is therefore of crucial importance to us all."

However, only 1% of the life forms found in the sea have been properly identified and studied, said Bowler. "The aim of the Tara project is to correct some of that ignorance and identify many more of these organisms while we still have the chance. Issues like ocean acidification, rising sea levels and global warming will not be concerns at the back of our minds. They will be a key focus for the work that we do while we are on our expedition."

The toll by 2100

■ The Intergovernmental Panel on Climate Change forecast in 2007 that sea levels would rise by 20-60 cm by 2100 thanks to global warming caused by man-made carbon-dioxide emissions. This is now thought to be an underestimate, however, with most scientific bodies warning that sea levels could rise by a metre or even higher. Major inundations of vulnerable regions such as Bangladesh would ensue.

■ The planet will be hotter by 3 °C by 2100, most scientists now expect, though rises of 4.5-5 °C could be experienced. Deserts will spread and heatwaves will become more prevalent. Ice-caps will melt and cyclones are also likely to be triggered.

■ Weather patterns across the globe will become more unstable, numbers of devastating storms will increase dramatically while snow will disappear from all but the highest mountains.

Link to article:  http://www.guardian.co.uk/world/2009/oct/04/arctic-seas-turn-to-acid

Saturday, October 3, 2009

NASA: ICESat 8 day repeat of Greenland elevations

I just found this page on the net, so it may take me a while to figure it out. I am not sure of the date of this image, but it looks fairly recent to me.

Here is the link to the page:

http://icesat.gsfc.nasa.gov/list.php


Friday, October 2, 2009

Jakobshavn Isbræ's floating tongue breaking up. Part II

Here is the MODIS Rapidfire image of the Jakobshavn Isbræ on September 13, 2009.  The tongue is broken.  Be sure to click on the photos to enlarge them and view them in more detail.


Below is an image from September 28, 2009.  The front of the tongue (tip?) is breaking up.  Note that this glacier moves (or the last reported speed) at a pace of only 17 km per year, so that tip of the tongue breaking had nothing to do with the break further in.


Also notice the greyish squiggle (I love that I can use non-scientific language in this blog) in the upper right -- that is the upstream ice stream deep into the the edge of the ice sheet.  Further, be aware that the beginning of the tongue starts much further back than the 2006 record.

Can anyone tell me if this is a normal thing that happens every year?  I don't think it is, but please correct me if I am wrong.

Sorry -- the images are not crystal clear due to the cloud cover hanging over that area.

UPDATE:  CLEAR IMAGES FROM OCTOBER 1, 2009:

Links to originals for the last two images (don't forget to click on them):

http://rapidfire.sci.gsfc.nasa.gov/realtime/single.php?2009274/crefl1_143.A2009274151500-2009274151959.250m.jpg

http://rapidfire.sci.gsfc.nasa.gov/realtime/single.php?2009274/crefl2_143.A2009274153500-2009274154000.250m.jpg

Thursday, October 1, 2009

NASA's JPL: Launch of Aquarius/SAC-D designed to provide monthly global maps of how salt concentration varies on the ocean surface – a key indicator of ocean circulation and its role in climate change, May 2010

Dear Readers,

This might sound to you like the most boring topic known to man, but in fact the measurement of salt concentrations in the ocean indicates its interactions with the atmosphere. They need good measurements to improve their ocean-atmosphere coupled models. For example, at times there is a difference between the salt concentrations in the western Atlantic (around Central America)and the eastern Pacific great enough to very significantly affect weather patterns and where lots of rain falls and where it doesn't. (How's that for layman's language!)

JPL/NASA News


Alan Buis 818-354-0474
Jet Propulsion Laboratory, Pasadena, Calif.
Alan.buis@jpl.nasa.gov

Sandra Torrusio 011-54-11-4331-0074, ext. 288
Comisión Nacional de Actividades Espaciales, Buenos Aires, Argentina
storrusio@conae.gov.ar

News release: 2009-149                                                                      Oct. 1, 2009

International Science Teams Selected for Aquarius/SAC-D Mission

PASADENA, Calif. – NASA and Argentina's Comisión Nacional de Actividades Espaciales (CONAE), with support from the Argentine Ministry of Science, Technology and Innovative Production (MinCyT), have selected additional members of the international scientific investigating team for the Aquarius/Satélite de Aplicaciones Científicas (SAC)-D mission, scheduled to launch in 2010. The new team members include two from NASA's Jet Propulsion Laboratory, Pasadena, Calif.

The joint minimum three-year mission will carry a suite of instruments into space onboard the Argentine-built SAC-D spacecraft. NASA's sensor, Aquarius, is the primary instrument on the mission. Aquarius is designed to provide monthly global maps of how salt concentration varies on the ocean surface – a key indicator of ocean circulation and its role in climate change. Seven CONAE-sponsored instruments will provide environmental data for a wide range of applications, including natural hazards, land processes, epidemiological studies and air quality issues.

NASA and CONAE conducted a joint solicitation and selection of scientific investigations and innovative application demonstration projects using Aquarius/SAC-D observations. NASA selected 15 projects that it will fund over the next four years for a total of $8 million. CONAE/MinCyT selected 15 Argentine projects with participation of scientists from Chile and Brazil, which will be funded for a total of $1.3 million. An additional 10 proposals were selected from scientists in Italy and Japan.

The primary focus of the selected projects is to prepare the scientific community to use Aquarius/SAC-D observations to better understand the interactions between global ocean circulation, the water cycle and Earth's climate. Several projects will concentrate on socio-economic applications of the mission's observations in such areas as fishery management, disease and flood forecasting, and monitoring volcanic eruptions and fires.

The principal investigators for the NASA-funded projects are:

- William Asher, University of Washington, Seattle
- Frederick Bingham, University of North Carolina, Wilmington
- Shannon Brown, NASA's Jet Propulsion Laboratory, Pasadena, Calif.
- Antonio Busalacchi, University of Maryland, College Park
- Ichiro Fukumori, Jet Propulsion Laboratory, Pasadena, Calif.
- Arnold Gordon, Lamont-Doherty Earth Observatory, Columbia University, Palisades, N.Y.
- Thomas Jackson, U. S. Department of Agriculture, Beltsville, Md.
- W. Linwood Jones, University of Central Florida, Orlando
- Roger Lang, George Washington University, Washington, D.C.
- William Large, National Center for Atmospheric Research, Boulder, Colo.
- Nikolai Maximenko, University of Hawaii, Honolulu
- Rui Ponte, Atmospheric and Environmental Research, Inc., Cambridge, Mass.
- Stephen Riser, University of Washington, Seattle
- Douglas Vandemark, University of New Hampshire, Durham
- Frank Wentz, Remote Sensing Systems, Santa Rosa, Calif.

The principal investigators for the CONAE/MinCyT-funded projects are:

- Miguel Bertolami, National University of the Patagonia San Juan Bosco, Chubut, Argentina
- Marcelo Cassini, National University of Luján, Buenos Aires, Argentina
- Carlos Cotlier, National University of Rosario, Santa Fe, Argentina
- Dora Goniadzki, National Water Institute, Buenos Aires, Argentina
- Raúl Guerrero, National Institute for Fisheries Research and Development, Buenos Aires, Argentina
- Haydee Karszenbaum, University of Buenos Aires, Buenos Aires, Argentina
- Maite Narvarte, Marine Biology Institute Alte. Storni, Chubut, Argentina
- Alberto Piola, Naval Hydrographic Service, Buenos Aires, Argentina
- Gloria Pujol, National Meteorological Service, Buenos Aires, Argentina
- Mirta Raed, National University of Luján, Buenos Aires, Argentina
- Raúl Rivas, National University of Centro, Buenos Aires, Argentina
- Cristina Rodriguez, Mariscope Chilena Department of Oceanography, Puerto Montt, Chile
- Hector Salgado, Naval Hydrographic Service, Buenos Aires, Argentina
- Paola Salio, National University of Buenos Aires, Buenos Aires, Argentina
- Cristina Serafini, National University of Luján, Buenos Aires, Argentina

NASA is providing the Aquarius instrument (which was built by JPL), along with launch services and Aquarius science data processing. JPL manages the Aquarius mission for NASA. NASA's Goddard Space Flight Center, Greenbelt, Md., is providing the Aquarius instrument radiometer. CONAE is providing the SAC-D spacecraft; additional instruments, including optical and thermal cameras, a microwave radiometer and other specific sensors (with participation from Italy, France, Canada and various Argentine institutions); and mission operations.

Launch of Aquarius/SAC-D onboard a Delta II rocket is scheduled for no earlier than May 2010 from Vandenberg Air Force Base in California.

For more information on the Aquarius/SAC-D mission, visit: http://aquarius.nasa.gov and http://www.conae.gov.ar/satelites/sac-d.html . JPL is managed for NASA by the California Institute of Technology in Pasadena.

Real Climate finally kicks some butt! Yeah!!!

Hey Ya! (mal)

Filed under: — group @ 30 September 2009, Realclimate.org
 
Interesting news this weekend. Apparently everything we’ve done in our entire careers is a “MASSIVE lie” (sic) because all of radiative physics, climate history, the instrumental record, modeling and satellite observations turn out to be based on 12 trees in an obscure part of Siberia. Who knew?


Indeed, according to both the National Review and the Daily Telegraph (and who would not trust these sources?), even Al Gore’s use of the stair lift in An Inconvenient Truth was done to highlight cherry-picked tree rings, instead of what everyone thought was the rise in CO2 concentrations in the last 200 years.
Al Gore apparently confusing a CO2 curve for a tree
Who should we believe? Al Gore with his “facts” and “peer reviewed science” or the practioners of “Blog Science“? Surely, the choice is clear….

Yamal sub-fossil larch trees in river sedimentMore seriously, many of you will have noticed yet more blogarrhea about tree rings this week. The target de jour is a particular compilation of trees (called a chronology in dendro-climatology) that was first put together by two Russians, Hantemirov and Shiyatov, in the late 1990s (and published in 2002). This multi-millennial chronology from Yamal (in northwestern Siberia) was painstakingly collected from hundreds of sub-fossil trees buried in sediment in the river deltas. They used a subset of the 224 trees they found to be long enough and sensitive enough (based on the interannual variability) supplemented by 17 living tree cores to create a “Yamal” climate record.
A preliminary set of this data had also been used by Keith Briffa in 2000 (pdf) (processed using a different algorithm than used by H&S for consistency with two other northern high latitude series), to create another “Yamal” record that was designed to improve the representation of long-term climate variability.

Since long climate records with annual resolution are few and far between, it is unsurprising that they get used in climate reconstructions. Different reconstructions have used different methods and have made different selections of source data depending on what was being attempted. The best studies tend to test the robustness of their conclusions by dropping various subsets of data or by excluding whole classes of data (such as tree-rings) in order to see what difference they make so you won’t generally find that too much rides on any one proxy record (despite what you might read elsewhere).

****

So along comes Steve McIntyre, self-styled slayer of hockey sticks, who declares without any evidence whatsoever that Briffa didn’t just reprocess the data from the Russians, but instead supposedly picked through it to give him the signal he wanted. These allegations have been made without any evidence whatsoever.

McIntyre has based his ‘critique’ on a test conducted by randomly adding in one set of data from another location in Yamal that he found on the internet. People have written theses about how to construct tree ring chronologies in order to avoid end-member effects and preserve as much of the climate signal as possible. Curiously no-one has ever suggested simply grabbing one set of data, deleting the trees you have a political objection to and replacing them with another set that you found lying around on the web.

The statement from Keith Briffa clearly describes the background to these studies and categorically refutes McIntyre’s accusations. Does that mean that the existing Yamal chronology is sacrosanct? Not at all – all of the these proxy records are subject to revision with the addition of new (relevant) data and whether the records change significantly as a function of that isn’t going to be clear until it’s done.

What is clear however, is that there is a very predictable pattern to the reaction to these blog posts that has been discussed many times. As we said last time there was such a kerfuffle:
However, there is clearly a latent and deeply felt wish in some sectors for the whole problem of global warming to be reduced to a statistical quirk or a mistake. This led to some truly death-defying leaping to conclusions when this issue hit the blogosphere.
Plus ça change…

The timeline for these mini-blogstorms is always similar. An unverified accusation of malfeasance is made based on nothing, and it is instantly ‘telegraphed’ across the denial-o-sphere while being embellished along the way to apply to anything ‘hockey-stick’ shaped and any and all scientists, even those not even tangentially related. The usual suspects become hysterical with glee that finally the ‘hoax’ has been revealed and congratulations are handed out all round. After a while it is clear that no scientific edifice has collapsed and the search goes on for the ‘real’ problem which is no doubt just waiting to be found. Every so often the story pops up again because some columnist or blogger doesn’t want to, or care to, do their homework. Net effect on lay people? Confusion. Net effect on science? Zip.

Having said that, it does appear that McIntyre did not directly instigate any of the ludicrous extrapolations of his supposed findings highlighted above, though he clearly set the ball rolling. No doubt he has written to the National Review and the Telegraph and Anthony Watts to clarify their mistakes and we’re confident that the corrections will appear any day now…. Oh yes.

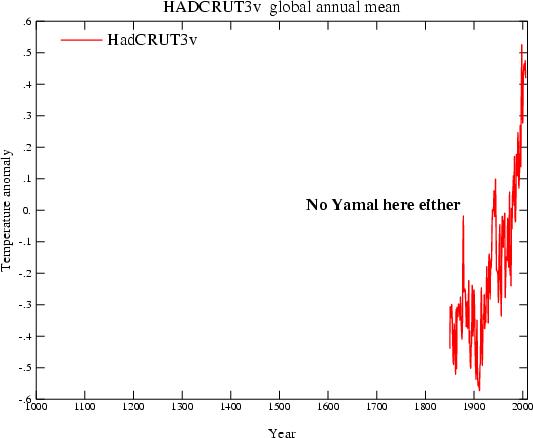
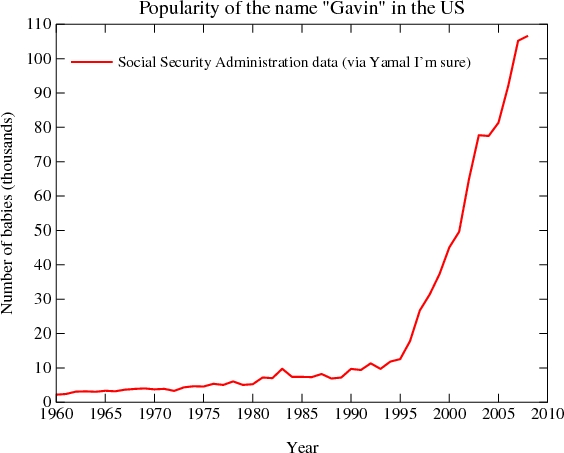
But can it be true that all Hockey Sticks are made in Siberia? A RealClimate exclusive investigation follows:
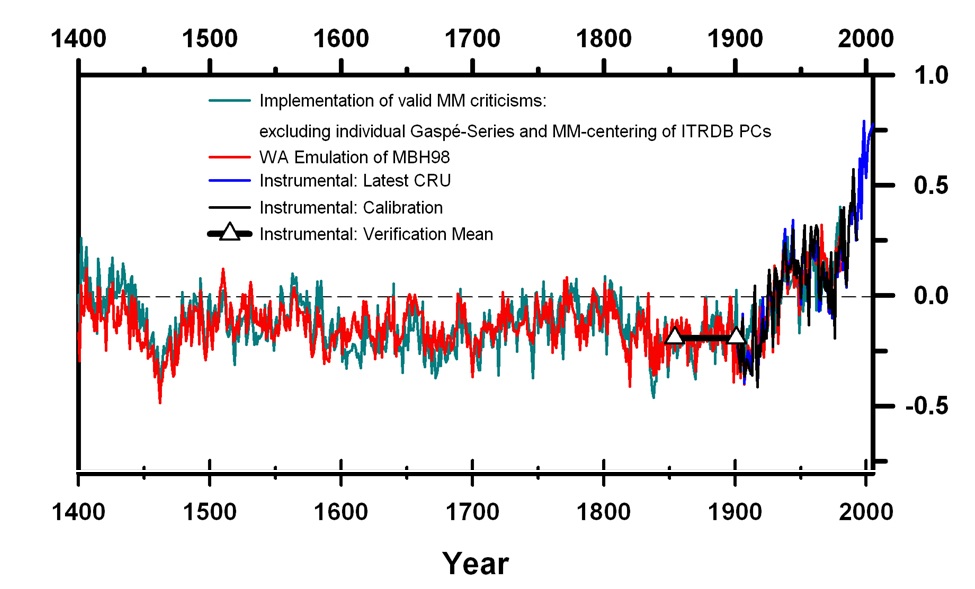
We start with the original MBH hockey stick as replicated by Wahl and Ammann:

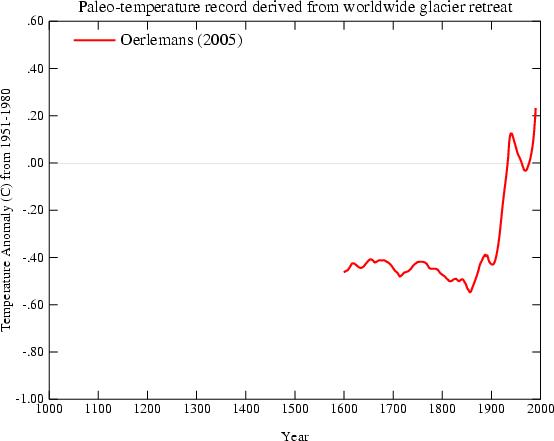
Hmmm… neither of the Yamal chronologies anywhere in there. And what about the hockey stick that Oerlemans derived from glacier retreat since 1600?

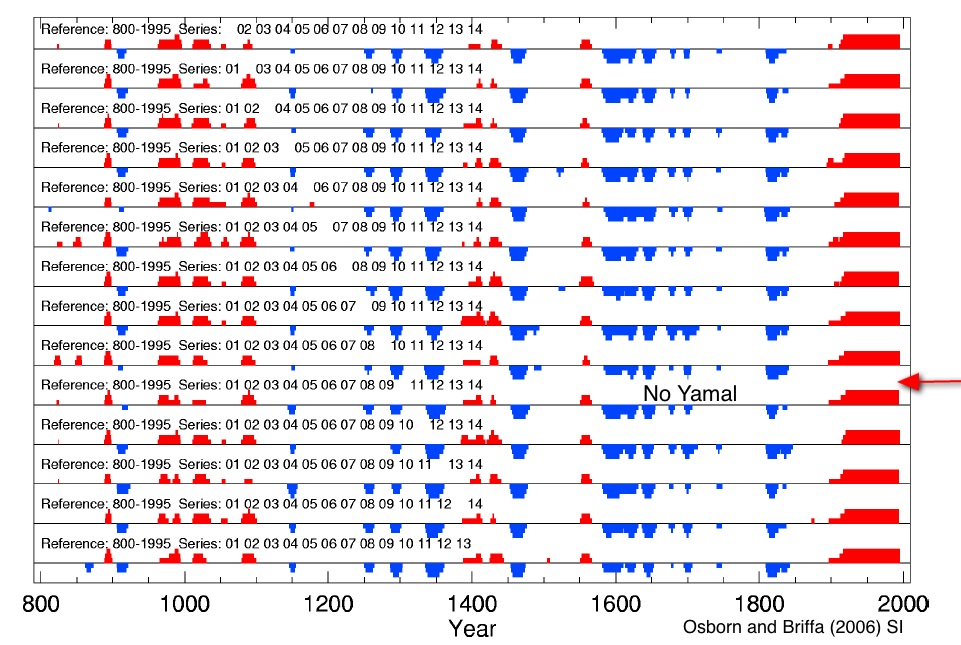
Nope, no Yamal record in there either. How about Osborn and Briffa’s results which were robust even when you removed any three of the records?
Osborn and Briffa (2006) Supplemental Material
Or there. The hockey stick from borehole temperature reconstructions perhaps?

No. How about the hockey stick of CO2 concentrations from ice cores and direct measurements?

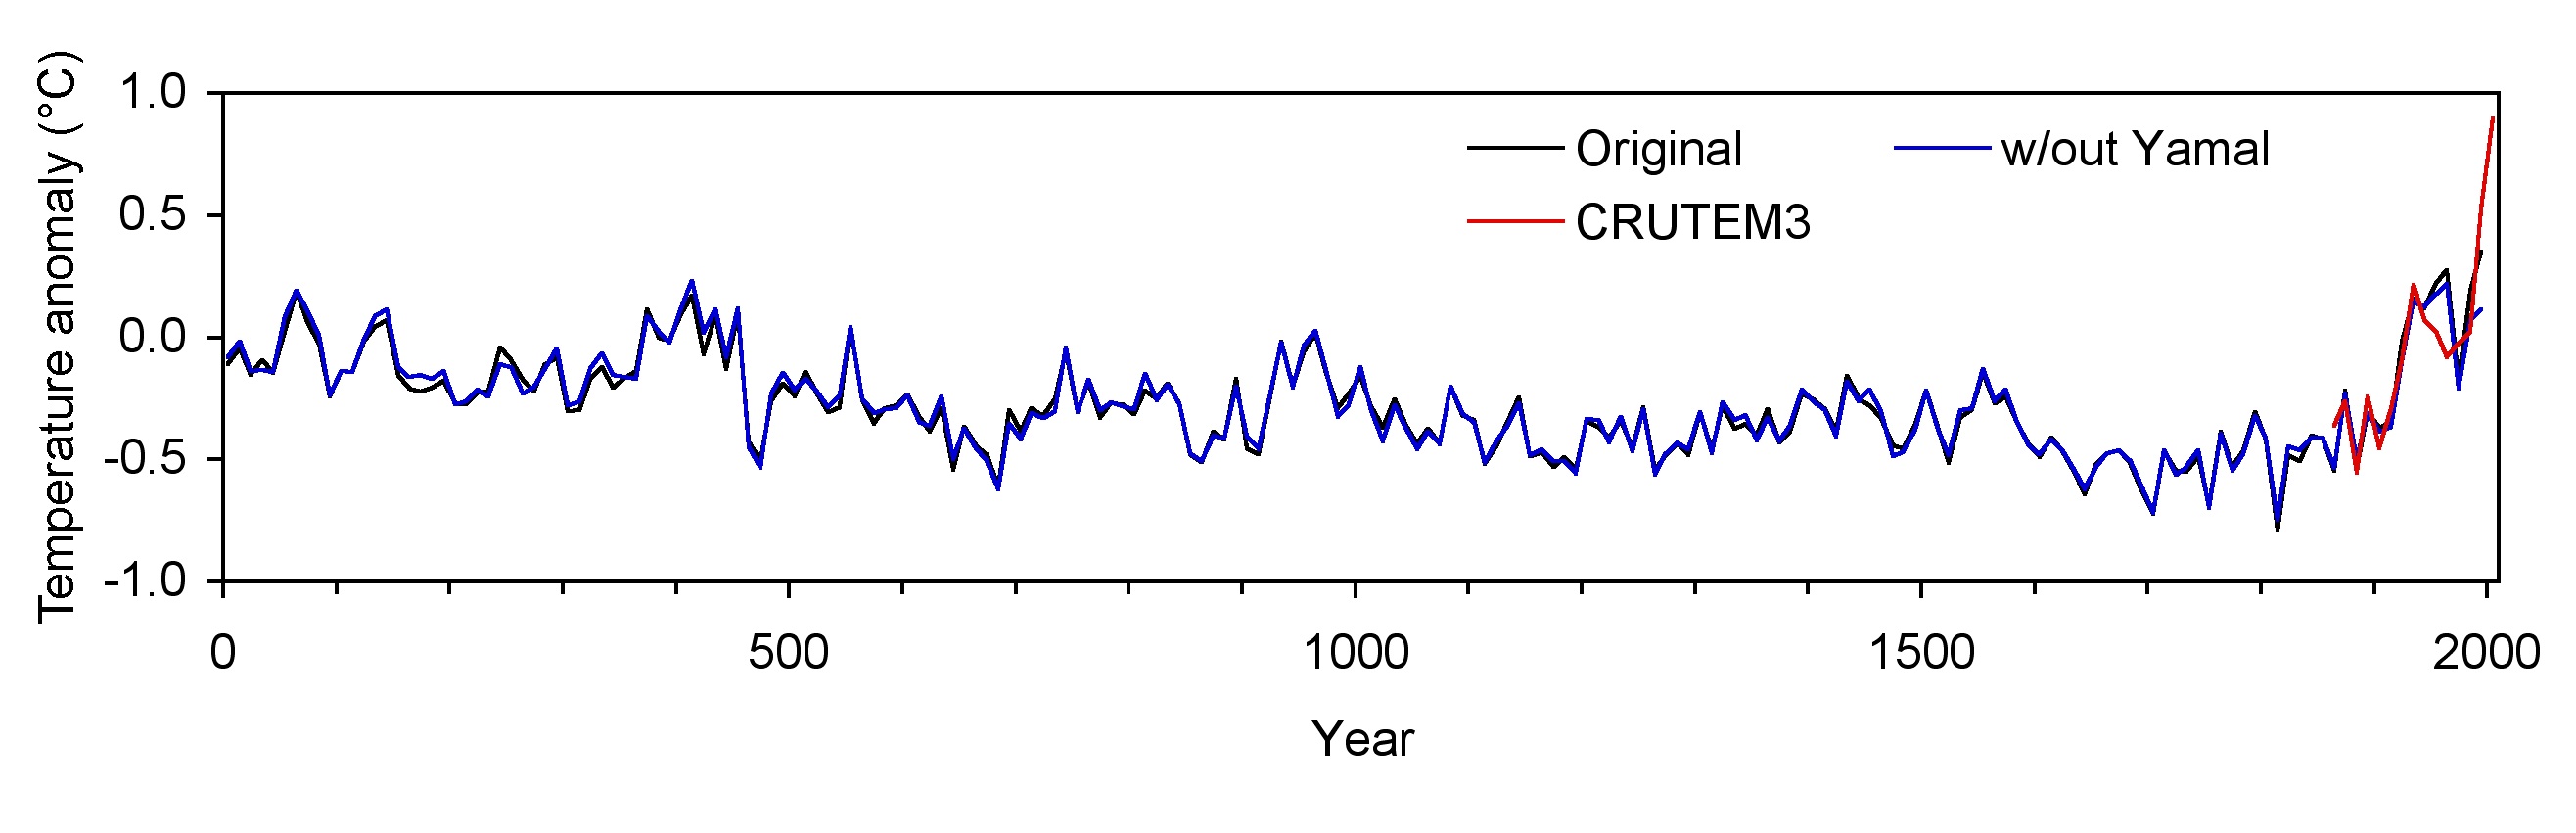
Err… not even close. What about the the impact on the Kaufman et al 2009 Arctic reconstruction when you take out Yamal?

Oh. The hockey stick you get when you don’t use tree-rings at all (blue curve)?
M08
No. Well what about the hockey stick blade from the instrumental record itself?

And again, no. But wait, maybe there is something (Update: Original idea by Lucia)….

Nah….

One would think that some things go without saying, but apparently people still get a key issue wrong so let us be extremely clear. Science is made up of people challenging assumptions and other peoples’ results with the overall desire of getting closer to the ‘truth’. There is nothing wrong with people putting together new chronologies of tree rings or testing the robustness of previous results to updated data or new methodologies. Or even thinking about what would happen if it was all wrong. What is objectionable is the conflation of technical criticism with unsupported, unjustified and unverified accusations of scientific misconduct. Steve McIntyre keeps insisting that he should be treated like a professional. But how professional is it to continue to slander scientists with vague insinuations and spin made-up tales of perfidy out of the whole cloth instead of submitting his work for peer-review? He continues to take absolutely no responsibility for the ridiculous fantasies and exaggerations that his supporters broadcast, apparently being happy to bask in their acclaim rather than correct any of the misrepresentations he has engendered. If he wants to make a change, he has a clear choice; to continue to play Don Quixote for the peanut gallery or to produce something constructive that is actually worthy of publication.

Peer-review is nothing sinister and not part of some global conspiracy, but instead it is the process by which people are forced to match their rhetoric to their actual results. You can’t generally get away with imprecise suggestions that something might matter for the bigger picture without actually showing that it does. It does matter whether something ‘matters’, otherwise you might as well be correcting spelling mistakes for all the impact it will have.

So go on Steve, surprise us.

Link:   http://www.realclimate.org/index.php/archives/2009/09/hey-ya-mal/

Peak Ice: The Dance of the Ice Sheets

Peak Ice: The Dance of the Ice Sheets


For a long time, the conventional wisdom was that the maximum extent of glaciers during the last ice age was reached in about 16,000 BC. Then it was realized that better calibration of the rate of production of carbon-14, the main radioactive clock we have for that period, required that the date of the maximum be pushed back to 19,000 BC. Now Peter Clark and colleagues, writing in a recent issue of Science, provide further clarity. They show that the maximum extent of the ice lasted from about 24,500 to about 17,000 BC.
Plants and animals don’t grow underneath ice sheets, so datable evidence for them means no ice at the site of observation. Assemble several thousand of these dates and you get a picture of the changing extent of the ice sheets. The picture is sharper for some ice sheets than for others, but cumulatively the evidence for several thousand years of near-stability is fairly impressive.

It contrasts with some other guides to the palaeoclimate. Oxygen isotopes in ocean-floor microfossils are a guide (unfortunately) to two variables: sea level (or the volume of the ice sheets, which amounts to the same thing) and water temperature. The heavier of the two common isotopes of oxygen tends to stay behind when molecules of liquid H2O evaporate from the ocean surface, so (a) if the light molecules accumulate in the ice sheets instead, the oceanic oxygen gets relatively heavier, but (b) this effect is less marked when it is warmer because now the heavier molecules evaporate more readily.

Disentangling these two controls on oxygen isotopes is a major challenge, but accepted pictures of deep-ocean temperature show a quite sharp minimum at about 17,000 BC. What Clark and colleagues have shown, in contrast, is that the ice volume was near to its maximum, equivalent to a sea level about 128 m lower than today’s, for several thousand years before that. This agrees with calculated variations of the solar radiation regime due to changes in the Earth’s orbit. The calculations are reliable, and show a broad minimum of Northern Hemisphere radiation centred near 20,000 BC. The concentration of atmospheric CO2 also varies only moderately, between 185 and 200 parts per million, during their suggested glacial-maximum span.
This is evidence that the climate can be stable in more than one state. On graphs which span tens or hundreds of thousands of years, the last ten thousand years, the Holocene, stand out as a time of little change. I am not saying that the climate has not changed during this time. We know, for example, that it was a bit warmer in its earlier than its later part, and the cool spell known as the Little Ice Age, which bottomed out about 1850 AD, is well documented. But the Holocene climate was much less variable than the irregularly cooling climate during the preceding hundred thousand years of the ice age. Now Clark and colleagues have shown that peak ice can be stable as well, in the sense of looking rather flat on a graph (but in a much cooler way). We would naturally like to know why.

Another interesting point is that different ice sheets reached their maxima at different dates. The big standout in this respect is West Antarctica, where the maximum was as late as 12-13,000 BC, but the big northern ice sheets, now long gone except for Greenland, had maxima up to a few thousand years apart, reminding me of the smaller glaciers during the Little Ice Age, which peaked as early as the late 17th century in some places and as late as the early 20th century in others. Evidently, as they paced through their stately dance, neither the Little Ice Age glaciers nor the ice-age ice sheets were much good at keeping in step.

Regional variations are therefore a fact of the global climate, about which it is nevertheless legitimate to make on-average statements. One implication is that we should not pay much attention to people who point out correctly that some parts of the world are not warming very much at the moment, but argue wrongly from this that global warming is a myth.

TrackBack URL for this entry:
http://www.iop.org/mt4/mt-tb.cgi/3411

Link:  http://environmentalresearchweb.org/blog/2009/09/peak-ice-the-dance-of-the-ice.html

Elizabeth Kolbert: Leading Causes

Leading Causes

by Elizabeth Kolbert, New Yorker, October 5, 2009

On October 13, 1992, the United States became the world’s first industrialized nation to ratify a treaty on climate change. The treaty committed its parties to the important, if awkwardly worded goal of preventing “dangerous anthropogenic interference with the climate system.” In acknowledgment of the fact that America and its allies were largely responsible for the problem, the pact set a different standard for them; Europe, Japan, Australia, and the United States were supposed to “take the lead in combating climate change and the adverse effects thereof.” Signing the instrument of ratification for the treaty, the United Nations Framework Convention on Climate Change, President George H. W. Bush noted the special responsibilities that the developed nations were taking on; they “must go further” than the others, he said, and offer detailed “programs and measures they will undertake to limit greenhouse emissions.”

The convention remains in effect, and for the past seventeen years the United States has insisted that it is living up to its terms. Under Bill Clinton, this claim was implausible; the U.S. took no meaningful action to reduce its emissions. Under George W. Bush, it became a bad joke. (When the Bush Administration wasn’t handing out tax breaks to fossil-fuel companies, it was muzzling climate scientists and storming out of international negotiations.) The election of Barack Obama seemed in this, as in so many other areas, to offer a fresh start. A few weeks after his victory, Obama vowed to open a “new chapter” on climate change. And yet, almost a year later, the United States is again—or, really, still—stuck in the same old pattern. We keep saying that we want to be marching at the front of the parade, and then hanging back with the tubas.

Last week at the United Nations, at what was billed as the highest-level meeting on climate change ever, there was general agreement about the approaching disaster. Secretary-General Ban Ki-moon warned that rising temperatures would “increase pressure on water, food, and land; reverse years of development gains; exacerbate poverty; destabilize fragile states; and topple governments.” President Oscar Arias Sánchez, of Costa Rica, described the session as taking place “on the brink of a precipice for our planet.” President Nicolas Sarkozy, of France, stated, “We are the very last generation that can take action.”

“If things go business as usual, we will not live,” President Mohamed Nasheed, of the low-lying Maldives, told the assembled delegates. “We will die. Our country will not exist.”

President Obama, too, was apocalyptic. “We risk consigning future generations to an irreversible catastrophe,” he said in the first of three U.N. addresses. He went on to list the various steps that his Administration has taken—setting new automobile-efficiency standards, investing billions of dollars in weatherizing homes and office buildings, establishing reporting rules for the nation’s largest greenhouse-gas emitters. “The developed nations that caused much of the damage to our climate over the last century still have a responsibility to lead,” he said, before adding, unconvincingly, “And we will continue to do so.”

What would it take for the United States actually to show leadership, instead of just talking about it? First, it would have to impose binding emissions limits of the sort that it has spent the last two decades evading. The Europeans, who are already operating under such constraints, have pledged to cut their emissions by 20% by 2020, and have said that they would agree to a 30% cut if other nations followed suit.

The new Japanese Prime Minister, Yukio Hatoyama, has committed his country to cutting its emissions by twenty-five per cent. In the United States, a bill that would reduce emissions by seventeen per cent narrowly passed the House in June, only to become bogged down in the Senate; it is unclear if the bill will reach the Senate floor this year, or, if so, whether it has the votes to pass. (The United States is using a baseline year of 2005, while the Europeans and the Japanese are using 1990, which means that the proposed American cuts are significantly more modest than they sound.)

There is no reason to doubt Obama’s sincerity about climate change. In addition to the actions he mentioned at the U.N., his Administration has, most significantly, classified carbon dioxide as a pollutant, a move that could eventually lead to its regulation under the Clean Air Act. And the President is clearly frustrated by the stalemate in the Senate. But at this late date sincerity is not enough. When the President proposed that Congress take up a climate bill along with health-care legislation and, on top of that, regulatory reform, he made an enormous gamble. This gamble, at some point, could have been called bold; increasingly, it just seems naïve.


For the world to avoid “dangerous anthropogenic interference,” the United States is, finally, going to have to live up to the commitments it made under the Framework Convention. And, in order for this to happen, Obama is going to have to move climate change to the top of his agenda—quickly. As the President himself put it last week, “The time we have to reverse this tide is running out.”

Link:  http://www.newyorker.com/talk/comment/2009/10/05/091005taco_talk_kolbert

Auroop Ganguly: Globally averaged intensity of heat waves calculated from observations is higher and shows a more increasing trend compared to even the worst case projections from climate models

Temperatures go to extremes

by Liz Kalaugher, environmentalresearchweb, September 24, 2009

The average severity, length and number of heat waves are set to increase this century, according to analysis by US researchers. What's more, temperatures, uncertainty and geographic variability will all be higher than predicted by climate models.
 
"Over the current decade (specifically, for eight years from 2000 to 2007), the globally-averaged intensity of heat waves calculated from observations is higher and shows a more increasing trend compared to even the worst case projections from climate models," said Auroop Ganguly of Oak Ridge National Laboratory, US. "Increased trends point to the urgency of international and domestic policy negotiations for reducing emissions."

Ganguly and colleagues at Oak Ridge, the University of Notre Dame, and the US National Center for Atmospheric Research used ensemble simulations from a global earth systems model to analyse bias and uncertainty. They compared this data with observations for 2000–2007.

"The larger uncertainties, both at global and regional scales, suggest that policymakers and stakeholders may face a more complex task to decide the various societal cost-benefit trade-offs during decisions on climate related mitigation and adaptation related spending," said Ganguly. "Uncertainty is not an excuse for inaction, but an opportunity for more cautious and risk-informed decisions."

On the one hand, says Ganguly, increased uncertainty may imply a worst-case where temperature extremes are much more severe and frequent that even the most dire projections. "This implies a need to plan accordingly for a much higher worst-case, for example where human lives may be involved (e.g., consider the human mortality from the Paris and Chicago heat waves)," he said. "On the other hand, the larger uncertainty may also imply that the temperature extremes may not be as severe or frequent as we thought from the mean projections."

Such considerations may help in deciding cost-benefit trade-offs in certain situations, for example, the uncertainties in a shift in water resources or agricultural patterns in the Western US may need to be taken into account during cost-benefit analysis of climate change risk-management approaches.

The team also found that although there is often an increase in the severity of heat waves when a region experiences warming, the occurrence or severity of heat waves does not necessarily correspond to the regions where the highest regional warming occurs. "This is counter-intuitive, but extreme events do not necessarily co-occur with large regional changes in climate," said Ganguly.

The researchers began their study following participation in a climate change war game in 2008, for which they prepared maps of temperature increases in the 21st century. "The lessons learned from the war game motivated us to look deeply into the uncertainty associated with the projections of climate change and extremes, especially at regional scales in space and decadal scales in time," said Ganguly.

Now the researchers plan to address the limitations in this study; analyse trends in extremes, regional change and uncertainties for variables such as precipitation and wind; generate predictive insights for the statistics of extremes such as tropical cyclones, wildfires, landslides, sea-level rise, sea ice, and land glacier melts, which can be inferred with varying uncertainties from ancillary climate models; and analyse the consequences of extreme hydrometeorological events or large regional shift in climate patterns using information about vulnerability from projections of population or economic growth.

The researchers reported their work in PNAS.

About the author

Liz Kalaugher is editor of environmentalresearchweb.

Link to article:  http://environmentalresearchweb.org/cws/article/research/40474

Stefan Rahmstorf, Pier Vellinga: No way to stop sea levels from rising

No way to stop sea levels from rising

by redorbit.com, 30 September 2009

At an Oxford University climate conference, experts announced that sea levels across the globe will almost inevitably rise more than 6 feet.

"The crux of the sea level issue is that it starts very slowly but once it gets going it is practically unstoppable," said Stefan Rahmstorf, a scientist at Germany's Potsdam Institute and a broadly respected sea level expert.
"There is no way I can see to stop this rise, even if we have gone to zero emissions."

According to Rahmstorf, the best outcome was that once temperatures finally adjust and become stable, sea levels would only rise steadily "for centuries to come," rather than gain momentum.

The majority of scientists anticipate at least a 2 degrees Celsius jump in temperatures because of man-made greenhouse gas emissions, if not more. Just this last century, the world has warmed by 0.7-0.8 degrees, reported Reuters.

Rahmstorf surmises that even if the world were to limit warming to 1.5 degrees, there would still be over a six-foot rise in sea levels over centuries, which would swallow some island nations.

His best estimate projects that there will be over a three-foot rise in sea levels this century, assuming it warms three degrees, and up to over sixteen meters over the next three centuries.

"There is nothing we can do to stop this unless we manage to cool the planet. That would require extracting the carbon dioxide from the atmosphere. There is no way of doing this on the sufficient scale known today," he said.

Scientists have explained that ice melting takes on a momentum of its own. For example, when there is less ice to reflect heat, the air becomes warmer and warms the surrounding areas, which in turn causes more ice to melt.

"Once the ice is on the move, it's like a tipping point which reinforces itself," said Wageningen University's Pier Vellinga, citing various research.

"Even if you reduce all the emissions in the world once this has started it may be unstoppable. I conclude that beyond 2 degrees global average temperature rise the probability of the Greenland ice sheet disintegrating is 50 percent or more."

"(That) will result in about 7 meters sea level rise, and the time frame is about 300-1,000 years."

Bangkok will host delegates from about 190 nations in an effort to speed up negotiations led by the U.N. to replace the Kyoto Protocol with a more stringent climate treaty.

The speakers in Oxford cited points in history to fortify their claims about rising sea levels. Three million years ago the planet was 2-3 degrees warmer and the sea 25-35 meters higher, and 122,000 years ago 2 degrees warmer and 10 meters higher, they said.

"What we now see in Greenland, Antarctica could be a temporary phenomena but it could also be the start of what we saw 122,000 years ago," said Vellinga.

The past century has seen seal levels rise almost eight inches and that effect was accelerating, speakers noted.
This rise was building on storms such as those found in the Philippines, although there is not enough proof to blame that single event on climate change, said Rahmstorf.

"Of course the flooding from a given storm event would be less severe if we hadn't added those extra centimeters."

Approximately 40 million people across the world currently reside in flood plains, said Southampton University's Robert Nicholls. That amounts to 0.6 percent of the global population and 5 percent of global wealth, because of valuable assets such as airports and power plants.

Rahmstorf expressed confidence that coastal protection could significantly reduce lost land and assets. Speakers estimated the cost of that to be anywhere from $72.85 billion per year by 2020 to up to $215 billion a year by 2100.

Link:  http://www.redorbit.com/news/science/1761731/no_way_to_stop_sea_levels_from_rising/index.html  

NewScientist: No rainforest, no monsoon: Get ready for a warmer world

No rainforest, no monsoon: Get ready for a warmer world

by Shanta Barley , Nigel Hawtin , Catherine Brahic and Tom Simonite, New Scientist, September 30, 2009

The average global temperature is likely to be 4 °C higher than in pre-industrial times by 2055 if greenhouse gas emissions are not slowed – that means a 16 °C rise in the Arctic (Source: Met Office Hadley Centre)
The average global temperature is likely to be 4 °C higher than in pre-industrial times by 2055 if greenhouse gas emissions are not slowed – that means a 16 °C rise in the Arctic (source: Met Office Hadley Centre).


By 2055, climate change is likely to have warmed the world by a dangerous 4 °C unless we stop pumping greenhouse gases into the atmosphere the way we do now. This is the startling conclusion of a study by the UK Met Office, unveiled at a conference in Oxford this week.

Why so soon? Because temperature rises caused by greenhouse gas emissions are expected to trigger dangerous feedback loops, which will release ever increasing amounts of greenhouse gases. The nature and scale of these feedback loops is a subject of vigorous debate among climate scientists, but warmer oceans, for instance, may liberate more dissolved CO2, and plants may decay faster in a warmer climate. The Met Office ran 17 different models with these feedbacks. All concluded a 4 °C world by 2055 was likely if emissions continue to rise. Even if we are lucky, we are still likely to hit 4 °C by 2070.

What will a 4 °C world look like? Brace yourself: the picture painted by the 130 climate researchers at the Oxford conference is not pretty. An average global increase of 4 °C translates to a rise of up to 15 °C at the North Pole. Summers in parts of the Arctic would be as balmy as California's Napa valley. Sea levels would rise by up to 1.4 metres, according to Stefan Rahmstorf at the Potsdam Institute for Climate Impact Research, Germany. Even the less pessimistic estimate of a 0.65-metre rise by 2100 would put at least 190 million people a year at risk from floods, says Rahmstorf's colleague Jochen Hinkel.

The glimmer of hope? It doesn't have to be this way. If politicians at the UN climate change talks in December agree to cut emissions by 3 per cent every year, the world can limit temperature rise to a "safe" 2 °C, the Met Office says.

The Amazon - gone

In a 4 °C world, climate change, deforestation and fires spreading from degraded land into pristine forest will conspire to destroy over 83 per cent of the Amazon rainforest by 2100, according to climatologist Wolfgang Cramer at the Potsdam Institute for Climate Impact Research in Germany. His climate models show global warming alone converting 30 per cent of the Amazon into degraded shrub land and mixed woodland by 2100. Even this grim estimate is based on the hopeful assumption that extra CO2 in the atmosphere will "fertilise" the forest, buffering it from drought. But we can't be sure this will happen, says Cramer. "If we've overestimated the magnitude of CO2 fertilisation, we risk losing the entire Amazon."

Water lifeline cut

Millions of people in India and China depend on monsoon rains to water their crops and for drinking water. Climate change could sever this lifeline. Anders Levermann at Potsdam University in Germany has developed a model which reflects the physics that drives monsoons. His simulations suggest that in a 4 °C world there will be a mix of extremely wet monsoon seasons and extremely dry ones, making it hard for farmers to plan what to grow. Worse, the fine aerosol particles released into the atmosphere by burning fossil fuels could put a complete stop to the monsoon rains in central southern China and northern India. Monsoons are generated by sharp heat gradients in the atmosphere where warm land meets cool ocean. By blocking solar energy, aerosols cool the coastal atmosphere and sap monsoons' strength.

Trapped!

Lack of water, crop failure and rising sea levels could force up to 200 million people from their homes by 2050. Attention in rich western nations has focused on the prospect of millions of climate migrants clamouring at their borders. The reality is likely to be harsher, says François Gemenne, a migration expert at the Institute of Sustainable Development and International Relations in Paris, France. From a study of the impact of 23 recent environmental disasters he concludes that the people most vulnerable to a 4 °C rise are also least able to escape it. "At 4 °C, the poor will struggle to survive, let alone escape," he says. Invariably, the poor can't afford to flee, and they lack the social networks which would otherwise facilitate migration, Gemenne says.
Climate change is already forcing people to migrate, says Gemenne. Sea level rise is driving an exodus from Tuvalu, Kiribati, Papua New Guinea and the low-lying Carteret Islands, while water stress is forcing people in Mauritania, Sudan, Ghana and Kenya to migrate. Melting permafrost is pushing people out of parts of Alaska and floods are forcing others out of the delta regions of Bangladesh and Vietnam.

Gemenne's research, conducted in conjunction with the EU Commission's EACH-FOR project, will be published in the Journal of International Migration next year.

Fire down under

Projections for Australia present a conundrum. It looks likely to escape extreme temperatures rises of 10 °C or more seen elsewhere (see map, top right), but rainfall projections paint a more troubling picture. There was very little consensus between the different models run by the UK Met Office. More alarmingly, a study of the probability of forest fires suggests that the number of "extreme fire danger days" per year -- when uncontrollable fires are likely to break out as a result of low humidity, strong winds and high temperature -- will treble by 2050. "Even under a low warming scenario, the frequency rises by 10-50%," says David Karoly of the University of Melbourne, who reviewed a range of wildfire projections. "We are unleashing hell on Australia."

Night time artificial cloud experiment conducted to study noctilucent clouds

Night time artificial cloud experiment conducted to study noctilucent clouds

environmentalresearchweb, September 29, 2009

A rocket experiment that may shed light on the highest clouds in the Earth's atmosphere was conducted September 19 from NASA's Wallops Flight Facility in Virginia.

The Charged Aerosol Release Experiment (CARE) was conducted by the Naval Research Laboratory and the Department of Defense Space Test Program using a NASA four-stage Black Brant XII suborbital sounding rocket. Using ground based instruments and the STP/NRL STPSat-1 spacecraft, scientists are studying an artificial noctilucent cloud formed by the exhaust particles of the rocket's fourth stage at about 173 miles altitude.

Ground based cameras and radars were based at various observation stations along the Atlantic coast and in Bermuda. Because of the optical observations, the launch required clear skies not only at Wallops but also at the multiple observation stations.

The Spatial Heterodyne IMager for MEsospheric Radicals instrument on the STPSat-1 spacecraft will track the CARE dust cloud for days or even months. The SHIMMER instrument has previously viewed natural noctilucent clouds for the past two years. The CARE will be the first space viewing of an artificial noctilucent cloud.

Data collected during the experiment will provide insight into the formation, evolution, and properties of noctilucent clouds, which are typically observed naturally at high latitudes. In addition to the understanding of noctilucent clouds, scientists will use the experiment to validate and develop simulation models that predict the distribution of dust particles from rocket motors in the upper atmosphere.

Natural noctilucent clouds, also known as polar mesospheric clouds, are found in the upper atmosphere as spectacular displays that are most easily seen just after sunset. The clouds are the highest clouds in Earth's atmosphere, located in the mesosphere around 50 miles altitude.

They are normally too faint to be seen with the naked eye and are visible only when illuminated by sunlight from below the horizon while the Earth's surface is in darkness.

A team from government agencies and universities, led by the Naval Research Laboratory, is conducting the experiment. In addition to the Naval Research Laboratory, participants include the DoD STP, NASA, University of Michigan, Air Force Research Laboratory, Clemson University, Stanford University, University of Colorado, Penn State University and Massachusetts Institute of Technology/Haystack Observatory.

Source: US Naval Research Laboratory

Link to article:  http://environmentalresearchweb.org/cws/article/yournews/40548

Wednesday, September 30, 2009

The Greenland ice sheet is shrinking

The Greenland ice sheet is shrinking


Satellite readings show Greenland is losing large quantities of ice. The enormous ice cap constituting the inland ice is melting at an ever-increasing rate, and there is every indication that the inland ice is contributing to the rise in sea level of the oceans.

An enormous net loss

Scientists are monitoring developments using satellites, light aircraft and observations on the ice, and most agree that global warming is the cause of this melting.

At the heart of the problem is the fact that ice formation occurring on the inland ice as a result of winter snowfalls cannot compensate for the melting. In other words, there is a net loss of ice. Calculations by a Dano–US team of scientists show an annual volume loss of about 257 km³.

The average net loss of ice in 2080 will have reached 465 km³ – a loss of ice 80% greater than today, research scientists of the International Arctic Research Center, Fairbanks, Alaska, state to Ritzau.

The melting is accelerating

A specific example of the situation is that twice as much ice melted in 2007 as was the case just three years earlier. In general, the region where there is increased melting has grown considerably in recent years. The melting has mainly occurred in the southern part of the inland ice and at the edges of the ice up to 3 km in height.

Glaciers are calving sooner

Readings show that the periphery of the inland ice is accelerating outwards. Therefore, the glaciers are calving sooner and more violently than before, and enormous icebergs are forming.

At the same time, the fronts of the largest glaciers are receding. This is due to a rise in summer temperatures. Only very little additional heat would be required for the snow covering large areas to disappear. A temperature increase of 1 °C distributed evenly across the large ice cap is enough to melt a vertical metre of ice each year. In other words, this would require one additional metre of ice to form from winter snowfalls in order to prevent the glacier from receding.

Measuring the ice

In the past, it was incredibly expensive and difficult to collect accurate information on the melting of the inland ice. In recent years, however, advanced satellites have made it possible to gather very accurate data, and a GPS network, GNET, positioned along the edge of the inland ice will provide data for use in calculations. GNET, which will be completed in 2010, is being established as a collaborative venture involving research scientists from the US, Luxembourg and Denmark.

GEUS is leading an ongoing monitoring programme (Programme for Monitoring of the Greenland Ice Sheet (PROMICE)that combines readings from GPS stations with data from aircraft and satellites to equip scientists to calculate the combined mass loss of the inland ice on an annual basis.

Meltwater in the sea

The inland ice is releasing increasing amounts of fresh water into the North Atlantic, which has a major impact on global ocean currents. This could have inherent consequences for the global climate, but no one knows exactly how or to what extent.

Professor Dorte Dahl-Jensen of the Niels Bohr Institute at the University of Copenhagen believes sea levels may rise by almost 1 m by the year 2100. The IPCC, the UN Intergovernmental Panel on Climate Change, is of the opinion that the maximum rise in sea level this century will probably be around 59 cm.

In Dorte Dahl-Jensen's opinion, the Panel on Climate Change has underestimated the melting of the inland ice. The Panel has first and foremost calculated the effect of melted sea ice. She expects 30 cm to come from the melting of the ice on Greenland and 30 cm from melting in Antarctica. The rest will come from small glaciers, and as a consequence of the water in the sea expanding as it warms.

Link to article:  http://climategreenland.com/klimaforandringer/indlandsisen_skrumper/&new_language=1