When we see records being broken and unprecedented events such as this, the onus is on those who deny any connection to climate change to prove their case. Global warming has fundamentally altered the background conditions that give rise to all weather. In the strictest sense, all weather is now connected to climate change. Kevin Trenberth
HIT THE PAGE DOWN KEY TO SEE THE POSTS
Now at 8,800+ articles. HIT THE PAGE DOWN KEY TO SEE THE POSTS
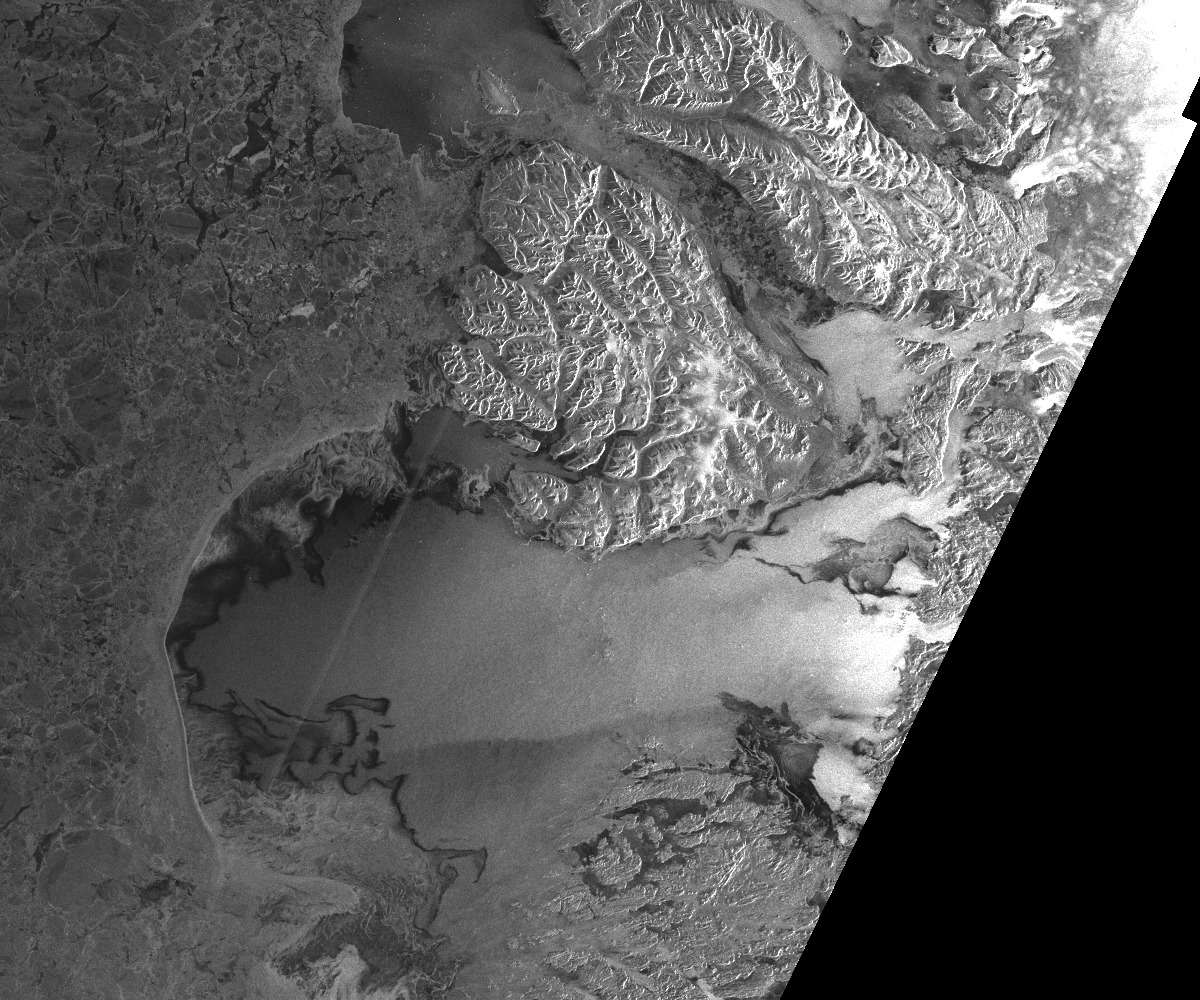
Possibly, there was some kind of subglacial lake collapse in the firn, or there was a major hill slide of ice, hard to say since there is still 24-hour darkness until the second week of March.
by Tim Radford, Climate News Network, January 9, 2016
LONDON – Water may be flowing from the Greenland icecap and into the sea more quickly than anybody expected.
It doesn’t mean that global warming has got conspicuously worse: rather, researchers have had to revise their understanding of the intricate physiology of the Northern Hemisphere’s biggest icecap.
There is enough ice and snow packed deep over 1.7 million square kilometres of Greenland that, were it all to melt, would cause a rise in global sea levels of about six metres.
Climate calculations
Since the icecap is melting as the atmospheric levels of the greenhouse gas carbon dioxide rise, and global temperatures rise with them, as a consequence of the human combustion of fossil fuels, the rate at which summer meltwater gets into the oceans becomes vital to climate calculations.
The latest rethink begins not with the pools of water that collect on the surface each summer, or the acceleration of the glaciers as they make their way to the ocean, but with a granular layer of snow just below the surface, called firn.
This is old snow in the process of being compacted into glacier ice, and covers the island in a layer up to 80 metres thick.
Until now, researchers have understood this firn layer as a kind of sponge that absorbs meltwater and holds it, thus limiting the flow of melting ice into the sea.
But a new study in Nature Climate Change by researchers from the US, Denmark and the University of Zurich suggests that earlier assumptions may be wrong.
“Meltwater couldn’t penetrate vertically through the solid ice layer, and instead drained along the ice sheet surface towards the ocean”
However, the findings are not definitive, and they deliver a picture more of science in progress, rather than any long-term conclusion.
To work out how much meltwater might be stored within the pores of the firn, the scientists set up camp in 2012, 2013 and 2015 on the ice cap to use radar and to drill a series of holes 20 metres deep into the porous firn layer − also choosing sites where samples had been taken 20 years ago.
The conclusion was that meltwater is being released faster than anticipated.
Horst Machguth, a research associate in the Department of Geography at the University of Zurich, says: “Basically, our research shows that the firn reacts fast to a changing climate. Its ability to limit mass loss of the ice sheet by retaining meltwater could be smaller than previously assumed.”
Storage capacity
An extreme melt in 2012 left a sheet of solid ice, several metres thick, on top of the porous firn, in some places.
“In subsequent years, meltwater couldn’t penetrate vertically through the solid ice layer, and instead drained along the ice sheet surface towards the ocean,” says William Colgan, assistant professor in the Department of Earth and Space Science and Engineering at York University in Toronto, Canada.
“It overturned the idea that the firn can behave as a nearly bottomless sponge to absorb meltwater. Instead, we found that the meltwater storage capacity in the firn could be capped off relatively quickly.”
The implication is that sea level rise from Greenland’s icecap is liable to be higher than predicted. Just how much higher is unknown, and the next step is to confirm the latest findings and incorporate the research so far into climate models.
Since detailed research in a hostile environment is always a challenge, any clear answer may take a few years more to emerge.
by Tim Radford, Climate News Network, January 8, 2016
LONDON – Climate change may have already begun to take its toll of agriculture. New research suggests that drought and extreme heat in the last 50 years have reduced cereal production by up to 10%. And, for once, developed nations may have sustained greater losses than developing nations.
Researchers have been warning for years that global warming as a consequence of rising levels of carbon dioxide in the atmosphere – in turn, a pay-off from increased fossil fuel combustion – will result in a greater frequency or intensity in extremes of weather.
They have also warned more recently that weather-related extremes could damage food security in Europe, Africa and India.
Global cost
But a study in Nature journal by Navin Ramankutty, professor in global food security and sustainability at the University of British Columbia in Canada, and colleagues is perhaps the first to identify the global cost of weather-related disasters in the last half of the 20th century.
The researchers looked at 2,800 extreme hydro-meteorological disasters – floods, droughts and extremes of heat and cold – reported between 1964 and 2007 from 177 countries, and matched the data with production figures for 16 cereal crops.
They could detect no significant influence from floods or ice storms, but they found that drought and extreme heat reduced average national cereal production by between 9% and 10%.
Drought reduced both cereal yield and the area under harvest, while heat mainly affected yield. This is likely to be a consequence of different timescales: droughts can last for years, but heatwaves tend to be counted in no more than weeks.
And the more developed nations reported harvest reductions from 8% to 11% more than the poorer societies. In Australia, North America and Europe, harvest levels dropped by an average of 19.9% because of drought − roughly double the global average.
Significantly, the more recent droughts had a far larger effect on cereal production than the earlier droughts, the implication being that such extreme events are on the increase. [Actually, the implication is that the droughts are more intense.]
Research such as this depends on clever statistical approaches and vast volumes of data − much of it from UN agencies such as the Food and Agriculture Organisation and the Emergency Events Database, which recently confirmed that extreme weather-related events are more frequent.
And, the researchers say, the hazards to harvests will continue, and continue to grow.
Climate projections
“Present climate projections suggest that extreme heat events will be increasingly common and severe in the future,” they report. “Droughts are likely to become more frequent in some regions, although considerable uncertainty persists in the projections.”
Professor Ramankutty says: “We have always known that extreme weather causes crop production losses. But until now we did not know exactly how much global production was lost to such extreme weather events, and how they varied by different regions of the world.”
His co-author, Corey Lesk, a geographer at McGill University in Montreal, Canada, says: “Across the breadbaskets of North America, for example, the crops and methods of farming are very uniform across huge areas, so if a drought hits in a way that is damaging to those crops, they will all suffer.
“By contrast, in much of the developing world, the cropping systems are a patchwork of small fields with diverse crops. If a drought hits, some of those crops may be damaged, but others may survive.”
Tornadoes, floods, and a heat wave at the North Pole
The aftermath of a tornado in Rowlett, Texas, on Dec. 27, 2015.
Photo by Laura Buckman/AFP/Getty Images
by Eric Holthaus, Slate, December 30, 2015
This year’s holiday season has been full of extreme weather, with weird anomalies from coast to coast—like a script worthy of a Syfy network movie.
The week of Christmas was the warmest on record by far for a vast stretch of the eastern United States from Texas to Maine. In Philadelphia, every single day this month has been warmer than normal—if that word even retains meaning during a month like this.
While this month’s extreme weather is primarily due to an atmosphere supercharged by the record-breaking El Niño, it’s also an example of the kind of unnerving meteorological event that’s becoming more likely as climate change plays an increasingly large role in daily weather. The New York Timescalled it “a fitting end to the warmest year on record.” Together, El Niño and climate change have combined for a year unlike any other in human history—a harbinger of an altered planet.
Over the past several days, an alarming string of tornadoes has left dozens dead across the South. At least 68 tornadoes were reported in 15 states from California to the Carolinas from Dec. 21 to Monday, the longest streak on record of December days with a tornado. December tornadoes are twice as common during El Niño years, but this weekend’s atmosphere over the South was something different entirely: By some measures, it was the most moisture-laden ever seen during the winter months.
One tornado in northern Mississippi on Wednesday was so strong it ripped the carpet off the floor after destroying a home. A series of tornadoes also struck Northern Texas the day after Christmas, many at night, creating horrific devastation. The worst one seems to have occurred in Garland, Texas; it was the deadliest tornado in the Dallas area—for any month—in nearly 90 years. Meteorologist Bob Henson notes that 2015 is the first year since 1875, when records began, that there have been more tornado-related deaths in December than in the entire rest of the year combined.
On its western and northern fringes, the storm brought snow, the worst of which struck New Mexico. There, Gov. Susana Martinez activated the state’s National Guard and said the historic snowstorm had created a “dire situation.” In fact, at the exact same time that tornadoes were bearing down on Dallas, a record-setting blizzard was burying cars under snowdrifts 10 feet deep on the western side of Texas. Snow fell as far south as northern Mexico. The system also helped bring record-breaking freezing weather to southern California, a fierce ice storm to Chicago and Michigan, and the first significant New England snowfall of the season—just two days after temperatures climbed into the 70s as far north as Vermont. TheWall Street Journalcalled the juxtaposition of weather extremes “freakish.”
El Niño has driven the show when it comes to this year’s extreme weather, and there are signs its influence on the atmosphere will only grow over the coming weeks and months. In the United Kingdom, recent record rains have caused flooding that’s prompted a political firestorm as the country struggles with the aftermath. In South America, the worst flooding in 50 years has hit parts of Paraguay, Argentina, Brazil, and Uruguay. Meanwhile, drought and famine threaten Ethiopia, and Australia has suffered a record-setting heat wave. Earlier this year, a prolonged drought in Indonesia sparked a nightmare of forest fires that blanketed the region in smoke.
Taken together, the fires, floods, heat waves, tornadoes, and blizzards are surely strange, even unsettling—but the scariest weather of the year is still on the way.
As it departs North America this week, the storm will rapidly intensify over the northern reaches of the Gulf Stream and draw tremendous amounts of warm air northward from Spain and the Mediterranean Sea toward the Arctic. As the storm approaches Iceland, it will have strengthened to the equivalent of some of the strongest hurricanes ever recorded in terms of atmospheric pressure. Intensely high pressure over western Russia, perhaps boosted by melting sea ice, will aid in setting up the tropics-to-pole atmospheric superhighway.
Unlike other recent episodes of extreme weather around the planet, this storm is probably not related to El Niño, which has limited influence in Europe. The storm will be strengthening over the exact spot that North Atlantic temperatures have been cooling over recent years, an effect that scientists have linked to a slowdown of the basin’s circulation triggered in part by melting sea ice—the same scenario that was highly dramatized in the movie The Day After Tomorrow. This year, there’s been a notable increase in the sharp contrast between this cold patch and record warm ocean temperatures in the tropical Atlantic, an effect that leads to stronger ocean storms—like this one.
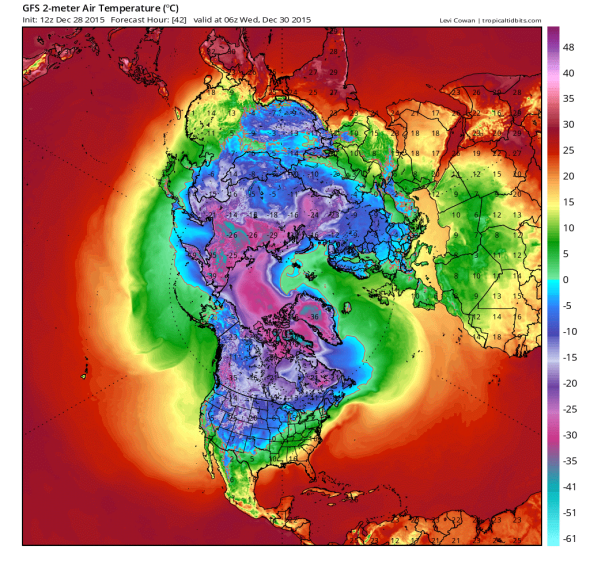
The remarkable storm will briefly boost temperatures in the Arctic basin to nearly 10 degrees Fahrenheit warmer than normal—and the North Pole itself will be pushed above the freezing point, with temperatures perhaps as warm as 40 degrees. That’s absolutely terrifying and incredibly rare. Keep in mind: It’s late December and dark 24 hours a day at the North Pole right now. The typical average high temperature this time of year at the North Pole is about minus 15 to minus 20 degrees. To create temperatures warm enough to melt ice to exist in the dead of winter—some 50 or 60 degrees warmer than normal—is unthinkable.
For some perspective, I contacted a team of climate scientists at the University of Washington who maintain a fleet of weather monitoring equipment near the North Pole. James Morison, the principal investigator of the North Pole Environmental Observatory, said he’s “never heard of” temperatures above freezing in the wintertime there. Looking closer at the weather data, it appears this event is in fact unprecedented during the time period from late December through late April.
On Wednesday, the North Pole will be warmer than Western Texas, Southern California, and parts of the Sahara.
A weather forecast for Wednesday morning shows a rare midwinter warm front over the North Pole, with temperatures a few degrees above freezing—about 50 or 60 degrees warmer than normal for late December.
GFS model courtesy of Levi Cowan
This, more than any other extreme weather event in a remarkable year for the climate, feels like something new. This midwinter melt at the North Pole is a preview of what’s to come later this century—in fact, the temperature anomalies match almost exactly with what is predicted. The long-feared worst-case climate change scenario, which, thankfully was made less likely by the Paris agreement earlier this month, projects an ice-free Arctic within decades. Storms like this week’s are exactly the type of events that do the dirty work of ushering in that world. In the meantime, we’re running on the knife’s edge as a civilization, dodging warning signs and hoping for a planetary miracle.
by Kevin Trenberth, The Conversation, January 4, 2016
A major El Niño is under way now. It already has substantially influenced weather patterns around the globe, but could have even bigger impacts this winter. There have been only two “super” El Niños until now: in 1982-83 and 1997-98. We are now experiencing a third “super” El Niño.
Every El Niño cycle is different. The effects from this year’s already include a record number of hurricanes/typhoons in the Pacific and intense wildfires in Indonesia.
In the United States over the next several months, El Niño is expected to cause heavy rains across the South, with the potential for coastal flooding in California, along with relatively mild and dry weather in the northern states. Global climate change, which, along with the El Niño, is making 2015 the warmest year on record, is likely to amplify these impacts.
What is El Niño?
El Niños are not uncommon. Every three to seven years or so, the surface waters of the tropical Pacific Ocean become extremely warm from the International Dateline to the west coast of South America. This process causes changes in the local and regional ecology, and is clearly linked with abnormal global climate patterns.
The Oceanic Niño Index (ONI) shows warm (red) and cold (blue) phases of abnormal sea surface temperatures in the tropical Pacific Ocean.NCAR,Author provided
Historically “El Niño” referred to the appearance of unusually warm water off the coast of Peru near Christmastime (Niño is Spanish and refers to “the boy Christ child”). Today it describes broader changes that occur across the Pacific basin.
Oceanic and atmospheric conditions in the tropical Pacific fluctuate somewhat irregularly between warm El Niño phases and cold phases in which surface waters cool across the tropical Pacific. These cooling events are called “La Niña” (“the girl” in Spanish). The most intense phase of each event typically lasts about a year.
El Niño is linked to major changes in the atmosphere known as the Southern Oscillation(SO). Scientists call the whole phenomenon the El Niño–Southern Oscillation (ENSO). During El Niño, higher-than-normal surface air pressures develop over Australia, Indonesia, Southeast Asia and the Philippines, producing drier conditions or even droughts. Dry conditions also prevail in Hawaii, parts of Africa, and northeastern Brazil and Colombia.
Lower pressures develop over the central and eastern Pacific, along the west coast of South America, parts of South America near Uruguay and southern parts of the United States in winter, often producing heavy rains and flooding. Regions that are typically dry during El Niño events tend to become excessively wet during La Nina events, and vice versa.
Flooding in Clear Lake, California, March 1 1998, during the 1997-1998 ‘super’ El Niño event.Dave Gatley/FEMA
Why does El Niño happen?
ENSO is a natural phenomenon arising from coupled interactions between the atmosphere and the ocean in the tropical Pacific Ocean. Changing sea surface temperatures alter rainfall and surface winds, which in turn alter ocean currents and sea surface temperatures. These interactions produce a positive feedback loop, in which each change tends to promote further changes. There is good evidence from core samples taken from coral reefs and glacial ice in the Andes that ENSO has been going on for millennia.
During El Niño, trade winds that typically blow from east to west across the Pacific weaken. Sea level falls in the western Pacific and rises in the east by as much as a foot as warm waters surge eastward along the equator. The resulting increase in sea temperatures warms and moistens the overlying air. This triggers a process called convection: the warm, moist air rises into the atmosphere, altering normal rainfall patterns and associated releases of heat.
Somewhat like a rock sitting in a stream of water, this unusual heating sets up teleconnections: continental-scale waves in the atmosphere that extend into the midlatitudes in winter. These waves alter winds and change the jet stream and storm tracks, creating persistent weather patterns. The changes in sea surface temperatures associated with El Niño reach their most extreme point during winter in the Northern Hemisphere, so we see the biggest effects then.
The 2015-16 El Niño event
Because Pacific surface waters are much warmer and atmospheric circulation patterns throughout the tropics are altered, fewer tropical storms and hurricanes than normal occur in the tropical Atlantic during El Niño. But there is much more activity than usual in the Pacific. Super Typhoon Pam, which ripped through Vanuatu in March 2015 causing enormous damage, was fueled by warm waters from El Niño.
During the northern Pacific hurricane season in the summer and fall of 2015, 25 category 4 and 5hurricanes/typhoons developed, a record as compared to the previous record of 18. Changed weather patterns resulted in lack of rain and thus strong drought and wildfires in Indonesia that have degraded air quality over hundreds of miles.
El Niño has recently affected the Indian Ocean. The Bay of Bengal is already exceptionally warm, which has led to record-breaking rains and widespread flooding and devastation in Chennai, southeastern India, with 47 inches of rain in November and a further 11 inches of rain in the first week of December. This Indian Ocean activity may disrupt the expected development of El Niño patterns around the world. El Niño-related heavy rains have also recently (December 2015) occurred in the Americas: in Paraguay and surrounding areas, and in Missouri. The latter has led to considerable flooding of the Mississippi, reminiscent of the El Niño-related Mississippi flooding in 1993.
Sea surface temperature anomalies from El Niño tend to peak in December, and this year the changes may already have peaked in late November. However, the seasonal cycle further increases total sea surface temperatures, so the biggest impacts on the atmosphere often occur in the following February or March. This El Niño began in 2014, but stalled, and then regrouped in 2015. Every El Niño event is different, but according to NOAA’s latest monthly outlook, El Niño conditions are expected to peak during the winter of 2015-16 before gradually weakening through spring 2016 and terminating by late spring or early summer 2016.
Sea surface temperature anomalies through early December during the ‘super’ El Niño in 1997 and the current El Niño.
During the coming months, climate scientists expect that El Niño will pull the east Pacific Northern Hemisphere jet stream and its associated storm track southward. Normally these storms veer to the north toward the Gulf of Alaska or enter North America near British Columbia and Washington, where they often link up with cold Arctic and Canadian air masses and bring them down into the United States. Instead, with the jet stream following an altered path, the northern states are likely to experience relatively mild and drier-than-normal weather. Storms tracking across the continent further to the south will likely create wet conditions in California and across the South as far east as Florida.
Each El Niño event has its own character. In the El Niño winters of 1992–93, 1994–95, 1997–98 and 2004-05, southern California was battered by storms and experienced flooding and coastal erosion. However, in more modest El Niños, including the 1986–87 and 1987–88 winters, California was more at risk from droughts. Given the scale of this year’s El Niño, Californians should prepare for heavy rains, possible flooding and heavy coastal erosion, driven by the combined effects of higher sea levels (driven by climate change and El Niño effects) and storm surges.
El Niño and global warming
All of the impacts of El Niño are exacerbated by global warming. Globally, temperatures for 2015 are the highest on record, in part because of the El Niño event. Global warming sets the background and El Niño determines regional weather patterns. When they work together in the same direction, they have the biggest effects and records are broken.
Changes associated with El Niño, including droughts, floods, heat waves and other changes, take a heavy toll in many parts of the world. They can severely disrupt agriculture, fisheries, the environment, health, energy demand and air quality, and increase the risks of wildfires. The risk of adverse effects and more frequent extremes or even records occurring is heightened by global climate change from human activities.
By better understanding El Niño, predictions and alerts can allow us to be prepared for possible unusual effects, but we can and should act to slow down climate change.
by Amy Lieberman and Susanne Rust, LA Times, December 31, 2015
A few weeks before seminal climate change talks in Kyoto back in 1997, Mobil Oil took out a bluntly worded advertisement in the New York Times and Washington Post.
“Let’s face it: The science of climate change is too uncertain to mandate a plan of action that could plunge economies into turmoil,” the ad said. “Scientists cannot predict with certainty if temperatures will increase, by how much and where changes will occur.”
One year earlier, though, engineers at Mobil Oil were concerned enough about climate change to design and build a collection of exploration and production facilities along the Nova Scotia coast that made structural allowances for rising temperatures and sea levels.
“An estimated rise in water level, due to global warming, of 0.5 meters may be assumed” for the 25-year life of the Sable gas field project, Mobil engineers wrote in their design specifications. The project, owned jointly by Mobil, Shell and Imperial Oil (a Canadian subsidiary of Exxon), went online in 1999; it is expected to close in 2017.
The United States has never ratified the 1997 Kyoto Protocol to reduce greenhouse emissions.
A joint investigation by the Columbia University Graduate School of Journalism’s Energy and Environmental Reporting Project and the Los Angeles Times earlier detailed how one company, Exxon, made a strategic decision in the late 1980s to publicly emphasize doubt and uncertainty regarding climate change science even as its internal research embraced the growing scientific consensus.
An examination of oil industry records and interviews with current and former executives shows that Exxon’s two-pronged strategy was widespread within the industry during the 1990s and early 2000s.
As many of the world’s major oil companies — including Exxon, Mobil and Shell — joined a multimillion-dollar industry effort to stave off new regulations to address climate change, they were quietly safeguarding billion-dollar infrastructure projects from rising sea levels, warming temperatures and increasing storm severity.
From the North Sea to the Canadian Arctic, the companies were raising the decks of offshore platforms, protecting pipelines from increasing coastal erosion, and designing helipads, pipelines and roads in a warming and buckling Arctic.
The industry contends that the difference between its public relations effort and its internal decision-making was not a contradiction, but a strategy to protect its business from misguided federal regulations while taking into account the possibility that the climate change predictions were valid.
“During planning and construction of major engineering and infrastructure projects, it is standard practice to take into account many types of risks both short-term and long-term, likely and unlikely,” said Alan Jeffers, a spokesman for Exxon Mobil, which merged in 1999. “These risks would naturally include a range of environmental conditions, some of which could be associated with climate change.”
The gas platform "Troll" is the world's largest concrete construction, standing 1,548.6 feet high. In this 1995 photo, a boat tows the platform from Stavanger in Western Norway to its position in the North Sea. (Associated Press)
By the late 1980s, calls by scientists and environmentalists to limit fossil fuel emissions were gaining traction. A growing scientific consensus was emerging, suggesting a link between climate change and carbon dioxide emissions, and a concern that those changes could cause global upheaval — from warming temperatures to rising sea levels and melting glaciers.
Governments across the globe took heed.
In 1988, Democratic Sen. Timothy Wirth of Colorado called a congressional hearing on the topic, and James Hansen, a NASA scientist, asserted “with 99% confidence” that global warming was occurring. That same year, the United Nations formed the Intergovernmental Panel on Climate Change to examine its future impact.
Facing a growing environmental and political movement, a collection of energy companies, primarily from the coal sector, created the Global Climate Coalition to fight impending climate change regulations.
The group approached the American Petroleum Institute for funding and support in the early 1990s.
William O’Keefe, executive vice president of the Petroleum Institute at the time, delivered. The major oil companies, he recalled, decided “something has to be done.”
By 1993, he was sitting on the board, and within a few years, he was chairman. He brought with him support from the trade group, as well as individual trade group members, including Exxon, Mobil, Shell and others.
For the next 10 years, the coalition, whose annual revenue peaked at about $1.5 million before Kyoto, spent heavily on lobbying and public relations campaigns. As part of the effort, it distributed a video to hundreds of journalists, the White House and several Middle Eastern oil-producing countries suggesting that higher levels of carbon dioxide in the atmosphere were beneficial for crop production, and could be the solution to world hunger.
The coalition’s campaign emphasized the uncertainty surrounding climate change science, and warned of dire economic consequences for consumers should regulations on the industry be enacted.
Two recent papers published in the journal Nature Climate Change and in the Proceedings of the National Academy of Sciences suggest that the coalition effort helped polarize public discourse on climate change.
“The ramifications of this multiyear effort by these funders are immensely important,” said Justin Farrell, a sociologist at Yale University and author of the studies, which looked at how the industry’s messaging affected the public debate. Their influence explains, he added, why the issue went from being bipartisan to polarizing.
O’Keefe said no one in the coalition denied the existence of global warming, but there was uncertainty about how well the models could project its future impact.
What coalition members felt certain about, he said, was that any government-mandated emission reductions would have “a clear negative impact,” including unemployment, higher energy prices and a drop in the U.S. standard of living.
When it came to their own investments, though, coalition members relied on scientific projections — from rising sea levels to thawing permafrost — to design and protect multibillion-dollar investments in pipelines, gas developments and offshore oil rigs.
O’Keefe, who is now chief executive of the George C. Marshall Institute, a conservative think tank that focuses on science and policy issues, contends that there was nothing inconsistent in the industry’s actions. “Companies always take into account a range of possible outcomes” before making billion-dollar investments, he said, and they didn’t “dismiss the potential of increased warming.”
Shell Oil announced in 1989 that it was raising its "Troll" North Sea natural gas platform a meter or two in anticipation of climbing sea levels caused by climate change. (Morten Hval / Associated Press)
In 1989, before Shell Oil joined the Global Climate Coalition, the company announced it was redesigning a $3-billion North Sea natural gas platform that it had been developing for years.
The reason it gave: Sea levels were going to rise as a result of global warming.
The original design called for the platform to sit 30 meters above the ocean’s surface, but the company decided to raise it by a meter or two.
The company’s then-chief offshore engineer, Chris Graham, said rising sea levels and increasing wave heights were “really showing” during the late 1980s and early 1990s, and the company was taking them seriously. A rash of storms and monster waves that had battered the North Atlantic and Gulf of Mexico during those years was particularly concerning, and engineers wondered whether climate change might be behind it.
“The tipoff to there being changes came from hurricanes,” said Bob Bea, another Shell offshore engineer at the time who also worked for the global engineering firm Bechtel. “Even back in those days ... hurricane intensities were changing.”
In 1994, representatives from the oil industry, insurance companies and several North American and European governments formed a quasi-governmental organization called Waves and Storms of the North Atlantic Group to determine whether climate change was behind the worsening weather.
The group concluded that if carbon dioxide levels continued to climb, there’d be “moderate increases of surges along the North Sea coast and of wave heights in the North Atlantic.”
That same year, industry engineers submitted a document to European authorities on the construction of the Europipe, a natural gas pipeline leading from a North Sea offshore platform to the German coastline, via the ecologically fragile Wadden Sea.
In it, the engineers noted that sea levels had risen over the last century, and suggested there could be a “considerable increase of the frequency of storms as a result of a climate change.” They concluded that although climate change was a “most uncertain parameter,” their pipeline designs should include protections against its impact.
The Europipe was jointly operated and owned by a group of companies, including Shell, Exxon, Conoco, Total and the biggest investor, Norway’s Statoil. They included climate change protections in their design specifications in part to convince German authorities to give them the go-ahead, according to Romke Bijker, a Dutch engineer who co-wrote the design specifications.
“We had to think at the time, what are the most important aspects we have to include if we look 50 years ahead,” he said.
By the mid-1990s, though, Shell had joined the Global Climate Coalition, and with its partners was publicly questioning the science behind climate change and casting doubt on its projected impact.
“There has been a great deal of speculation about a potential sea level rise,” the coalition said in a 1995 mission statement obtained by Greenpeace. But, the statement continued, “most scientists question the predictions of a dangerous melting of Greenland or Antarctic ice caps.”
In a section on the science of sea level projections, the document concluded that warmer air temperatures could actually “increase snowfall, decreasing the likelihood of sea level rise due to polar ice cap melting.”
Curtis Smith, a spokesman for Shell, declined recently to comment on the company’s actions two decades ago. However, he said Shell recognized the “importance of the climate challenge and the critical role energy has in determining quality of life for people across the world.”
Shell left the Global Climate Coalition in 1998 after the Kyoto agreement had been effectively derailed.
The Rowan Gorilla V jackup oil rig is silhouetted in the evening light near Sable Island. (Peter Parsons / Herald)
During this period, Mobil Oil (now part of Exxon Mobil) considered climate change when designing its Sable gas development off Nova Scotia.
Big storms, monster waves and sea level rise were “all part of the discussion,” said Bassem Eid, author of the report. Eid’s firm, Maclaren Plansearch, was hired by Mobil to conduct the company’s environmental assessment for the Canadian government.
“I used the engineering standards of the day to incorporate potential impacts of Global Warming on sea-level rise,” Eid said in an email. “It was a hot topic in the early 1990s.”
Regulators and engineers at the time were beginning to incorporate such planning into other large infrastructure projects, including a bridge designed to span Northumberland Strait from New Brunswick to Prince Edward Island. Climate change was discussed as project plans were assembled, according to regulators and contractors who worked on the project.
In public, though, the coalition partners, including Exxon’s CEO, Lee Raymond, said that the impact of climate change was uncertain, and that even if the models did prove to be accurate, the effects from warming were not imminent.
“It is highly unlikely that the temperature in the middle of the next century will be affected whether policies are enacted now or 20 years from now,” Raymond told a 1997 gathering of energy executives at the World Petroleum Congress in Beijing.
: :
By the early 2000s, the Canadian government explicitly required companies to consider climate change in their operations.
Exxon Mobil’s Canadian affiliate, Imperial, addressed the effect that climate warming could have on its plan to build pipelines, gas processing and separation facilities, airstrips, helipads and barge landings in the Northwest Territory’s Mackenzie Delta. Its conclusion: very little.
In a 28-page report examining the effects of climate change on the project, Imperial concluded that although “uncertainty exists” and “climate change could affect the northern environment,” those changes were unlikely to have any meaningful impact.
However, at a public hearing on the project, an Imperial engineer told an audience that “the project generally accepts that climate warming is occurring and that’s generally included in the design calculations.” At other hearings, company engineers noted that Imperial had incorporated climate change projections into its plans.
During this same period, Exxon Mobil provided money to organizations questioning that science, including more than $200,000 in 2004 to the Frontiers of Freedom Institute, which supported the work of Willie Soon, a well-known climate change skeptic. Between 1998 and 2005, Exxon Mobil’s foundation provided more than $15 million to similar organizations.
“There is nothing inconsistent about Exxon Mobil managing potential environmental risks while speaking publicly about the limits of scientific knowledge and advocating for effective public policy approaches,” said Exxon Mobil’s spokesman, Jeffers, referring to all of the company’s projects at the time, including those in Canada. “Any suggestion to the contrary would be inaccurate and a distortion of the company’s position.”
::
When Shell left the Global Climate Coalition in 1998, it was followed by Ford Motor Co., Daimler Chrysler, Texaco, Southern Co. and General Motors. The organization disbanded in 2002.
O’Keefe, the coalition’s former chairman, said he had recommended it be shut down because members were “taking a lot of heat” for a job they had already accomplished — effectively quashing any regulation that would have limited fossil fuel use.
Today, all of the major oil companies publicly acknowledge the risks of climate change.
In the mid-2000s, the American Petroleum Industry began funding a project by the National Center for Atmospheric Research to better understand the relationship between climate change and hurricanes in the Gulf of Mexico.
In 2007, Exxon Mobil disclosed to shareholders — for the first time — the potential risks that climate change posed to its bottom line.
“What is most unfortunate,” said Farrell, the Yale sociologist, “is that polarization around climate change ... was manufactured by those whose financial and political interests were most threatened.” Even today, he added, that polarization has crippled any hopes for bipartisan policy solutions.
Meanwhile, the sea level along the Nova Scotia coast, as Mobil Oil’s engineers originally forecast, is indeed rising — and at rates higher than the global average.
Michael Phillis, Melissa Masako Hirsch, Elah Feder and Asaf Shalev contributed to this report.
Over the last year, theEnergy and Environmental Reporting Project at Columbia University’s Graduate School of Journalism, with the Los Angeles Times, has been researching the gap between Exxon Mobil’s public position and its internal planning on the issue of climate change. As part of that effort, reporters reviewed hundreds of documents housed in archives in Calgary’s Glenbow Museum and at the University of Texas. They also reviewed scientific journals and interviewed dozens of experts, including former Exxon Mobil employees. This is the third in a series of occasional articles.
The Energy and Environmental Reporting Project is supported by the Energy Foundation, Open Society Foundations, Rockefeller Brothers Fund, Rockefeller Family Fund, Lorana Sullivan Foundation and the Tellus Mater Foundation. The funders have no involvement in or influence over the articles produced by project fellows in collaboration with The Times.
Additional credits:Digital producer:Sean Greene. Lead photo caption: The Dartmouth ferry passes by the Rowan Gorilla V, left, as it and the Galaxy II sit in Halifax Harbor. (Eric Wynne / Herald)




 Posts
Posts