Too late? Why scientists say we should expect the worst
by David Adam, The Guardian (UK), Tuesday, December 9, 2008
At a high-level academic conference on global warming at Exeter University this summer, climate scientist Kevin Anderson stood before his expert audience and contemplated a strange feeling. He wanted to be wrong. Many of those in the room who knew what he was about to say felt the same. His conclusions had already caused a stir in scientific and political circles. Even committed green campaigners said the implications left them terrified.
Anderson, an expert at the Tyndall Centre for Climate Change Research at Manchester University, was about to send the gloomiest dispatch yet from the frontline of the war against climate change.
Despite the political rhetoric, the scientific warnings, the media headlines and the corporate promises, he would say, carbon emissions were soaring way out of control -- far above even the bleak scenarios considered by last year's report from the Intergovernmental Panel on Climate Change (IPCC) and the Stern review. The battle against dangerous climate change had been lost, and the world needed to prepare for things to get very, very bad.
"As an academic I wanted to be told that it was a very good piece of work and that the conclusions were sound," Anderson said. "But as a human being I desperately wanted someone to point out a mistake, and to tell me we had got it completely wrong."
Nobody did. The cream of the UK climate science community sat in stunned silence as Anderson pointed out that carbon emissions since 2000 have risen much faster than anyone thought possible, driven mainly by the coal-fuelled economic boom in the developing world. So much extra pollution is being pumped out, he said, that most of the climate targets debated by politicians and campaigners are fanciful at best, and "dangerously misguided" at worst.
In the jargon used to count the steady accumulation of carbon dioxide in the Earth's thin layer of atmosphere, he said it was "improbable" that levels could now be restricted to 650 parts per million (ppm).
The CO2 level is currently over 380 ppm, up from 280 ppm at the time of the industrial revolution, and it rises by more than 2 ppm each year. The government's official position is that the world should aim to cap this rise at 450 ppm.
The science is fuzzy, but experts say that could offer an even-money chance of limiting the eventual temperature rise above pre-industrial times to 2 C, which the EU defines as dangerous. (We have had 0.7 C of that already and an estimated extra 0.5 C is guaranteed because of emissions to date.)
The graphs on the large screens behind Anderson's head at Exeter told a different story. Line after line, representing the fumes that belch from chimneys, exhausts and jet engines, that should have bent in a rapid curve towards the ground, were heading for the ceiling instead.
At 650 ppm, the same fuzzy science says the world would face a catastrophic 4 C average rise. And even that bleak future, Anderson said, could only be achieved if rich countries adopted "draconian emission reductions within a decade." Only an unprecedented "planned economic recession" might be enough. The current financial woes would not come close.
Lost cause
Anderson is not the only expert to voice concerns that current targets are hopelessly optimistic. Many scientists, politicians and campaigners privately admit that 2 C is a lost cause. Ask for projections around the dinner table after a few bottles of wine and more vote for 650 ppm than 450 ppm as the more likely outcome.
Bob Watson, chief scientist at the Environment Department and a former head of the IPCC, warned this year that the world needed to prepare for a 4 C rise, which would wipe out hundreds of species, bring extreme food and water shortages in vulnerable countries and cause floods that would displace hundreds of millions of people. Warming would be much more severe towards the poles, which could accelerate melting of the Greenland and West Antarctic ice sheets.
Watson said: "We must alert everybody that at the moment we're at the very top end of the worst case [emissions] scenario. I think we should be striving for 450 [ppm] but I think we should be prepared that 550 [ppm] is a more likely outcome." Hitting the 450 ppm target, he said, would be "unbelievably difficult."
A report for the Australian government this autumn suggested that the 450 ppm goal is so ambitious that it could wreck attempts to agree a new global deal on global warming at Copenhagen next year. The report, from economist Ross Garnaut and dubbed the Australian Stern review, says nations must accept that a greater amount of warming is inevitable, or risk a failure to agree that "would haunt humanity until the end of time."
It says developed nations including Britain, the US and Australia, would have to slash carbon dioxide emissions by 5% each year over the next decade to hit the 450 ppm target. Britain's Climate Change Act 2008, the most ambitious legislation of its kind in the world, calls for reductions of about 3% each year to 2050.
Garnaut, a professorial fellow in economics at Melbourne University, said: "Achieving the objective of 450 ppm would require tighter constraints on emissions than now seem likely in the period to 2020 ... The only alternative would be to impose even tighter constraints on developing countries from 2013, and that does not appear to be realistic at this time."
The report adds: "The awful arithmetic means that exclusively focusing on a 450 ppm outcome, at this moment, could end up providing another reason for not reaching an international agreement to reduce emissions. In the meantime, the cost of excessive focus on an unlikely goal could consign to history any opportunity to lock in an agreement for stabilising at 550 ppm -- a more modest, but still difficult, international outcome. An effective agreement around 550 ppm would be vastly superior to continuation of business as usual."
Henry Derwent, former head of the UK's international climate negotiating team and now president of the International Emissions Trading Association, said a new climate treaty was unlikely to include a stabilisation goal -- either 450 ppm or 550 ppm.
"You've got to avoid talking and thinking in those terms because otherwise the politics reaches a dead end," he said. Many small island states are predicted to be swamped by rising seas with global warming triggered by carbon levels as low as 400 ppm. "It's really difficult for countries to sign up to something that loses them half their territory. It's not going to work."
A new agreement in Copenhagen should concentrate instead on shorter term targets, such as firm emission reductions by 2020, he said.
Worst time
The escalating scale of human emissions could not have come at a worst time, as scientists have discovered that the Earth's forests and oceans could be losing their ability to soak up carbon pollution. Most climate projections assume that about half of all carbon emissions are reabsorbed in these natural sinks.
Computer models predict that this effect will weaken as the world warms, and a string of recent studies suggests this is happening already.
The Southern Ocean's ability to absorb carbon dioxide has weakened by about 15% a decade since 1981, while in the North Atlantic, scientists at the University of East Anglia also found a dramatic decline in the CO2 sink between the mid-1990s and mid-2000s.
A separate study published this year showed the ability of forests to soak up anthropogenic carbon dioxide (i.e., that caused by human activity) was weakening, because the changing length of the seasons alters the time when trees switch from being a sink of carbon to a source.
Soils could also be giving up their carbon stores: evidence emerged in 2005 that a vast expanse of western Siberia was undergoing an unprecedented thaw.
The region, the largest frozen peat bog in the world, had begun to melt for the first time since it formed 11,000 years ago. Scientists believe the bog could begin to release billions of tonnes of methane locked up in the soils, a greenhouse gas 20 times more potent than carbon dioxide. The World Meteorological Organisation recently reported the largest annual rise of methane levels in the atmosphere for a decade.
Some experts argue that the grave nature of recent studies, combined with the unexpected boom in carbon emissions, demands an urgent reassessment of the situation. In an article published this month in the journal Climatic Change, Peter Sheehan, an economist at Victoria University, Australia, says the scale of recent emissions means the carbon cuts suggested by the IPCC to stabilise levels in the atmosphere "cannot be taken as a reliable guide for immediate policy determination." The cuts, he says, will need to be bigger and in more places.
Earlier this year, Dr. James Hansen, senior climate scientist with NASA, published a paper that said the world's carbon targets needed to be urgently revised because of the risk of feedbacks in the climate system. He used reconstructions of the Earth's past climate to show that a target of 350 ppm, significantly below where we are today, is needed to "preserve a planet similar to that on which civilisation developed and to which life on Earth is adapted." Hansen has suggested a joint review by Britain's Royal Society and the US National Academy of Sciences of all research findings since the IPCC report.
Rajendra Pachauri, who chairs the IPCC, argues that suggestions the IPCC report is out of date is "not a valid position at all."
He said: "What the IPCC produces is not based on two years of literature, but 30 or 40 years of literature. We're not dealing with short-term weather changes, we're talking about major changes in our climate system. I refuse to accept that a few papers are in any way going to influence the long-term projections the IPCC has come up with."
At Defra, Watson said: "Even without the new information there was enough to make most policy makers think that urgent action was absolutely essential. The new information only strengthens that and pushes it even harder. It was already very urgent to start with. It's now become very, very urgent."
guardian.co.uk © Guardian News and Media Limited 2008
Link to article:
http://www.guardian.co.uk/environment/2008/dec/09/poznan-copenhagen-global-warming-targets-climate-change
Wednesday, December 10, 2008


Tuesday, December 9, 2008
JPL's Alan Buis: Pacific Ocean remains locked in a strong, cool phase of the Pacific Decadal Oscillation
Alan Buis 818-354-0474
Jet Propulsion Laboratory, Pasadena, Calif.
Alan.buis@jpl.nasa.gov
IMAGE ADVISORY: 2008-231
Oscillation Rules as the Pacific Cools
PASADENA, Calif. -- The latest image of sea-surface height measurements from the U.S./French Jason-1 oceanography satellite shows the Pacific Ocean remains locked in a strong, cool phase of the Pacific Decadal Oscillation, a large, long-lived pattern of climate variability in the Pacific associated with a general cooling of Pacific waters. The image also confirms that El Niño and La Niña remain absent from the tropical Pacific.
Pacific remains locked in cool pattern
12.09.08
 A cool wedge of lower-than-normal sea-surface heights continues to dominate the tropical Pacific, ringed by a horseshoe of warmer waters. The continuation of this long-term cool phase of the Pacific Decadal Oscillation stacks the odds against a wetter-than-average winter/spring in the southwestern United States. (Image credit: NASA/JPL)
 The new image is available online at: http://www.nasa.gov/topics/
The image is based on the average of 10 days of data centered on Nov. 15, 2008, compared to the long-term average of observations from 1993 through 2008. In the image, places where the Pacific sea-surface height is higher (warmer) than normal are yellow and red, and places where the sea surface is lower (cooler) than normal are blue and purple. Green shows where conditions are near normal. Sea-surface height is an indicator of the heat content of the upper ocean.
The Pacific Decadal Oscillation is a long-term fluctuation of the Pacific Ocean that waxes and wanes between cool and warm phases approximately every five to 20 years. In the present cool phase, higher-than-normal sea-surface heights caused by warm water form a horseshoe pattern that connects the north, west and southern Pacific. This is in contrast to a cool wedge of lower-than-normal sea-surface heights spreading from the Americas into the eastern equatorial Pacific. During most of the 1980s and 1990s, the Pacific was locked in the oscillation's warm phase, during which these warm and cool regions are reversed. For an explanation of the Pacific Decadal Oscillation and its present state, see: http://jisao.washington.edu/
Sea-surface temperature satellite data from the National Oceanic and Atmospheric Administration mirror Jason sea-surface height measurements, clearly showing a cool Pacific Decadal Oscillation pattern, as seen at: http://www.cdc.noaa.gov/map/
"This multi-year Pacific Decadal Oscillation 'cool' trend can cause La Niña-like impacts around the Pacific basin," said Bill Patzert, an oceanographer and climatologist at NASA's Jet Propulsion Laboratory, Pasadena, Calif. "The present cool phase of the Pacific Decadal Oscillation will have significant implications for shifts in marine ecosystems, and for land temperature and rainfall patterns around the Pacific basin."
According to Nathan Mantua of the Climate Impacts Group at the University of Washington, Seattle, whose research contributed to the early understanding of the Pacific Decadal Oscillation, "Even with the strong La Niña event fading in the tropics last spring, the North Pacific's sea surface temperature anomaly pattern has remained strongly negative since last fall. This cool phase will likely persist this winter and, perhaps, beyond. Historically, this situation has been associated with favorable ocean conditions for the return of U.S. west coast Coho and Chinook salmon, but it translates to low odds for abundant winter/spring precipitation in the southwest (including Southern California)."
Jason's follow-on mission, the Ocean Surface Topography Mission/Jason-2, was successfully launched this past June and will extend to two decades the continuous data record of sea surface heights begun by Topex/Poseidon in 1992. The new mission has produced excellent data, which have recently been certified for operational use. Fully calibrated and validated data for science use will be released next spring.
JPL manages the U.S. portion of the Jason-1 mission for NASA's Science Mission Directorate, Washington. JPL is managed for NASA by the California Institute of Technology in Pasadena.
For more information on NASA's ocean surface topography missions, visit http://sealevel.jpl.nasa.gov/ .
To view the latest Jason-1 data, visit http://sealevel.jpl.nasa.gov/
Effects of Climate Change on the World's Oceans -- International Symposium, Gijón, France, May 19-23, 2008
Christopher L. Sabine, Richard A. Feely, Frank J. Millero, Andrew G. Dickson, Rik Wanninkhof, Dana Greeley and Esa Peltola (Invited)
Decadal changes in the Atlantic, Pacific and Indian Ocean inorganic carbon inventories
(pdf, 2.3 Mb)
Andrew J. Watson, P.J. Brown and U. Schuster (Invited)
The changing uptake of CO2 by the North Atlantic Ocean
(Waiting for permission)
Nicolas Metzl and Andrew Lenton
What can surface fCO2 measurements tell us about the evolution of the Southern Ocean CO2 sink?
(pdf, 4 Mb)
Kirsten Zickfeld, John C. Fyfe, Michael Eby and Andrew J. Weaver
Negative feedback of poleward intensifying southern hemisphere winds on atmospheric CO2 in the 21st century
(pdf, 0.4 Mb)
Andrew Lenton, Laurent Bopp Francis Codron, Nicolas Metzl and Patricia Cadule
The combined effects of rising atmospheric CO2 and declining stratospheric ozone on the past and future uptake of CO2 by the Southern Ocean
(pdf, will be added soon...)
Claire Lo Monaco, Andrew Lenton, Nicolas Metzl and Keith B. Rodgers
Natural and anthropogenic carbon changes in mode waters of the south west Indian Ocean
(pdf, 3.4 Mb)
Galen A. McKinley, David Ullman, Val Bennington, Stephanie Dutkiewicz and Nicolas R. Bates
Advective impacts on North Atlantic carbon sink variability
(pdf, 1.4 Mb)
Keith B. Rodgers, Anand Gnanadesikan, Robert Key and Jorge L. Sarmiento
Altimetry helps to explain patchy changes in repeat hydrography carbon measurements
(pdf, 0.4 Mb)
Jill A. Peloquin, Zouhair Lachkar and Nicolas P. Gruber
Understanding the impact of physical forcing on Southern Ocean phytoplankton and primary production
(Waiting for permission)
Michio Aoyama, M. Fukasawa, T. Kawano, S. Kouketsu, Y. Kumamoto, A. Murata, K. Sato and H. Uchida
An increase of silicic acid and nitrate concentrations along the pathway of Lower Circumpolar Deep Water in the Pacific Ocean: results of snapshot comparisons
(pdf, 1.2 Mb)
Tsuneo Ono, Akihiro Shiomoto and Toshiro Saino
Recent decrease of summer time nutrients in the mixed layer of the North Pacific HNLC region
(pdf, 1 Mb)
Kazuaki Tadokoro, Tsuneo Ono, Ichiro Yasuda, Satoshi Osafune, Yuji Okazaki, Akihiro Shiomoto and Hiroya Sugisaki
Possible mechanism of decadal-scale variation in PO4 concentration in the western north Pacific, and the influence on ocean productivity
(pdf, 0.6 Mb)
Masahiko Fujii, Fei Chai, Lei Shi, Hisayuki Y. Inoue and Masao Ishii
Seasonal and interannual variation of ocean carbon cycling in the western and eastern tropical-subtropical Pacific: a physical-biogeochemical modelling study
(pdf, 1 Mb)
Julia Wohlers, Anja Engel, Eckart Zöllner, Ulrich Sommer and Ulf Riebesell
The impact of rising sea surface temperature on the cycling of organic matter: an indoor mesocosm study
(Permission denied)
Richard B. Rivkin and Louis Legendre
Microbial dynamics and response to a changing polar ocean climate
(Waiting for permission)
Martin A. Montes-Hugo, Oscar Schofield, Hugh W. Ducklow, Douglas G. Martinson and Ray Smith
Climate mediated changes in phytoplankton productivity and air-sea CO2 exchange on the western shelf of the Antarctic Peninsula over the last 30 years
(pdf, 1.2 Mb)
Marie-Fanny Racault, Corinne Le Quéré, Erik T. Buitenhuis and Trevor Platt
Characterisation of phytoplankton blooms and their contribution to export production
(Permission denied)
Marta Álvarez, Claire Lo Monaco, Toste Tanhua, Andrew Yool, Andreas Oschlies, Jonh L. Bullister, Catherine Goyet, Frank Touratier, Rik Wanninkhof, Dave Wisegarver, Elaine McDonagh and Harry L. Bryden
A higher storage of anthropogenic carbon in the Indian Ocean?
(pdf, 2 Mb)
Link to links: http://www.pices.int/publications/presentations/Climate_Change_2008/Climate_Change_2008_S2_1/Climate_Change_2008_presentations_S2_1.aspx
Decadal changes in the Atlantic, Pacific and Indian Ocean inorganic carbon inventories
(pdf, 2.3 Mb)
Andrew J. Watson, P.J. Brown and U. Schuster (Invited)
The changing uptake of CO2 by the North Atlantic Ocean
(Waiting for permission)
Nicolas Metzl and Andrew Lenton
What can surface fCO2 measurements tell us about the evolution of the Southern Ocean CO2 sink?
(pdf, 4 Mb)
Kirsten Zickfeld, John C. Fyfe, Michael Eby and Andrew J. Weaver
Negative feedback of poleward intensifying southern hemisphere winds on atmospheric CO2 in the 21st century
(pdf, 0.4 Mb)
Andrew Lenton, Laurent Bopp Francis Codron, Nicolas Metzl and Patricia Cadule
The combined effects of rising atmospheric CO2 and declining stratospheric ozone on the past and future uptake of CO2 by the Southern Ocean
(pdf, will be added soon...)
Claire Lo Monaco, Andrew Lenton, Nicolas Metzl and Keith B. Rodgers
Natural and anthropogenic carbon changes in mode waters of the south west Indian Ocean
(pdf, 3.4 Mb)
Galen A. McKinley, David Ullman, Val Bennington, Stephanie Dutkiewicz and Nicolas R. Bates
Advective impacts on North Atlantic carbon sink variability
(pdf, 1.4 Mb)
Keith B. Rodgers, Anand Gnanadesikan, Robert Key and Jorge L. Sarmiento
Altimetry helps to explain patchy changes in repeat hydrography carbon measurements
(pdf, 0.4 Mb)
Jill A. Peloquin, Zouhair Lachkar and Nicolas P. Gruber
Understanding the impact of physical forcing on Southern Ocean phytoplankton and primary production
(Waiting for permission)
Michio Aoyama, M. Fukasawa, T. Kawano, S. Kouketsu, Y. Kumamoto, A. Murata, K. Sato and H. Uchida
An increase of silicic acid and nitrate concentrations along the pathway of Lower Circumpolar Deep Water in the Pacific Ocean: results of snapshot comparisons
(pdf, 1.2 Mb)
Tsuneo Ono, Akihiro Shiomoto and Toshiro Saino
Recent decrease of summer time nutrients in the mixed layer of the North Pacific HNLC region
(pdf, 1 Mb)
Kazuaki Tadokoro, Tsuneo Ono, Ichiro Yasuda, Satoshi Osafune, Yuji Okazaki, Akihiro Shiomoto and Hiroya Sugisaki
Possible mechanism of decadal-scale variation in PO4 concentration in the western north Pacific, and the influence on ocean productivity
(pdf, 0.6 Mb)
Masahiko Fujii, Fei Chai, Lei Shi, Hisayuki Y. Inoue and Masao Ishii
Seasonal and interannual variation of ocean carbon cycling in the western and eastern tropical-subtropical Pacific: a physical-biogeochemical modelling study
(pdf, 1 Mb)
Julia Wohlers, Anja Engel, Eckart Zöllner, Ulrich Sommer and Ulf Riebesell
The impact of rising sea surface temperature on the cycling of organic matter: an indoor mesocosm study
(Permission denied)
Richard B. Rivkin and Louis Legendre
Microbial dynamics and response to a changing polar ocean climate
(Waiting for permission)
Martin A. Montes-Hugo, Oscar Schofield, Hugh W. Ducklow, Douglas G. Martinson and Ray Smith
Climate mediated changes in phytoplankton productivity and air-sea CO2 exchange on the western shelf of the Antarctic Peninsula over the last 30 years
(pdf, 1.2 Mb)
Marie-Fanny Racault, Corinne Le Quéré, Erik T. Buitenhuis and Trevor Platt
Characterisation of phytoplankton blooms and their contribution to export production
(Permission denied)
Marta Álvarez, Claire Lo Monaco, Toste Tanhua, Andrew Yool, Andreas Oschlies, Jonh L. Bullister, Catherine Goyet, Frank Touratier, Rik Wanninkhof, Dave Wisegarver, Elaine McDonagh and Harry L. Bryden
A higher storage of anthropogenic carbon in the Indian Ocean?
(pdf, 2 Mb)
Link to links: http://www.pices.int/publications/presentations/Climate_Change_2008/Climate_Change_2008_S2_1/Climate_Change_2008_presentations_S2_1.aspx
Ozone hole over Antarctica weakens Southern Ocean carbon sink
Published online 9 December 2008 | Nature | doi:10.1038/news.2008.1292
News
Ozone hole weakens oceanic carbon sink
A new model links stratospheric ozone depletion to ocean acidification
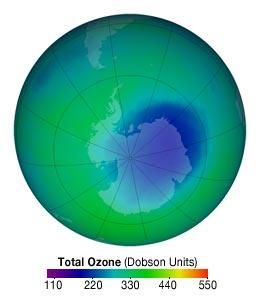 Is the hole in ozone layer damaging the oceans' ability to soak up carbon dioxide? (NASA)
The hole in the ozone layer over Antarctica may be impairing the Southern Ocean's ability to mop up carbon dioxide from Earth's atmosphere, according to work presented at a meeting in France today.
Earth's oceans are the largest sink of carbon dioxide, with the Southern Ocean accounting for more than 40% of the annual uptake of the greenhouse gas, says Andrew Lenton, a marine biochemist at the Pierre and Marie Curie University in Paris. In theory, seas should soak up more carbon dioxide as levels of the gas in the atmosphere rise.
But recent measurements have bucked simulations1–3, showing that the Southern Ocean's surface waters have higher carbon levels than expected, which also makes them more acidic. As a result, the amount of CO2 that the ocean absorbs each year has also flattened out.
Missing link
What was missing from the models, says Lenton, was stratospheric ozone damage — which, along with the climatic effects of greenhouse-gas emissions, is thought to be behind the observed strengthening of southern winds. These winds, he says, may causing ocean currents that stir up carbon stored in the deep ocean and bring it up to the surface. As part of the five-year CARBOOCEAN project, a research consortium on marine impacts of carbon-dioxide emissions that is meeting in Dourdan from 8–12 December, Lenton and his colleagues built Southern Ocean simulations that coupled the ozone's effects on winds to ocean currents and marine carbon levels.
Until now, these connections have only been studied piecemeal, says Christoph Heinze, a biogeochemical modeller at the University of Bergen in Norway, who was not involved in the study. "It's one of the rare examples where somebody has really looked at several components of the Earth system together," he says.
By running the models both with and without ozone depletion since 1975, the researchers "isolated the signal from ozone depletion", says Lenton's co-worker Francis Codron, an atmospheric scientist at the Dynamic Meteorology Laboratory in Paris.
Including the ozone hole reproduced the carbon sink that has observed by oceanographers. "These sound like very different parts of the system, and yet one affects the other," says Codron.
The signal from ozone, the researchers found, drove a drop in Southern Ocean surface pH of 0.01 units from 1994 to 2004 — half the total pH decline in that period, and one-tenth of the change since the pre-industrial era.
Model muddle
Although the Antarctic ozone hole has stabilized in recent years and is expected to heal in the latter half of this century, climate models that don't include its effects may show an overly optimistic future, says Lenton. Julie Arblaster of the Bureau of Meteorology Research Centre in Melbourne, Australia, agrees: "Understanding recent trends in the Southern Ocean carbon sink is key to understanding future projections of atmospheric CO2."
Other work, however, casts doubt on that understanding. Scientists from the Leibniz Institute of Marine Sciences in Kiel, Germany, led by Claus Böning, have questioned the altered ocean currents seen in models such as that of Lenton and his colleagues, saying that oceanographic data don't bear them out4. Corinne Le Quéré of the University of East Anglia, UK, who studied the Southern Ocean carbon sink1, says that Lenton's model seems to account for the observed failure of the Southern Ocean to take up more CO2. But with the controversy over ocean currents, she says, "I don't have very much confidence in the explanation of the process" that the model provides.
Lenton says the contradictions could still be resolved. "What we're arguing over is the mechanism by which the carbon-rich deep water is ventilated," he says. Böning and his colleagues endorse more-detailed ocean models, which show how winds affect small eddies as well as large ocean currents. But these models don't look at carbon-dioxide levels — a crucial omission, says Lenton. A more detailed model, he says, would give much the same results he has reported.
"The great challenge now, for the future, is to run their model with carbon in it," says Lenton — but for now, such a complex simulation is out of reach.
-
References
- et al. Science 316, 1735–1738 (2008).
- et al. Deep-Sea Res. II (in the press).
- Deep-Sea Res. II (in the press).
- , , , & Nature Geosci. 1, 864–869 (2008).
George Monbiot: Cyberspace has buried its head in a cesspit of climate change gibberish
Cyberspace has buried its head in a cesspit of climate change gibberish
The Stansted protesters get it. The politicians of Poznan don't quite. But online, planted deniers drive a blinkered fiction
by George Monbiot, The Guardian, December 9, 2008We all create our own reality, and shut out the voices we do not want to hear. But there is no issue we are less willing to entertain than man-made climate change. Here, three worlds seem to exist in virtual isolation. In the physical world, global warming appears to be spilling over into runaway feedback: the most dangerous situation humankind has ever encountered. In the political world - at the climate talks in Poznan, for instance - our governments seem to be responding to something quite different, a minor nuisance that can be addressed in due course. Only the Plane Stupid protesters who occupied part of Stansted airport yesterday appear to have understood the scale and speed of this crisis. In cyberspace, by contrast, the response spreading fastest and furthest is flat-out denial.
The most popular article on the Guardian's website last week was the report showing that 2008 is likely to be the coolest year since 2000. As the Met Office predicted, global temperatures have been held down by the La Niña event in the Pacific Ocean. This news prompted a race on the Guardian's comment thread to reach the outer limits of idiocy. Of the 440 responses posted by lunchtime yesterday, about 80% insisted that manmade climate change is a hoax. Here's a sample of the conversation:
"This is a scam to get your money ... The only people buying into 'global warming' have no experience with any of the sciences."
"If we spend any money or cost one person their job because of this fraud it would be a crime. When will one of our politicians stand up and call this for what it is, bullshit!"
"What a set of jokers these professors are ... I think I understand more about climate change than them and I don't get paid a big fat salary with all the perks to go with it."
And so on, and on and on. The new figures have prompted similar observations all over the web. Until now, the "sceptics" have assured us that you can't believe the temperature readings at all; that the scientists at the Met Office, who produced the latest figures, are all liars; and that even if it were true that temperatures have risen, it doesn't mean anything. Now the temperature record - though only for 2008 - can suddenly be trusted, and the widest possible inferences be drawn from the latest figures, though not, of course, from the records of the preceding century. This is madness.
Scrambled up in these comment threads are the memes planted in the public mind by the professional deniers employed by fossil fuel companies. On the Guardian's forums, you'll find endless claims that the hockeystick graph of global temperatures has been debunked; that sunspots are largely responsible for current temperature changes; that the world's glaciers are advancing; that global warming theory depends entirely on computer models; that most climate scientists in the 1970s were predicting a new ice age. None of this is true, but it doesn't matter. The professional deniers are paid not to win the argument but to cause as much confusion and delay as possible. To judge by the Comment threads, they have succeeded magnificently.
There is no pool so shallow that a thousand bloggers won't drown in it. Take the latest claims from the former broadcaster David Bellamy. You may remember that Bellamy came famously unstuck three years ago when he stated that 555 of the 625 glaciers being observed by the World Glacier Monitoring Service were growing. Now he has made an even stranger allegation. In early November the Express ran an interview with Bellamy under the headline "BBC shunned me for denying climate change". "The sad fact is," he explained, "that since I said I didn't believe human beings caused global warming I've not been allowed to make a TV programme." He had been brave enough to state that global warming was "poppycock", and that caused the end of his career. "Back then, at the BBC you had to toe the line and I wasn't doing that."
This article, on the web, received more hits than almost anything else the Express has published; so 10 days ago the paper interviewed Bellamy again. He took the opportunity to explain just how far the conspiracy had spread. "Have you noticed there is a wind turbine on Teletubbies? That's subliminal advertising, isn't it?"
There is just one problem with this story: it is bollocks from start to finish. Bellamy last presented a programme on the BBC in 1994. The first time he publicly challenged the theory of manmade climate change was 10 years later, in 2004, when he claimed in the Daily Mail that it was "poppycock". Until at least the year 2000 he supported the theory.
In 1992, for instance, he signed an open letter, published in the Guardian, urging George Bush Sr "to fight global warming ... We are convinced that the continued emission of carbon dioxide at current rates could result in dramatic and devastating climate change in all regions of the world." In 1996 he signed a letter to the Times, arguing: "Continued increases in the global emissions of carbon dioxide from the burning of fossil fuels are likely to lead to climate change at a rate greater than the Earth has experienced at any time during the last 10,000 years." In the same year he called for the replacement of fossil fuels with wind power. In 2000 he announced that he was supporting a plan to sue climate change "criminals": governments and industries that blocked attempts to stop global warming (all references are on my website). But Bellamy's new claims about the end of his career have been repeated as gospel in several newspapers and all over the web.
In his fascinating book Carbon Detox, George Marshall argues that people are not persuaded by information. Our views are formed by the views of the people with whom we mix. Of the narratives that might penetrate these circles, we are more likely to listen to those that offer us some reward. A story that tells us that the world is cooking and that we'll have to make sacrifices for the sake of future generations is less likely to be accepted than the more rewarding idea that climate change is a conspiracy hatched by scheming governments and venal scientists, and that strong, independent-minded people should unite to defend their freedoms.
He proposes that instead of arguing for sacrifice, environmentalists should show where the rewards might lie: that understanding what the science is saying and planning accordingly is the smart thing to do, which will protect your interests more effectively than flinging abuse at scientists. We should emphasise the old-fashioned virtues of uniting in the face of a crisis, of resourcefulness and community action. Projects like the transition towns network and proposals for a green new deal tell a story which people are more willing to hear.
Marshall is right: we have to change the way we talk about this issue. You don't believe me? Then just read the gibberish that follows when this article is published online.Link to article: http://www.guardian.co.uk/commentisfree/2008/dec/09/climate-change-science-environment
Sunday, December 7, 2008
Andrew Glikson: Dangerous climate change
[BLOGGER'S NOTE: This post is excerpted from a much larger article -- please see the link below for more information.]
Link to the rest of this article:
http://www.opednews.com/articles/Dangerous-Climate-Change--by-Andrew-Glikson-081206-176.html
Climate change post-1750 is driven by total radiative forcing tracking toward ca. 3 Watt/m2, near-half the forcing of 6.5±1.5 Watt/m2 associated with the last glacial termination (ca. 14.7–11.7 kyr ago). Given the onset of the Antarctic ice sheet at or below 450 ppm CO2 ca. 34 million years ago (Ma) (late Eocene), and of Arctic Sea ice below 400 ppm ca. 2.8 Ma (mid-Pliocene), the projected consequences of CO2 trajectories toward 550 or 650 ppm through the 21st century, now considered inevitable by governments, likely involve a return to Pliocene conditions (+ 2–3 oC; + 25±12 m sea level rise; permanent El Nino) through likely climate tipping points. Depending on the degree of methane (CH4) release from sediments, permafrost and tropical bogs, developments analogous to the PETM (Paleocene-Eocene Thermal Maximum, 56 Ma; + 6 oC) and attendant mass extinctions may ensue. The Intergovernmental Panel for Climate Change (IPCC) 2007 projections underestimate ice melt and sea level rise parameters. The Garnaut-2008 Report takes limited account of the effects of methane release from permafrost and shallow polar ocean sediments and the synergy of carbon cycle feedbacks and ice melt/water feedbacks, as indicated by the recent climate history of Earth. Assumption of CO2 and climate 'stabilization' and possible reversal on decadal time scale are difficult to reconcile with the sharp transitions between climate states observed in the recent history of the atmosphere. The opening of an ice-free Arctic ocean and slow-down or aborting of the North Atlantic thermohaline circulation lead to a new climate regime in the Northern Hemisphere, possibly similar to events ca. 8.2 kyr ago when ice-melt currents resulted in several degrees cooling and freezing of Europe. According to Anderson and Bows (2008), it may be too late to arrest climate change by reduced carbon emission alone. Humanity needs to fast-track development of techniques for atmospheric CO2 down-draw to levels ca. 350 ppm and below (Hansen et al., 2008).
Link to the rest of this article:
http://www.opednews.com/articles/Dangerous-Climate-Change--by-Andrew-Glikson-081206-176.html
Johannes Lehmann: Biochar -- Scientist says ancient technique cuts greenhouse gas
by Gerard Wynn, posted 2008/12/05 at 1:22 pm EST
POZNAN, Poland, December 5, 2008 (Reuters) — An ancient technique of plowing charred plants into the ground to revive soil may also trap greenhouse gases for thousands of years and forestall global warming, scientists said on Friday.
Heating plants such as farm waste or wood in airtight conditions produces a high-carbon substance called biochar, which can store the greenhouse gas carbon dioxide and enhance nutrients in the soil.
Plants absorb carbon dioxide from the atmosphere as they grow. Subsequently storing that carbon in the soil removes the gas from the atmosphere.
"I feel confident that the (carbon storage) time of stable biochar is from high hundreds to a few thousand years," said Cornell University's Johannes Lehmann, at an event on the sidelines of U.N. climate talks in the Polish city of Poznan.
Lehmann estimated that under ambitious scenarios biochar could store 1 billion tons of carbon annually -- equivalent to more than 10 percent of global carbon emissions, which amounted to 8.5 billion tons in 2007.
Under a conservative scenario the technique could store 0.2 billion tons of carbon annually, he said. That would still require heating without oxygen -- called pyrolysis -- some 27 percent of global crop waste and plowing this into the soil.
Lehmann cited experiments on 10 farm crops suggesting biochar can also increase yields by up to three times, because the organic matter holds on to nutrients.
The International Energy Agency (IEA) said in November that global greenhouse gas emissions were so out of control that avoiding more dangerous levels of climate change depended on creating negative emissions later this century.
The energy adviser to 28 industrialized countries cited biochar as one way of achieving that.
The technique rings alarm bells among some environmentalists worried it could spur deforestation, but its chief problem may be that it is barely proven on a commercial scale.
"It will remain theoretical without making demonstration plants on the ground," Lehmann said.
Soils containing biochar made by Amazon people thousands of years ago still contain up to 70 times more black carbon than surrounding soils and are still higher in nutrients, said Debbie Reed, director of the International Biochar Initiative (IBI).
The IBI was in Poznan to lobby for research funding for biochar. In Poznan, 187 countries are meeting in ongoing talks to agree a new climate treaty to replace the Kyoto Protocol after 2012. They hope to finalize a deal next year.
Lehmann emphasized that the technique was not a substitute for fighting climate change by curbing man-made greenhouse gas emissions, especially carbon dioxide from burning fossil fuels.
(Reporting by Gerard Wynn, Editing by Catherine Bosley)
Link to article: http://www.newsdaily.com/stories/tre4b45kb-us-climate-biochar/
Climate change may have driven decline of Roman and Byzantine empires 1,400 years ago
Decline of Roman And Byzantine empires 1,400 years ago may have been driven by climate change
ScienceDaily, December 6, 2008 — The decline of the Roman and Byzantine Empires in the Eastern Mediterranean more than 1,400 years ago may have been driven by unfavorable climate changes.
Based on chemical signatures in a piece of calcite from a cave near Jerusalem, a team of American and Israeli geologists pieced together a detailed record of the area's climate from roughly 200 B.C. to 1100 A.D. Their analysis, to be reported in an upcoming issue of the journal Quaternary Research, reveals increasingly dry weather from 100 A.D. to 700 A.D. that coincided with the fall of both Roman and Byzantine rule in the region.
The researchers, led by University of Wisconsin-Madison geology graduate student Ian Orland and professor John Valley, reconstructed the high-resolution climate record based on geochemical analysis of a stalagmite from Soreq Cave, located in the Stalactite Cave Nature Reserve near Jerusalem.
"It looks sort of like tree rings in cross-section. You have many concentric rings and you can analyze across these rings, but instead of looking at the ring widths, we're looking at the geochemical composition of each ring," says Orland.
Using oxygen isotope signatures and impurities — such as organic matter flushed into the cave by surface rain — trapped in the layered mineral deposits, Orland determined annual rainfall levels for the years the stalagmite was growing, from approximately 200 B.C. to 1100 A.D.
While cave formations have previously been used as climate indicators, past analyses have relied on relatively crude sampling tools, typically small dental drills, which required averaging across 10 or even 100 years at a time. The current analysis used an advanced ion microprobe in the Wisconsin Secondary-Ion Mass-Spectrometer (Wisc-SIMS) laboratory to sample spots just one-hundredth of a millimeter across. That represents about 100 times sharper detail than previous methods. With such fine resolution, the scientists were able to discriminate weather patterns from individual years and seasons.
Their detailed climate record shows that the Eastern Mediterranean became drier between 100 A.D. and 700 A.D., a time when Roman and Byzantine power in the region waned, including steep drops in precipitation around 100 A.D. and 400 A.D. "Whether this is what weakened the Byzantines or not isn't known, but it is an interesting correlation," Valley says. "These things were certainly going on at the time that those historic changes occurred."
The team is now applying the same techniques to older samples from the same cave. "One period of interest is the last glacial termination, around 19,000 years ago — the most recent period in Earth's history when the whole globe experienced a warming of 4 to 5 degrees Celsius," Orland says.
Formations from this period of rapid change may help them better understand how weather patterns respond to quickly warming temperatures.
Soreq Cave (at least 185,000 years old and still active) also offers the hope of creating a high-resolution, long-term, climate-change record to parallel those generated from Greenland and Antarctic ice cores.
"No one knows what happened on the continents… At the poles, the climate might have been quite different," says Valley. "This is a record of what was going on in a very different part of the world."
In addition to Valley and Orland, the paper was authored by Miryam Bar-Matthews and Avner Ayalon from the Geological Survey of Israel, Alan Matthews of the Hebrew University in Jerusalem and Noriko Kita of UW-Madison.
Funding for the project is from the Comer Science and Education Foundation, National Science Foundation, U.S. Department of Energy, Israel Science Foundation, Sigma Xi, and the UW-Madison Department of Geology and Geophysics.
Adapted from materials provided by University of Wisconsin-Madison.
University of Wisconsin-Madison (2008, December 6). Decline Of Roman And Byzantine Empires 1,400 years ago may have been driven By Climate Change. ScienceDaily. Retrieved December 7, 2008, from http://www.sciencedaily.com/releases/2008/12/081205171005.htm
Rob Raiswell et al., Bioavailable iron in the Southern Ocean: The significance of the iceberg conveyor belt
Rob Raiswell1  , Liane G Benning1
  , Martyn Tranter2 and Slawek Tulaczyk3
1Earth and Biosphere Institute, School of Earth and Environment, University of Leeds, Leeds, LS2 9JT, U.K.
2Bristol Glaciology Centre, School of Geographical Sciences, University of Bristol, Bristol, BS8 1SS, U.K.
3Department of Earth and Planetary Sciences, University of California, Santa Cruz, CA 95064, U.S.A.
 author email
 corresponding author email
Geochemical Transactions, 2008, 9:7 doi:10.1186/1467-4866-9-7; published May 30, 2008
Abstract
Productivity in the Southern Oceans is iron-limited, and the supply of iron dissolved from aeolian dust is believed to be the main source from outside the marine reservoir. Glacial sediment sources of iron have rarely been considered, as the iron has been assumed to be inert and non-bioavailable. This study demonstrates the presence of potentially bioavailable Fe as ferrihydrite and goethite in nanoparticulate clusters, in sediments collected from icebergs in the Southern Ocean and glaciers on the Antarctic landmass. Nanoparticles in ice can be transported by icebergs away from coastal regions in the Southern Ocean, enabling melting to release bioavailable Fe to the open ocean. The abundance of nanoparticulate iron has been measured by an ascorbate extraction. These data indicate that the fluxes of bioavailable iron supplied to the Southern Ocean from aeolian dust (0.01–0.13 Tg yr-1) and icebergs (0.06–0.12 Tg yr-1) are comparable. Increases in iceberg production thus have the capacity to increase productivity and this newly identified negative feedback may help to mitigate fossil fuel emissions.
Link to abstract: http://www.geochemicaltransactions.com/content/9/1/7/abstract
Friday, December 5, 2008
Lester Brown: To fight global warming, we need climate action on the scope of the WWII mobilization
A wartime mobilization
We need climate action on the scope of the WWII mobilization
by Lester Brown, guest contributor, Grist, December 4, 2008
There are many things we do not know about the future. But one thing we do know is that business as usual will not continue for much longer. Massive change is inevitable. Will the change come because we move quickly to restructure the economy or because we fail to act and civilization begins to unravel?
Saving civilization will take a massive mobilization, and at wartime speed. The closest analogy is the belated U.S. mobilization during World War II. But unlike that chapter in history, in which one country totally restructured its economy, the Plan B mobilization requires decisive action on a global scale.
On the climate front, official attention has now shifted to negotiating a post-Kyoto protocol to reduce carbon emissions. But that will take years. We need to act now. There is simply not time for years of negotiations and then more years for ratification of another international agreement.
It is time for individual countries to take initiatives on their own. New Zealand is leading the way, having announced in 2007 that it will boost the renewable share of its electricity from 70 percent, mostly hydro and geothermal, to 90 percent by 2025. The country plans to cut per capita carbon emissions from transport in half by 2040. Beyond this, New Zealand plans to expand its forested area by some 250,000 hectares by 2020, ultimately sequestering roughly 1 million tons of carbon per year.
We know from our analysis of global warming, from the accelerating deterioration of the economy's ecological supports, and from our projections of future resource use in China that the western economic model -- the fossil-fuel-based, automobile-centered, throwaway economy -- will not last much longer. We need to build a new economy, one that will be powered by renewable sources of energy, that will have a diversified transport system, and that will reuse and recycle everything.
We can describe this new economy in some detail. The question is how to get from here to there before time runs out. Can we reach the political tipping points that will enable us to cut carbon emissions before we reach the ecological tipping points where the melting of the Himalayan glaciers becomes irreversible? Will we be able to halt the deforestation of the Amazon before it dries out, becomes vulnerable to fire, and turns into wasteland?
What if three years from now scientists announced that we have waited too long to cut carbon emissions and that the melting of the Greenland ice sheet is irreversible? How would the realization that we are responsible for a coming 23-foot rise in sea level and hundreds of millions of refugees from rising seas affect us? How would it affect our sense of self, our sense of who we are? It could trigger a fracturing of society along generational lines like the more familiar fracturing of societies along racial, religious, and ethnic lines. How will we respond to our children when they ask, "How could you do this to us? How could you leave us facing such chaos?"
As we have seen, a corporate accounting system that left costs off the books drove Enron, one of the largest U.S. corporations, into bankruptcy. Unfortunately, our global economic accounting system that also leaves costs off the books has potentially far more serious consequences.
The key to building a global economy that can sustain economic progress is the creation of an honest market, one that tells the ecological truth. To create an honest market, we need to restructure the tax system by reducing taxes on work and raising them on various environmentally destructive activities to incorporate indirect costs into the market price. If we can get the market to tell the truth, then we can avoid being blindsided by a faulty accounting system that leads to bankruptcy. As Øystein Dahle, former Vice President of Exxon for Norway and the North Sea, has observed: "Socialism collapsed because it did not allow the market to tell the economic truth. Capitalism may collapse because it does not allow the market to tell the ecological truth."
As we contemplate mobilizing to save civilization, we see both similarities and contrasts with the mobilization for World War II. In this earlier case, there was an economic restructuring, but it was temporary. Mobilizing to save civilization, in contrast, requires an enduring economic restructuring.
Still, the U.S. entry into World War II offers an inspiring case study in rapid mobilization. Initially, the United States resisted involvement and responded only after it was directly attacked at Pearl Harbor on December 7, 1941. But respond it did. After an all-out commitment, the U.S. engagement helped turn the tide of war, leading the Allied Forces to victory within three-and-a-half years.
In his State of the Union address on January 6, 1942, one month after the bombing of Pearl Harbor, President Roosevelt announced the country's arms production goals. The United States, he said, was planning to produce 45,000 tanks, 60,000 planes, 20,000 anti-aircraft guns, and 6 million tons of merchant shipping. He added, "Let no man say it cannot be done."
No one had ever seen such huge arms production numbers. But Roosevelt and his colleagues realized that the world's largest concentration of industrial power at that time was in the U.S. automobile industry. Even during the Depression, the United States was producing 3 million or more cars a year. After his State of the Union address, Roosevelt met with automobile industry leaders and told them that the country would rely heavily on them to reach these arms production goals. Initially they wanted to continue making cars and simply add on the production of armaments. What they did not yet know was that the sale of new cars would soon be banned. From early 1942 through the end of 1944, nearly three years, there were essentially no cars produced in the United States.
In addition to a ban on the production and sale of cars for private use, residential and highway construction was halted, and driving for pleasure was banned. Strategic goods -- including tires, gasoline, fuel oil, and sugar -- were rationed beginning in 1942. Cutting back on private consumption of these goods freed up material resources that were vital to the war effort.
The year 1942 witnessed the greatest expansion of industrial output in the nation's history -- all for military use. From the beginning of 1942 through 1944, the United States far exceeded the initial goal of 60,000 planes, turning out a staggering 229,600 aircraft, a fleet so vast it is hard even today to visualize it. Equally impressive, by the end of the war more than 5,000 ships were added to the 1,000 or so that made up the American Merchant Fleet in 1939.
In her book No Ordinary Time, Doris Kearns Goodwin describes how various firms converted. A sparkplug factory was among the first to switch to the production of machine guns. Soon a manufacturer of stoves was producing lifeboats, a merry-go-round factory was making gun mounts; a toy company was turning out compasses; a corset manufacturer was producing grenade belts; and a pinball machine plant began to make armor-piercing shells.
In retrospect, the speed of this conversion from a peacetime to a wartime economy is stunning. The harnessing of U.S. industrial power tipped the scales decisively toward the Allied Forces. Winston Churchill often quoted his foreign secretary, Sir Edward Grey: "The United States is like a giant boiler. Once the fire is lighted under it, there is no limit to the power it can generate."
This mobilization of resources within a matter of months demonstrates that a country and, indeed, the world can restructure the economy quickly if convinced of the need to do so. Many people -- although not yet the majority -- are already convinced of the need for a wholesale economic restructuring. The purpose of my book Plan B 3.0 is to convince more people of this need, helping to tip the balance toward the forces of change and hope.
Originally posted at earthpolicy.org.
Adapted from Chapter 13, "The Great Mobilization," of Lester Brown's Plan B 3.0: Mobilizing to Save Civilization (New York: W.W. Norton & Company, 2008), available for free downloading and purchase at earthpolicy.org.
Link to this article: http://gristmill.grist.org/story/2008/12/3/111819/185
Thursday, December 4, 2008
Jason-1 and GRACE satellite data show accelerated melting of continental icepacks is major reason for rise in sea level between 2003 And 2008
Accelerated melting of continental icepacks is major reason for rise in sea level between 2003 and 2008
ScienceDaily, December 2, 2008 — Researchers at the Laboratoire d'Etudes en Géophysique et Océanographie Spatiales (1) (CNRS/Université Toulouse 3/CNES/IRD) and at a subsidiary of CNES (CLS) (2) have discovered that the accelerated melting of continental icepacks is the major reason for the rise in sea level over the 2003 to 2008 period, something which has minimized the effect of thermal expansion of seawater.
This question was resolved thanks to data from the French-American Satellite Jason-1, from two satellites of the GRACE space gravimetry mission and from the buoys of the Argo system. These results have been published online on the website of the journal Global and Planetary Change.
Between 1993 and 2003, the global mean sea level, measured very accurately by the French-American Topex/Poséidon satellites and their successor Jason-1, showed a relatively constant progression of 3 mm/yr. The last GIEC report, published in 2007, showed that more than half of this rise (approximately 1.5 mm/yr) was due to sea water expansion as it warmed up (steric contribution), while 1.2 mm/yr resulted from the reduction in mass of polar ice sheets and mountain glaciers. Since 2003 however, the situation has changed; a quite rapid rise (2.5 mm/yr) in sea water levels is still observed but, over the same period, the warming of the oceans is showing a plateau, only accounting for a rise of 0.4 mm/yr.
Thermal expansion was calculated using two independent methods:
- The Argo network of buoys transmits water temperature and salinity profiles across all of the world's oceans. Since 2003, the analysis of all relevant data in the topmost 900 meters of sea water resulted in a steric contribution of about 0.4 mm/yr.
- This value was independently confirmed by measurements from space by calculating the difference between the water level observed by the altimeters on Topex/Poséidon and Jason-1 and the increase in the ocean volume as witnessed by GRACE. The satellites indicate a steric contribution of 0.3 mm/yr, which is very similar to the value from the Argo buoys.
Consequently, it is above all the increase in the mass of sea water rather than its heat content that is behind the rise in sea level that has been observed since 2003. The increase in the mass of the oceans is equivalent to a rise of 1.9 mm/yr of the mean sea level. What is the source of this extra water in the oceans? Melting continental ice sheets. Data from GRACE has made it possible to measure changes in the mass of the two polar ice sheets in Antarctica and Greenland. These were responsible for a 1 mm/yr increase in sea level (i.e. twice as much as in the previous decade). For mountain glaciers, the most recent estimates from glaciologists show a contribution of 1.1 mm/yr (also higher than during previous years).
Thus, losses from glacial masses can easily account for why the mass of sea water is increasing and are responsible for 80 % of the average rise in sea level in recent years. Given the accelerated melting of glaciers and polar ice sheets, if the steric contribution returned to the values of the 1990s, a rise in sea level of around 4 mm/yr could not be excluded.
Journal reference:
- Cazenave et al., Sea level budget over 2003-2008: A reevaluation from GRACE space gravimetry, satellite altimetry and Argo. Global and Planetary Change, 2008; DOI: 10.1016/j.gloplacha.2008.10.004
Adapted from materials provided by CNRS.
Link to article: http://www.sciencedaily.com/releases/2008/11/081129094609.htm
Link to article: http://www.sciencedaily.com/releases/2008/11/081129094609.htm
North Atlantic cold-water sink (NAO) returns to life: Convective mixing resumes after a decade due to massive loss of Arctic ice
Published online 29 November 2008 | Nature | doi:10.1038/news.2008.1262
News
North Atlantic cold-water sink returns to life
Convective mixing resumes after a decade due to massive loss of Arctic ice.
Scientists have found evidence that convective mixing in the North Atlantic, a mechanism that fuels ocean circulation and affects Earth's climate, has returned after a decade of near stagnation -- thanks, perhaps, to a dramatic loss of sea-ice in the Arctic during the summer of 2007.Convective mixing, or 'overturning', of ocean waters at high latitudes helps to drive the Atlantic 'heat conveyor belt' that carries warm water northwards and cooler deep-water back south.
To read this story in full you will need to login or make a payment.
Link: http://www.nature.com/news/2008/081129/full/news.2008.1262.html
WMO: Atmospheric concentrations of greenhouse gases reached new highs in 2007
Published online 3 December 2008 | Nature 456, 558-559 (2008) | doi:10.1038/456558b
News in Brief
Greenhouse gases hit modern-day highs
Atmospheric concentrations of greenhouse gases reached new highs in 2007, according to the most recent analysis by the World Meteorological Organization (WMO).
Last year, concentrations of carbon dioxide, methane and nitrous oxide (which together contribute 88% of the anthropogenic global-warming effect) were 37%, 156%, and 19% above pre-industrial levels, respectively.
Since 1990, total radiative forcing (the re-radiation of heat back towards Earth's surface) by all long-lived heat-trapping gases has increased by 24%, the WMO reports. In 2007, the average concentration of carbon dioxide rose to 383 ppm, an increase of 0.5% from 2006. Methane and nitrous oxide concentrations also rose, reaching new highs of 1,789 and 321 ppb. The increases are in line with the Intergovernmental Panel on Climate Change's predictions for greenhouse-gas concentrations in a world experiencing rapid economic growth.
Link to article: http://www.nature.com/news/2008/081203/full/456558b.html
M. Mastepanov et al.: Autumn methane burst from frozen tundra explained
Published online 3 December 2008 | Nature | doi:10.1038/news.2008.1275
News
Methane bursts from frozen tundra
Ice build-up may squeeze greenhouse gas from cold soil.
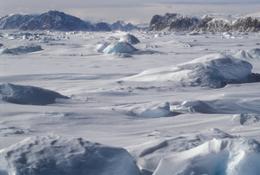 As the Arctic tundra freezes it releases more methane. Punchstock
As the autumn cold begins to bite in the Arctic tundra, the freezing ground releases a large and unexpected burst of methane into the air. The emissions, thought to be squeezed out by the growth of surface frost, match up with an atmospheric methane surge that had previously gone unexplained.
Scientists already knew that microbes breaking down organic debris in the northern wetlands emit considerable amounts of the greenhouse gas methane, a process that has been carefully measured for decades during the growing season. But it was widely assumed that methane production drops to nearly nothing over the winter, because colder soil can absorb more methane and falling temperatures slow the decay processes.
So the research teams that maintain automated methane-monitoring stations in high northern latitudes tended to abandon them around September, explains Torben Christensen, a biogeochemist at Lund University in Sweden.
But last year, as part of the research push for the International Polar Year, a field station in northeastern Greenland stayed open two months later than usual.
In those months, Christensen and his colleagues measured cumulative emissions as large as those recorded over the summer ? with peak rates at some collection points higher than had ever been seen in tundra (see 'A sudden surge of methane'). "I would have predicted the exact opposite finding," says Merritt Turetsky, a tundra expert from the University of Guelph, Canada, who was not involved in the study.
If all wet meadow tundras release a similar methane burst, the authors estimate, a previously unanticipated 4 million tonnes of the gas may be emitted each winter. That amount would not affect established estimates that Arctic wetlands release 30 million to 100 million tonnes of the gas annually. But the finding, reported this week in Nature1, fills a formerly puzzling gap.
Strange hump
Atmospheric scientists measuring methane above the Arctic always saw an unexplained rise in methane levels around autumn, says Edward Dlugokencky of the US National Oceanic and Atmospheric Administration, a co-author of the paper. When the researchers updated models of methane production with emissions from freezing soils throughout high northern latitudes, the results replicated the seasonal emissions hump.
The freezing process itself may squeeze out the surprising burst, the team suggests. As cold sets in, methane-saturated soil is sandwiched between spreading frost at the surface and a floor of permafrost below. Under pressure, the gas could escape via plant stems and roots, which perforate the layers like chimneys, says Christensen.
This is a far cry from the simple relationship between methane production and temperature usually used to model emissions, Turetsky notes.
Chris Field, an ecologist from the Carnegie Institution of Washington in Stanford, California, suggests an alternative mechanism, pointing out that an icy ceiling could block oxygenation of the soil, encouraging slow, methane-producing decay in the unfrozen layer, as opposed to the respiration processes that produce carbon dioxide in well-oxygenated soil.
"It seems to me that we don't exactly know the relative contribution of the squeezing mechanism they describe, compared with changes in the oxygen concentration, and the continued activity of the microorganisms that are still active in the non-frozen parts of the soil profile," says Field. "None of those explanations are inconsistent with the data they present."
But whatever the mechanism behind the new results, says Field, they add detail to geochemical models of Arctic processes. "One of the really important things we've learned about high-latitude processes over the last decade is that clearly a lot of stuff happens during what we had considered to be the wintertime, when everything is frozen and shut down."
Pinning down such details of the natural methane cycle, adds Christensen, could help to predict how climate change-induced thawing in the Arctic may release dangerous amounts of the greenhouse gas. "This will help us understand the starting point for those types of changes."
Link to article above: http://www.nature.com/news/2008/081203/full/news.2008.1275.htmlBen McNeil: Analysis of Southern Ocean -- Oceans becoming more acidic faster and will pose a danger at 450 ppm, not 550 ppm
Environmental Research Web, December 3, 2008
Acidic oceans pose danger to marine animals
Oceans are becoming more acidic as they absorb anthropogenic carbon dioxide and could become dangerous for marine organisms much sooner than we think. Results from an analysis of the Southern Ocean by climate change scientists in Australia suggest that the ocean acidification "tipping point of no return" could occur at just 450 ppm of atmospheric carbon dioxide. This is significantly lower than the value of 550 ppm given by previous estimates.
About one third of the 30 billion tonnes of carbon dioxide emitted into the atmosphere via fossil fuel burning is absorbed in the world's oceans, says Ben McNeil of the University of New South Wales. Continually increasing atmospheric carbon dioxide concentrations are therefore fundamentally altering ocean chemistry by lowering pH.
The tipping point for this acidification is reached when ocean chemistry is altered so much that the calcium carbonate-containing shells of marine organisms such as crustaceans and molluscs start to dissolve. These creatures produce calcium carbonate to help protect themselves, and must produce more as they grow.
Previous estimates indicated that the "dissolution point" for marine shells in the Southern Ocean would occur after atmospheric carbon dioxide concentrations reached 550 ppm. This was projected to occur in the second half of this century.
But by using a new technique that better quantifies natural variations of carbon dioxide in the Southern Ocean, McNeil and colleagues have found that natural processes – such as cool winter temperatures – bring the onset of this dissolution point forward so that it occurs when atmospheric carbon dioxide concentrations reach just 450 ppm. "This could occur as early as 2030 – much earlier than previously thought," McNeil told environmentalresearchweb.
The team, which includes researchers from the Centre for Australian Weather and Climate Research in Hobart, obtained its results by analysing 15-years' worth of carbon dioxide measurements for the surface of the Southern Ocean. The scientists used an empirical technique to estimate seasonal variations in carbon dioxide and pH levels and say that 450 ppm is the point at which the Southern Ocean will become permanently damaging to some calcifying marine organisms. In other words, the effects would be irreversible, states McNeil.
Early ocean acidification might also have a direct or indirect impact on higher organisms like fish or whales that feed on crustaceans or molluscs, he adds.
The researchers say that the only way to prevent this from happening is to stabilise atmospheric levels of carbon dioxide below 450 ppm. To do that, emissions would have to peak by 2015 and be cut in half by 2050.
"Our work provides additional and direct scientific evidence for the world to do everything in its power to limit carbon dioxide concentrations to 450 ppm to avoid the irrevocable consequences associated with ocean acidification," says McNeil.
The results were published in PNAS.
Link to this article (free registration may be required):
http://environmentalresearchweb.org/cws/article/research/36931
John Cook: Latest GRACE satellite data on Greenland mass change (February 2003 -- January 2008)
by John Cook, Skeptical Science, Sunday, 30 November, 2008
Latest satellite data on Greenland mass change
I've just updated the Greenland is losing ice page as a new paper analysing satellite data on Greenland mass change has been released (Wouters 2008). The Gravity Recovery and Climate Experiment (GRACE) measures changes in the Earth's gravity field and found that from February 2003 to January 2008, Greenland lost mass at a rate of 179 Gigatonnes per year. This is equivalent to a global sea level rise of 0.5 mm per year. The rate is also increasing over time, suggesting an acceleration of mass loss.
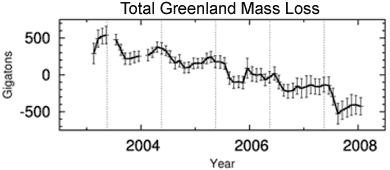
Figure 1. Time series of the monthly GRACE data between February 2003 and January 2008, for the entire Greenland ice sheet.
Figure 1 shows that mass builds up slowly between October and April, followed by rapid loss of mass between May and September. The vertical dashes indicate the middle of May, roughly coinciding with the start of the summer seasons. The paper also compares mass changes in regions below 2000m (eg - coastal regions) with the Greenland interior (above 2000m).

Figure 2. Time series of the monthly GRACE data for regions below 2000 m (top) and regions above 2000 m (bottom).
The interior of Greenland (>2000 m) shows a statistically insignificant positive trend of 7 ± 18 Gt/yr and appears to be in mass balance. It's worth noting that periods of mass loss above 2000 m are generally accompanied by accumulation below 2000 m.
So what we see is the Greenland interior is in mass balance but losing mass around the coastal regions. This equates to an overall mass loss. On average, Greenland contributed 0.5 ± 0.1 mm/yr to global mean sea level rise between 2003 and 2008. Trends are increasingly negative, partly due to the record mass loss during the summer of 2007, when mass loss occurred also at high elevations.Link to site: http://www.skepticalscience.com/news.php?n=49
Sunday, November 30, 2008
UN Framework Convention on Climate Change: Changes Occurring Much Faster Than Expected
Climate change gathers steam, say scientists
AFP, Paris, November 30, 2008
Earth's climate appears to be changing more quickly and deeply than a benchmark UN report for policymakers predicted, top scientists said ahead of international climate talks starting Monday in Poland.
AFP, Paris, November 30, 2008
Earth's climate appears to be changing more quickly and deeply than a benchmark UN report for policymakers predicted, top scientists said ahead of international climate talks starting Monday in Poland.
Evidence published since the Intergovernmental Panel for Climate Change's (IPCC) February 2007 report suggests that future global warming may be driven not just by things over which humans have a degree of control, such as burning fossil fuels or destroying forest, a half-dozen climate experts told AFP.
Even without additional drivers, the IPCC has warned that current rates of greenhouse gas emissions, if unchecked, would unleash devastating droughts, floods and huge increases in human misery by century's end.
But the new studies, they say, indicate that human activity may be triggering powerful natural forces that would be nearly impossible to reverse and that could push temperatures up even further.
At the top of the list for virtually all of the scientists canvassed was the rapid melting of the Arctic ice cap.
"In the last couple of years, Arctic Sea ice is at an all-time low in summer, which has got a lot of people very, very concerned," commented Robert Watson, Chief Scientific Advisor for Britain's department for environmental affairs and chairman of the IPCC's previous assessment in 2001.
"This has implication's for Earth's climate because it can clearly lead to a positive feedback effect," he said in an interview.
When the reflective ice surface retreats, the Sun's radiation -- heat -- is absorbed by open water rather than bounced back into the atmosphere, creating a vicious circle of heating.
"We had always known that the Arctic was going to respond first," said Mark Serreze of the National Snow and Ice Data Center in Boulder, Colorado. "What has us puzzled is that the changes are even faster than we would have thought possible," he said by phone.
New data on the rate at which oceans might rise has also caused consternation.
"The most recent IPCC report was prior to ... the measurements of increasing mass loss from Greenland and Antarctica, which are disintegrating much faster than IPCC estimates," said climatologist James Hansen, head of NASA's Goddard Institute for Space Studies in New York.
Unlike the Arctic ice cap, which floats on water, the world's two major ice sheets -- up to three kilometers (two miles) thick -- sit on land.
Runaway sea level rises, Hansen said, would put huge coastal cities and agricultural deltas in Bangladesh, Egypt and southern China under water, and create hundreds of millions of refugees.
The IPCC's most recent assessment "did not take into account the potential melting of Greenland, which I think was a mistake," said Watson, the former IPCC chairman.
Were Greenland's entire ice block to melt, it would lift the world's sea levels by almost seven meters (22.75 feet), while western Antarctica's ice sheet holds enough water to add six metres (20 feet).
Neither of these doomsday scenarios is on the foreseeable horizon.
But for coastal dwellers, even a relatively small loss of their ice could prove devastating.
IPCC estimates of an 18-to-59 centimetre (7.2-to-23.2 inches) rise by 2100 has been supplanted among specialists by an informal consensus of one metre (39 inches), said Serreze.
The accelerating concentration of greenhouse gases in the atmosphere, and signs of the planet's dwindling ability to absorb them, are also causing some scientists to lose sleep.
During the 1970s, there were on average 1.3 parts per million (ppm) of carbon dioxide -- the main greenhouse gas -- in the air. In the 1980s the figure was 1.6 ppm, and in the 1990s 1.5 ppm.
In the period 2000-2007, however, the concentration jumped to an average 2.0 ppm, with a high of 2.2 last year, according to the Global Carbon Project, based in Australia.
"The present concentration is the highest during the last 650,000 years and probably during the last 20 million years," said the Global Carbon Project's Pep Canadell, a researcher at Australia's Commonwealth Scientific and Industrial Research Organisation.
And in 2008, he said, there has been an "exponential growth" in the atmospheric concentration of methane, another greenhouse gas that is an even more potent driver of global warming than CO2.
One potential source of both gases is frozen tundra in the Arctic and sub-Arctic regions, where temperatures have risen faster than anywhere else on Earth.
"The amount of carbon that is locked up in permafrost that could be released into the atmosphere is just about on a par with the atmospheric load the world has right now," said Serreze.
These higher concentrations of greenhouse gases come at a time when Earth's two major "carbon sinks" -- forests and especially oceans -- are showing signs of saturation.
The December 1-12, 2008, forum of the 192-member UN Framework Convention on Climate Change (UNFCCC) comes midway through a two-year process launched in Bali for braking the juggernaut of global warming.
Scheduled to run until December 12, the talks are a stepping stone towards a new pact -- due to be sealed in Copenhagen in December 2009 -- for reducing emissions and boosting adaptation funds beyond 2012, when the current provisions of the UN's Kyoto Protocol expire.
Link to article: http://www.spacedaily.com/2006/081130055637.szeh21pj.html
European Space Agency: Wilkins Ice Shelf breaking up

Click on image to enlarge the detail.
European Space Agency, 28 November 2008
New rifts have developed on the Wilkins Ice Shelf that could lead to the opening of the ice bridge that has been preventing the ice shelf from disintegrating and breaking away from the Antarctic Peninsula.
The ice bridge connects the Wilkins Ice Shelf to two islands, Charcot and Latady. As seen in the Envisat image above acquired on 26 November 2008, new rifts (denoted by colourful lines and dates of the events) have formed to the east of Latady Island and appear to be moving in a northerly direction.
Dr Angelika Humbert from the Institute of Geophysics, Münster University, and Dr Matthias Braun from the Center for Remote Sensing, University of Bonn, spotted the newly formed rifts during their daily monitoring activities of the ice sheet via Envisat Advanced Synthetic Aperture Radar (ASAR) acquisitions.
"These new rifts, which have joined previously existing rifts on the ice shelf (blue dotted line), threaten to break up the chunk of ice located beneath the 21 July date, which would cause the bridge to lose its stabilisation and collapse," Humbert explained. "These recent changes are happening slower and more continuously than the events we saw earlier this year."
 |  |
Wilkins Ice Shelf: 20-26 November |
The Wilkins Ice Shelf, a broad plate of floating ice south of South America on the Antarctic Peninsula, had been stable for most of the last century before it began retreating in the 1990s. The peninsula has been experiencing extraordinary warming in the past 50 years of
If the ice shelf breaks away from the peninsula, it will not cause a rise in sea level since it is already floating. However, ice shelves on the Antarctic Peninsula are sandwiched by extraordinarily raising surface air temperatures and a warming ocean, making them important indicators for on-going climate change.
Long-term satellite monitoring over Antarctica is important because it provides authoritative evidence of trends and allows scientists to make predictions. Over the last 17 years, ESA’s ERS and Envisat satellite missions have been the main vehicles for testing and demonstrating the use of Earth Observation data in Polar Regions.
 | |
Break-ups of Larsen |
Envisat’s ASAR instrument is particularly suited to acquire images over Antarctica during the local winter period because it is able to produce high-quality images through bad weather and darkness, conditions often found in the area.
Daily ASAR images of Antarctica are easily accessible to scientists. ESA will publish an update about the status of the Wilkins Ice Shelf in the event of a break-up.Link to European Space Agency website and article:
http://www.esa.int/esaCP/SEMXK5AWYNF_index_0.html
Friday, November 28, 2008
Phil Berardelli: Did Icebergs Warm the World?
Did Icebergs Warm the World?
by Phil Berardelli, ScienceNOW Daily News, 21 November 2008
Rube Goldberg is alive and well in the climate record. In an effort to explain several spikes in global carbon dioxide (CO2) levels during the last ice age, researchers have come up with the following scenario: Fresh water flooded the North Atlantic Ocean, which slowed ocean circulation, which impeded the transport of nutrients to the ocean's food web, which starved CO2-consuming organisms that form the basis of that web, which resulted in CO2 buildup in the atmosphere, which eventually heated Greenland and possibly much of the world. The biggest surprise is the probable source of the fresh water that got the whole thing started: rogue icebergs.
Setting Earth's thermostat isn't easy. It's determined by a combination of many interconnected factors, local and global, each of which can impact any or all of the others. One such factor is the huge underwater current known as the North Atlantic Deep Water--or the Conveyor Belt--which begins off Greenland and encircles the globe. The current has long been suspected of helping to drive climate change, though exactly how has remained unknown. Climate scientists have also been curious about three seemingly unrelated but simultaneous developments that occurred on and off during the last half of the most recent ice age, between 65,000 and 13,000 years ago: a drop in salinity in the North Atlantic, a distinct chemical change in ocean sedimentary layers around the world, and sudden cooling and even more sudden heating in Greenland.
Climate scientists Andreas Schmittner of Oregon State University, Corvallis, and Eric Galbraith of Princeton University developed a computer model to see if they could connect ancient climate upheavals to ocean circulation. They designed the model to mimic present-day conditions, but they dropped temperatures to ice-age levels. Then, they flooded their virtual North Atlantic with fresh water and watched what happened. "We hit our climate machine with a big hammer," Galbraith says.
As the researchers report this week in Nature, the action created the climate cascade described above, building up CO2 over a millennium and warming Greenland by as much as 16°C. Then, after a few more millennia, the process repeated, just like in the geological records.
The model shows that disruptions in the North Atlantic Deep Water are "tightly linked to CO2" in the atmosphere, Galbraith says. "This had been a vexingly difficult relationship to understand," he adds, "but these simulations show a remarkably simple way to connect them." And where did all the freshwater come from? Galbraith says the most likely source was periodic melting of migrating icebergs from northern Canada and Eurasia, which broke off from the massive polar ice sheets.
"People have been saying for years that we don't understand what makes the level of CO2 in the atmosphere go up and down during the ice ages," says oceanographer J. R. Toggweiler of the Princeton-based National Oceanic and Atmospheric Administration Geophysical Fluid Dynamics Laboratory. But the paper explains the phenomenon "very nicely by a simple change in the oceanic circulation," says Toggweiler, who was not involved in the study. In terms of applications, climate scientist Claire Parkinson of NASA's Goddard Space Flight Center in Greenbelt, Maryland, says that understanding the ocean's past cycles can help researchers predict "how much the ocean can continue to be a sink for carbon dioxide and other greenhouse gases."
Link to article: http://sciencenow.sciencemag.org/cgi/content/full/2008/1121/3
by Phil Berardelli, ScienceNOW Daily News, 21 November 2008
Rube Goldberg is alive and well in the climate record. In an effort to explain several spikes in global carbon dioxide (CO2) levels during the last ice age, researchers have come up with the following scenario: Fresh water flooded the North Atlantic Ocean, which slowed ocean circulation, which impeded the transport of nutrients to the ocean's food web, which starved CO2-consuming organisms that form the basis of that web, which resulted in CO2 buildup in the atmosphere, which eventually heated Greenland and possibly much of the world. The biggest surprise is the probable source of the fresh water that got the whole thing started: rogue icebergs.
Setting Earth's thermostat isn't easy. It's determined by a combination of many interconnected factors, local and global, each of which can impact any or all of the others. One such factor is the huge underwater current known as the North Atlantic Deep Water--or the Conveyor Belt--which begins off Greenland and encircles the globe. The current has long been suspected of helping to drive climate change, though exactly how has remained unknown. Climate scientists have also been curious about three seemingly unrelated but simultaneous developments that occurred on and off during the last half of the most recent ice age, between 65,000 and 13,000 years ago: a drop in salinity in the North Atlantic, a distinct chemical change in ocean sedimentary layers around the world, and sudden cooling and even more sudden heating in Greenland.
Climate scientists Andreas Schmittner of Oregon State University, Corvallis, and Eric Galbraith of Princeton University developed a computer model to see if they could connect ancient climate upheavals to ocean circulation. They designed the model to mimic present-day conditions, but they dropped temperatures to ice-age levels. Then, they flooded their virtual North Atlantic with fresh water and watched what happened. "We hit our climate machine with a big hammer," Galbraith says.
As the researchers report this week in Nature, the action created the climate cascade described above, building up CO2 over a millennium and warming Greenland by as much as 16°C. Then, after a few more millennia, the process repeated, just like in the geological records.
The model shows that disruptions in the North Atlantic Deep Water are "tightly linked to CO2" in the atmosphere, Galbraith says. "This had been a vexingly difficult relationship to understand," he adds, "but these simulations show a remarkably simple way to connect them." And where did all the freshwater come from? Galbraith says the most likely source was periodic melting of migrating icebergs from northern Canada and Eurasia, which broke off from the massive polar ice sheets.
"People have been saying for years that we don't understand what makes the level of CO2 in the atmosphere go up and down during the ice ages," says oceanographer J. R. Toggweiler of the Princeton-based National Oceanic and Atmospheric Administration Geophysical Fluid Dynamics Laboratory. But the paper explains the phenomenon "very nicely by a simple change in the oceanic circulation," says Toggweiler, who was not involved in the study. In terms of applications, climate scientist Claire Parkinson of NASA's Goddard Space Flight Center in Greenbelt, Maryland, says that understanding the ocean's past cycles can help researchers predict "how much the ocean can continue to be a sink for carbon dioxide and other greenhouse gases."
Link to article: http://sciencenow.sciencemag.org/cgi/content/full/2008/1121/3
WWF: 2 degree rise could cause Greenland ice sheet meltdown
Two degree rise could spark Greenland ice sheet meltdown: WWF
Yahoo News 27 Nov 08
GENEVA (AFP) – A less than two degree Celsius rise in global temperatures might be sufficient to spark a meltdown of the Greenland Ice Sheet and Arctic sea ice, the WWF warned in a new study released Thursday.
"Scientists now suggest that even warming of less than 2 degree Celsius might be enough to trigger the loss of Arctic sea ice and the meltdown of the Greeland Ice Sheet," the WWF said in a statement to accompany the findings.
"As a result, global sea levels would rise by several metres, threatening tens of millions of people worldwide."
The melting of Arctic sea ice could affect ecosystems, while a meltdown of the Greenland Ice Sheet could lead to a sea level rise of up to seven metres, with a devastating impact for the rest of the world.
The WWF urged governments meeting for UN climate talks in Poland starting Monday to "develop a strong negotiation text for a new climate treaty" due at the end of next year.
Kim Carstensen, WWF Global Climate Initiative leader said: "The early meltdown of ice in the Arctic and Greenland may soon prompt further dangerous climate feedbacks accelerating warming faster and stronger than forecast.
"Responsible politicians cannot dare to waste another second on delaying tactics in the face of these urgent warnings from nature."
Cassandra Brooks: No Recovery for Atlantic Cod Population
No Recovery for Atlantic Cod Population
by Cassandra Brooks, ScienceNOW Daily News, 25 November 2008
A new study predicts for the first time that a major population of Atlantic cod, near Newfoundland, Canada, will essentially go extinct within 20 years, despite best attempts to manage it. "This is the most shocking and disturbing news I've ever heard about a marine fish population," says fisheries biologist Jeffrey Hutchings of Dalhousie University in Halifax, Canada.
Atlantic cod is a symbol of boom-and-bust commercial fishing. After 50 years of heavy harvesting in the late 20th century, the Canadian cod fishery collapsed in the early 1990s. Total bans ensued, and fisheries managers expected to see a recovery. However, after 15 years of little to no fishing, local populations show no sign of rebounding. In fact, some will continue to spiral downward, according to projections reported in this month's issue of the Canadian Journal of Fisheries and Aquatic Sciences.
Biologists Douglas Swain and Ghislain Chouinard of Canada's Department of Fisheries and Oceans used well-established models of fishery stocks to predict the future of the fourth largest population of cod, in the southern Gulf of St. Lawrence, southwest of Newfoundland. The models took into account the population's productivity, based on the proportion of young fish that mature, the growth of adults, and natural mortality rates. The results were sobering: The southern Gulf cod stock will be extirpated (local extinction defined as less than 0.3% of the species' original biomass) within 20 years if limited fishing is allowed. Even if the fishery is completely closed, the stock will hit rock bottom in 38 years.
The main problem, according to Swain and Chouinard, is that adult cod have been dying at an unusually high rate in recent years. No one knows why, but Swain suspects the cause might be increased predation by seals. The problem may be more widespread: The neighboring Scotian Shelf cod population also took a nosedive in the 1990s based on data from a Canadian report published in 2003. Furthermore, while most other cod populations off Canada appear to be stable, the same could have been said about the southern Gulf population up until a few years ago, says Swain.
Although biologists have traditionally assumed that stocks will rebound if fishers simply stop fishing, Hutchings notes, the new study of cod is an "extremely compelling example of the fallacy of that assumption." As for extirpation of a cod population, Hutchings says he never considered it possible until this analysis. However, fisheries biologist Ralph Mayo of the National Oceanic and Atmospheric Administration in Woods Hole, Massachusetts, says the outlook could be better for smaller U.S. cod stocks in the Gulf of Maine and on Georges Bank. "The Gulf of Maine population has even been increasing," he says. That, of course, is small consolation for Canada.
Link to article: http://sciencenow.sciencemag.org/cgi/content/full/2008/1125/1
by Cassandra Brooks, ScienceNOW Daily News, 25 November 2008
A new study predicts for the first time that a major population of Atlantic cod, near Newfoundland, Canada, will essentially go extinct within 20 years, despite best attempts to manage it. "This is the most shocking and disturbing news I've ever heard about a marine fish population," says fisheries biologist Jeffrey Hutchings of Dalhousie University in Halifax, Canada.
Atlantic cod is a symbol of boom-and-bust commercial fishing. After 50 years of heavy harvesting in the late 20th century, the Canadian cod fishery collapsed in the early 1990s. Total bans ensued, and fisheries managers expected to see a recovery. However, after 15 years of little to no fishing, local populations show no sign of rebounding. In fact, some will continue to spiral downward, according to projections reported in this month's issue of the Canadian Journal of Fisheries and Aquatic Sciences.
Biologists Douglas Swain and Ghislain Chouinard of Canada's Department of Fisheries and Oceans used well-established models of fishery stocks to predict the future of the fourth largest population of cod, in the southern Gulf of St. Lawrence, southwest of Newfoundland. The models took into account the population's productivity, based on the proportion of young fish that mature, the growth of adults, and natural mortality rates. The results were sobering: The southern Gulf cod stock will be extirpated (local extinction defined as less than 0.3% of the species' original biomass) within 20 years if limited fishing is allowed. Even if the fishery is completely closed, the stock will hit rock bottom in 38 years.
The main problem, according to Swain and Chouinard, is that adult cod have been dying at an unusually high rate in recent years. No one knows why, but Swain suspects the cause might be increased predation by seals. The problem may be more widespread: The neighboring Scotian Shelf cod population also took a nosedive in the 1990s based on data from a Canadian report published in 2003. Furthermore, while most other cod populations off Canada appear to be stable, the same could have been said about the southern Gulf population up until a few years ago, says Swain.
Although biologists have traditionally assumed that stocks will rebound if fishers simply stop fishing, Hutchings notes, the new study of cod is an "extremely compelling example of the fallacy of that assumption." As for extirpation of a cod population, Hutchings says he never considered it possible until this analysis. However, fisheries biologist Ralph Mayo of the National Oceanic and Atmospheric Administration in Woods Hole, Massachusetts, says the outlook could be better for smaller U.S. cod stocks in the Gulf of Maine and on Georges Bank. "The Gulf of Maine population has even been increasing," he says. That, of course, is small consolation for Canada.
Link to article: http://sciencenow.sciencemag.org/cgi/content/full/2008/1125/1
Subscribe to:
Posts (Atom)

 Posts
Posts






