Residents in Colorado are recovering from extremely rare precipitation the second week of September that was ten times greater than the average precipitation for this time of year. On September 19, 2013, Usagi reached “Super-typhoon” status with wind gusts over 160 miles per hour (over 71 meters per second). Better predictions about these events in real time are saving lives. At the same time, scientists are studying these events with more urgency so even more lives can potentially be saved. What does the latest science tell us about these rare events? And what about the recent trend in global average surface air temperature that has been in the news of late?
The Intergovernmental Panel on Climate Change (IPCC) is poised to release the latest climate assessment “summary for policymakers” in Stockholm, Sweden, when they meet September 23–26, 2013, where these hot topics will be addressed.
Nearly all global indicators show “full speed ahead” for trends consistent with human-influenced climate change
 This post is part of a series on
The Intergovernmental Panel on Climate Change (IPCC)
Subscribe to the series RSS feed.
Even as a car slows down to go over a “speed bump,” there is no question the car is still advancing down the road. Similarly, the global average surface temperature trend of late is like a “speed bump” and we would expect the rate of temperature increase to speed up again just as most drivers do after clearing the speed bump.
We keep getting questions about this air temperature trend that has more to do with where the excess heat is primarily going — the ocean — and the rate at which heat transfers to the deep ocean, as well as other factors that can temporarily offset the influence of heat-trapping gases. These include ocean cycles such as phases of the El Niño Southern Oscillation (ENSO) in the Pacific Ocean. Or tiny pollution particles as well as tiny particles emanating from volcanic eruptions that reflect sunlight.
More importantly, society tends to focus quite heavily on the surface temperature since that is where most of us live our daily lives. We know that is just one of the many ways we measure climate change. A look at the big picture shows a world that continues to face disruption from human-induced climate change. Each indicator has a different period of length for rates of change that you can check out in these hyperlinks: ocean heat content, global sea level rise, global sea surface temperature, global surface temperature, Arctic minimum sea ice extent, and reference glaciers cumulative mass.
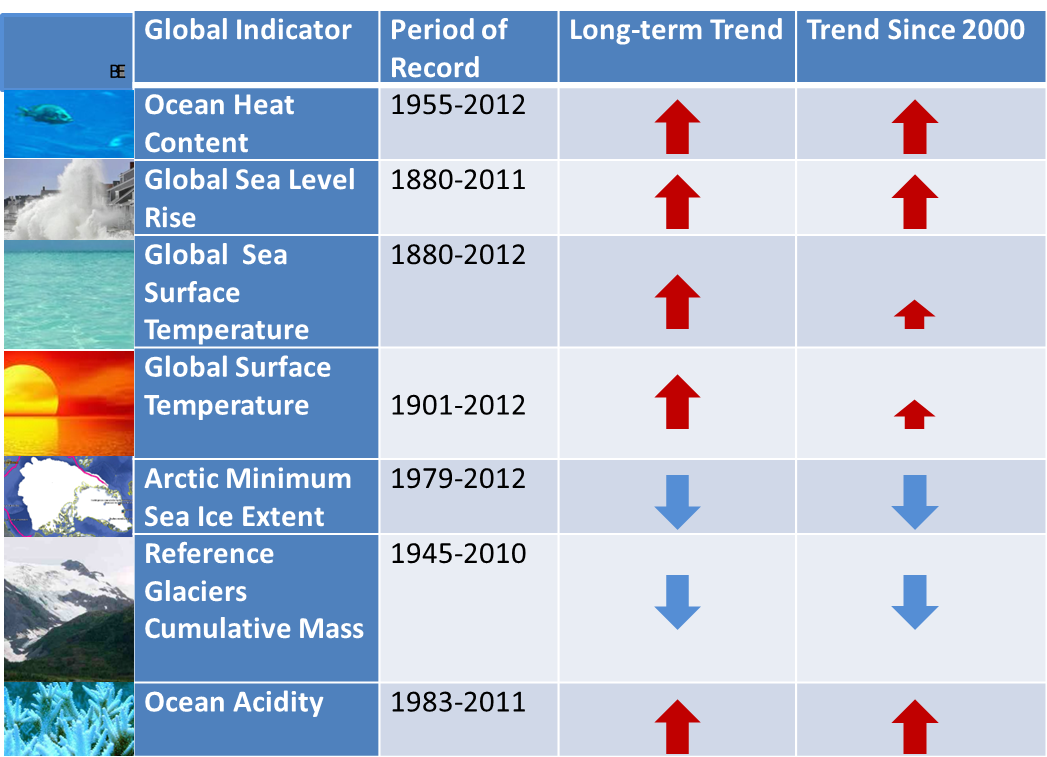
Globally, many indicators show a comprehensive view that the climate system is changing: the ocean and atmosphere are warming, sea level is rising, snow and ice is diminishing – at unprecedented rates. Data source: EPA Indicators graphs with period of record available as of September 24, 2013. Table created for this post.
Look for the IPCC to place extreme events in context
Scientists have long understood that weather events spawn within a background state of conditions that climate change influences, such as seasonal sea surface temperature, ice extent, water vapor volume in the atmosphere, etc. The most extreme of these weather events can wreak havoc on communities that suffer exposure to such monstrous calamities. In a few days, look to the IPCC summary to shed light on the latest science.
Since the IPCC issued a special report on extreme events in 2012, we know that the observed historic record can only get us so far in our understanding since by definition these events are very rare. However, over just the past few years, the science has advanced to the point where models can simulate conditions surrounding similar extreme events. Unlike Earth, these can be investigated in ways that can increase confidence in the statistical outcomes regarding similar types of extreme events. Using such evidence, scientists declared that flooding conditions in Thailand in 2011 were from rains in the normal range. Unfortunately, the exposed communities had other risks that conspired to make such an event a tragic disaster in Thailand. On the other hand, investigations into the severe Texas drought in 2011 and the historic storm surge from Hurricane Sandy that battered the U.S. East Coast around Halloween 2012 indicate that the severity of these events have links with a changing climate.
Community planners are doing what they can to incorporate climate change projections of the future to better prepare for even more extreme events going forward. Especially given the limited budgets of local communities, this focus by regional planners is a heroic public service. In many ways I think of these planners as the real “first responders” of the extreme events of the future.


No comments:
Post a Comment