The global temperature data for 2013 are now published. 2010 and 2005 remain the warmest years since records began in the 19th century. 1998 ranks third in two records, and in the analysis of Cowtan and Way, which interpolates the data-poor region in the Arctic with a better method, 2013 is warmer than 1998 (even though 1998 was a record El Nino year, and 2013 was neutral).
The end of January, when the temperature measurements of the previous year are in, is always the time to take a look at the global temperature trend. (And, as the Guardian noted aptly, also the time where the “climate science denialists feverishly yell [...] that global warming stopped in 1998.”) Here is the ranking of the warmest years in the four available data sets of the global near-surface temperatures (1):
Rank
| ||||
1
|
2010
|
2010
|
2010
|
2010
|
2
|
2005
|
2005
|
2005
|
2005
|
3
|
2007
|
1998
|
1998
|
2007
|
4
|
2002
|
2013
|
2003
|
2009
|
5
|
1998
|
2003
|
2006
|
2013
|
New this year: for the first time there is a careful analysis of geographical data gaps – especially in the Arctic there’s a gaping hole – and their interpolation for the HadCRUT4 data. Thus there are now two surface temperature data sets with global coverage (the GISTEMP data from NASA have always filled gaps by interpolation). In these two data series 2007 is ranked 3rd. Their direct comparison is shown in the figure below.
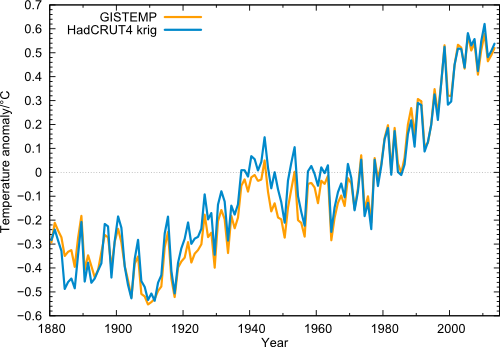
Figure 1 Global temperature (annual values) in the data from NASA GISS (orange) and from Cowtan & Way (blue), i.e., HadCRUT4 with interpolated data gaps.
One can clearly see the extreme year 1998, which (thanks to the record-El Niño) stands out above the long-term trend like no other year. But even taking this outlier year as starting point, the linear trend 1998-2013 in all four data sets is positive. Also clearly visible is 2010 as the warmest year since records began, and the minima in the years 2008 and 2011/2012. But just like the peaks are getting higher, these minima are less and less deep.
In these data curves I cannot see a particularly striking or significant current “warming pause”, even though the warming trend from 1998 is of course less than the long-term trend. Even in Nature, there was recently a (journalistic) contribution that in its introduction strongly overstated this alleged “hiatus”. It makes a good story that perhaps some cannot resist. (“Warming trend is somewhat reduced, but within the usual range of variation” simply does not make good headline.)
The role of El Niño and La Niña
The recent slower warming is mainly explained by the fact that in recent years the La Niña state in the tropical Pacific prevailed, in which the eastern Pacific is cold and the ocean stores more heat (2). This is due to an increase in the trade winds that push water westward across the tropical Pacific, while in the east cold water from the depths comes to the surface (see last graph here). In addition, radiative forcing has recently increased more slowly (more on this in the analysis of Hansen et al. – definitely worth a read).
NASA shows the following graphic, where you can see that the warmer years tend to be those with an El Niño in the tropical Pacific (red years), while the particularly cool years are those with La Niña (blue years).
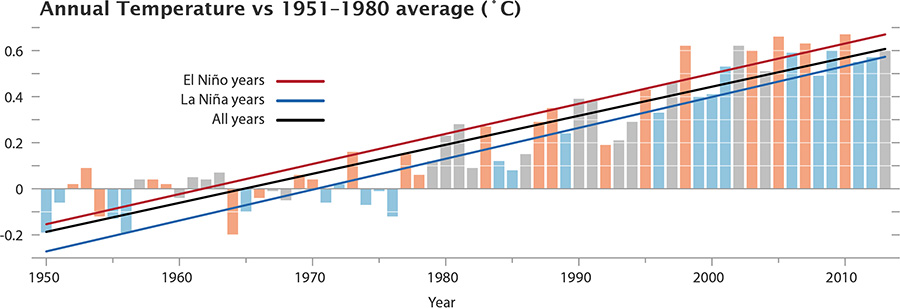
Figure 2. The GISS data, with El Niño and La Niña conditions highlighted. Neutral years like 2013 are gray. Source: NASA.
Quality of the interpolation
How good is the interpolation into regions not regularly covered by weather stations? In any case, of course, better than simply ignoring the gaps, as the HadCRUT and NOAA data have done so far. The truly global average is important, since only it is directly related to the energy balance of our planet and thus the radiative forcing by greenhouse gases. An average over just part of the globe is not. The Arctic has been warming disproportionately in the last ten to fifteen years.
But how well the interpolation works we know only since the important work of Cowtan and Way. These colleagues have gone to the trouble of carefully validating their method. Although there are no permanent weather stations in the Arctic, there is intermittent data from buoys and and from weather model reanalyses with which they could test their method. For the last few decades and Cowtan and Way also make use of satellite data (more on this in our article on underestimated warming). I therefore assume that the data from Cowtan and Way is the methodologically best estimate of the global mean temperature which we currently have. This correction is naturally small (less than a tenth of a degree) and hardly changes the long-term trend of global warming – but if you look deeper into shorter periods of time, it can make a noticeable difference. The comparison with the uncorrected HadCRUT4 data is shown in the figure below.
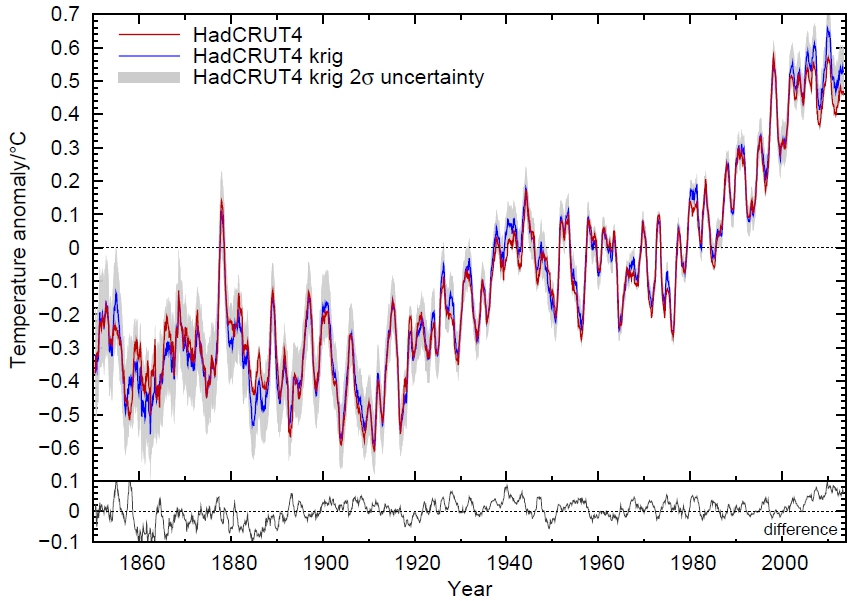
Figure 3. Comparison of interpolated and non-interpolated HadCRUT4 data, as moving averages over 12 months. Source: Kevin Cowtan, University of York.
And here’s a look at the last years in detail:
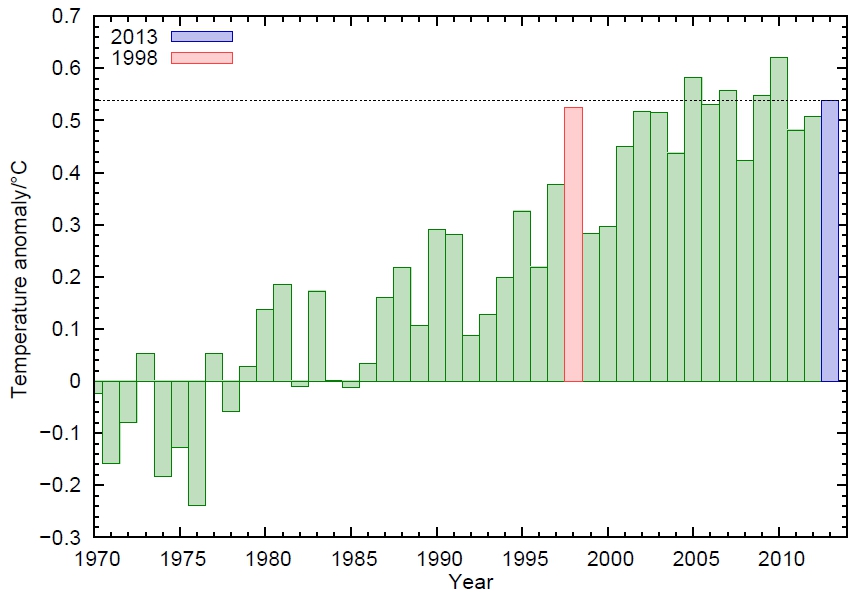
Figure 4. The interpolated HadCRUT4 data (annual average) from 1970. Source: Kevin Cowtan, University of York.
Following this analysis, 2013 was thus even warmer than the record El-Niño-year 1998.
Conclusion
- In all four data series of the global near-surface air temperature, the linear trend even from the extreme El Niño year 1998 is positive, i.e. shows continued warming, despite the choice of a warm outlier as the initial year.
- In all four data series of the global near-surface air temperature, 2010 was the warmest year on record, followed by 2005.
- The year 1998 is, at best, rank 3 – in the currently best data set of Cowtan & Way, 1998 is actually only ranked 7th. Even 2013 is – without El Niño – warmer there than 1998.
The German news site Spiegel Online presents these facts under the headline Warming of the air paused for 16 years (my translation). The headline of the NASA news release, NASA Finds 2013 Sustained Long-Term Climate Warming trend, is thus completely turned on its head.
This will not surprise anyone who has followed climate reporting of Der Spiegel in recent years. To the contrary – colleagues express their surprise publicly when a sensible article on the subject appears there. For years, Der Spiegel has acted as a gateway for dubious “climate skeptics” claims into the German media whilst trying to discredit top climate scientists (we’ve covered at least one example here).
Do Der Spiegel readers know more (as their advertising goes) – more than NASA, NOAA, Hadley Centre and the World Meteorological Organization WMO together? Or are they simply being taken for a ride for political reasons?
Footnotes
(1) In addition to the data of the near-surface temperatures, which are composed of measurements from weather stations and sea surface temperatures, there is also the microwave data from satellites, which can be used to estimate air temperatures in the troposphere in a few kilometers altitude. In the long-term climate trend since the beginning of satellite measurements in 1979, the tropospheric temperatures show a similar warming as the surface temperatures, but the short-term fluctuations in the troposphere are significantly different from those near the surface. For example, the El Niño peak in 1998 is about twice as high as in the surface data in the troposphere, see Foster and Rahmstorf 2011. In their trend from 1998 , the two satellite series contradict each other: UAH shows +0.05 °C per decade (a bit more than HadCRUT4), RSS shows -0.05 °C per decade.
(2) Another graphic (Figure 5) illustrates the change between El Niño and La Niña: the Oceanic Niño Index ONI, the standard index of NOAA to describe the seesaw in the tropical Pacific.
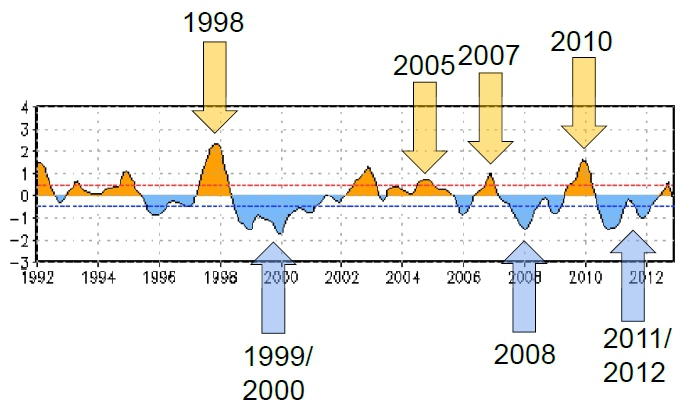
Figure 5. The ONI index. The arrows added by me point to some of the globally warm or cool years (compare Figure 1 or 4). Source: NOAA.
Weblinks
The global temperature jigsaw (an overview over the “pause” debate)
What ocean heating reveals about global warming
What ocean heating reveals about global warming


No comments:
Post a Comment