

A sudden stratospheric warming split the polar vortex in two in mid-January. Since then, the northern hemisphere's atmospheric circulation has been behaving very strangely. An area of extreme high pressure formed over the Arctic ocean and lasted for months. It formed in response to prolonged subsidence of air from high above caused by the slow cooling of the bubble of warm air that invaded the stratosphere. High pressure at the pole and a very weak polar vortex pushed cold air out of the Arctic towards north America and western Europe. Weather in the U.S. and Europe in February, March and April was exceptionally cold because polar air pouring out of the Arctic.
In May the pressure patterns reversed. Siberia ran out of cold air by the end of April. The weak atmospheric circulation retreated north very rapidly as the long days brought strong solar heating to northern latitudes. The escape of the Arctic cold air in early spring led to an extraordinarily fast snow melt in Siberia in May. A record minimum area of Eurasia was covered by snow in May.
 This snow cover anomaly map shows the difference between snow cover for May 2013, compared with average snow cover for May from 1971 to 2000. Areas in orange and red indicate lower than usual snow cover, while regions in blue had more snow than normal.
Weekly and daily data from the Global Snow Lab show that May began with greater-than-average snow cover in Tibet and the Great Plains of Canada and the United States. By the end of the month, however, snow extent was near average to lower than average throughout the Northern Hemisphere, and much lower than average in northeastern Siberia. Overall, snow cover in May 2013 was the lowest on record in 47 years of data for Eurasia, and third lowest overall for the Northern Hemisphere, trailing only 2012 and 2010.Heat built up over Siberia over the first three weeks of May as the snow retreated, causing the whole lower atmosphere to thicken over Eurasia. However, the ice covered Arctic ocean stayed cold. A strong gradient in both temperature and atmospheric thickness developed around the Arctic ocean, causing a storm to develop around May 20. An unbroken series of cyclones has continued since then.
June 10, 2013, is the 20th day of unbroken storminess over the Arctic Ocean

The GFS and European weather models predict the storms to continue unabated for at least 10 more days. Low pressure tends to form around the North Pole in summer months, but there is only one year in the weather records that had anything like this degree of persistence of storminess over the Arctic Ocean: 1989. In February 1989 a strong sudden stratospheric warming split the polar vortex in two. The polar vortex was weak the rest of the winter, and the 500-mb circulation collapsed towards the Arctic ocean in May 1989.

June 1989 had persistent polar cyclones. Both 1989 and 2013 had stronger than normal winds across the tropical Pacific ocean that built of the deep pool of warm water around Indonesia to greater depths and higher temperatures than normal. Tropical convection over that warm pool pushed warm air up towards the stratosphere, and a wave developed over the Himalayas and Tibetan plateau, causing a sudden stratospheric warming. In both 1989 and 2013, the warming was so intense that the polar vortex split in two.
But this June is not identical to 1989 because there is more heat, less snow and thinner ice this year. Serreze and Barrett (2007, doi: 10.1175/2007JCLI1810.1) analyzed the proximate causes of the persistent storms of 1989, but they did not mention the sudden stratospheric warming and polar vortex weakening in February 1989 that led to it. Screen, Simmonds and Keay (J. Geophys. Res., Vol. 116, D15105, doi:10.1029/2011JD015847, 2011) determined that years with stormy May, June, July periods tend to have increases in sea ice areas because of increased cloudiness and weakening of the trans polar drift towards the Fram strait. If 2013 had the same amount and thickness of multi-year ice as in 1989, the sea ice extent this September would be expected to be higher than the extent last September.
The thinning of the ice and the almost complete loss of multi-year ice in the summer of 2007 have changed the dynamics, however. In 2011, Rampal and others (2011, doi: 10.1029/2011JC007110) found that IPCC models had failed to account for the observed acceleration in ice drift speed. Thinner, younger ice is more mobile.
Ice drift speed since 1979
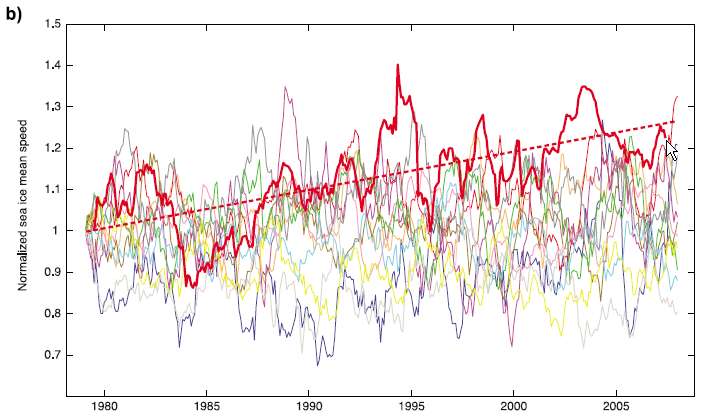 The observed ice drift speed (red line) is trending ( broken red line) up as the ice thins. IPCC models failed to predict the faster drift of thinner Arctic sea ice.
 The observed ice drift speed (red line) is trending ( broken red line) up as the ice thins. IPCC models failed to predict the faster drift of thinner Arctic sea ice.
The stormy May and June we are going through now should be reducing the loss of sea ice. However, the old rules don't seem to be working. The thick, multi-year ice that dams up on the coast of Greenland and Canada extended well into the Siberian side of the Arctic ocean in 1989. Now the final remnant of thick old ice is clinging to the Canadian archipelago and squeezed like toothpaste flowing out of a tube along the north coast of Greenland. In 1989, the thick multi-year ice resisted cyclonic winds, so the ice didn't move out of the central Arctic. Today's thin first-year ice is shattering and flowing in the central Arctic.
Moreover, last winter's very high pressure over the pole (very positive Arctic Oscillation index) reduced the thickness of the fresh water layer, increasing the temperature and salinity beneath the ice. Ignatius Rigor identified the ice thinning effect of a high AO index in his PhD dissertation in 2005.
Very high pressure followed the sudden stratospheric warming in January 2013. The strong anticyclone pulled warm Atlantic water into the Arctic and reduced the thickness of the low salinity layer below the ice, increasing heating from below.

Now storm winds are shattering the exceptionally thin ice in the central Arctic. Images of ice concentration have shown persistent rapid declines for the past two weeks. The cloud locations have moved over the past 2 weeks, so it is becoming clear that the ice really is thinning and breaking up in response to the storms. The ice concentration declines in the central Arctic appear to be real, not artifacts of clouds. The rapid declines are appearing in models and persisting in multiple data sets.
The University of Bremen SSMI Ice Concentration Image for June 9 shows a huge, probably unprecedented, area of reduced sea ice concentration in the central Arctic ocean.
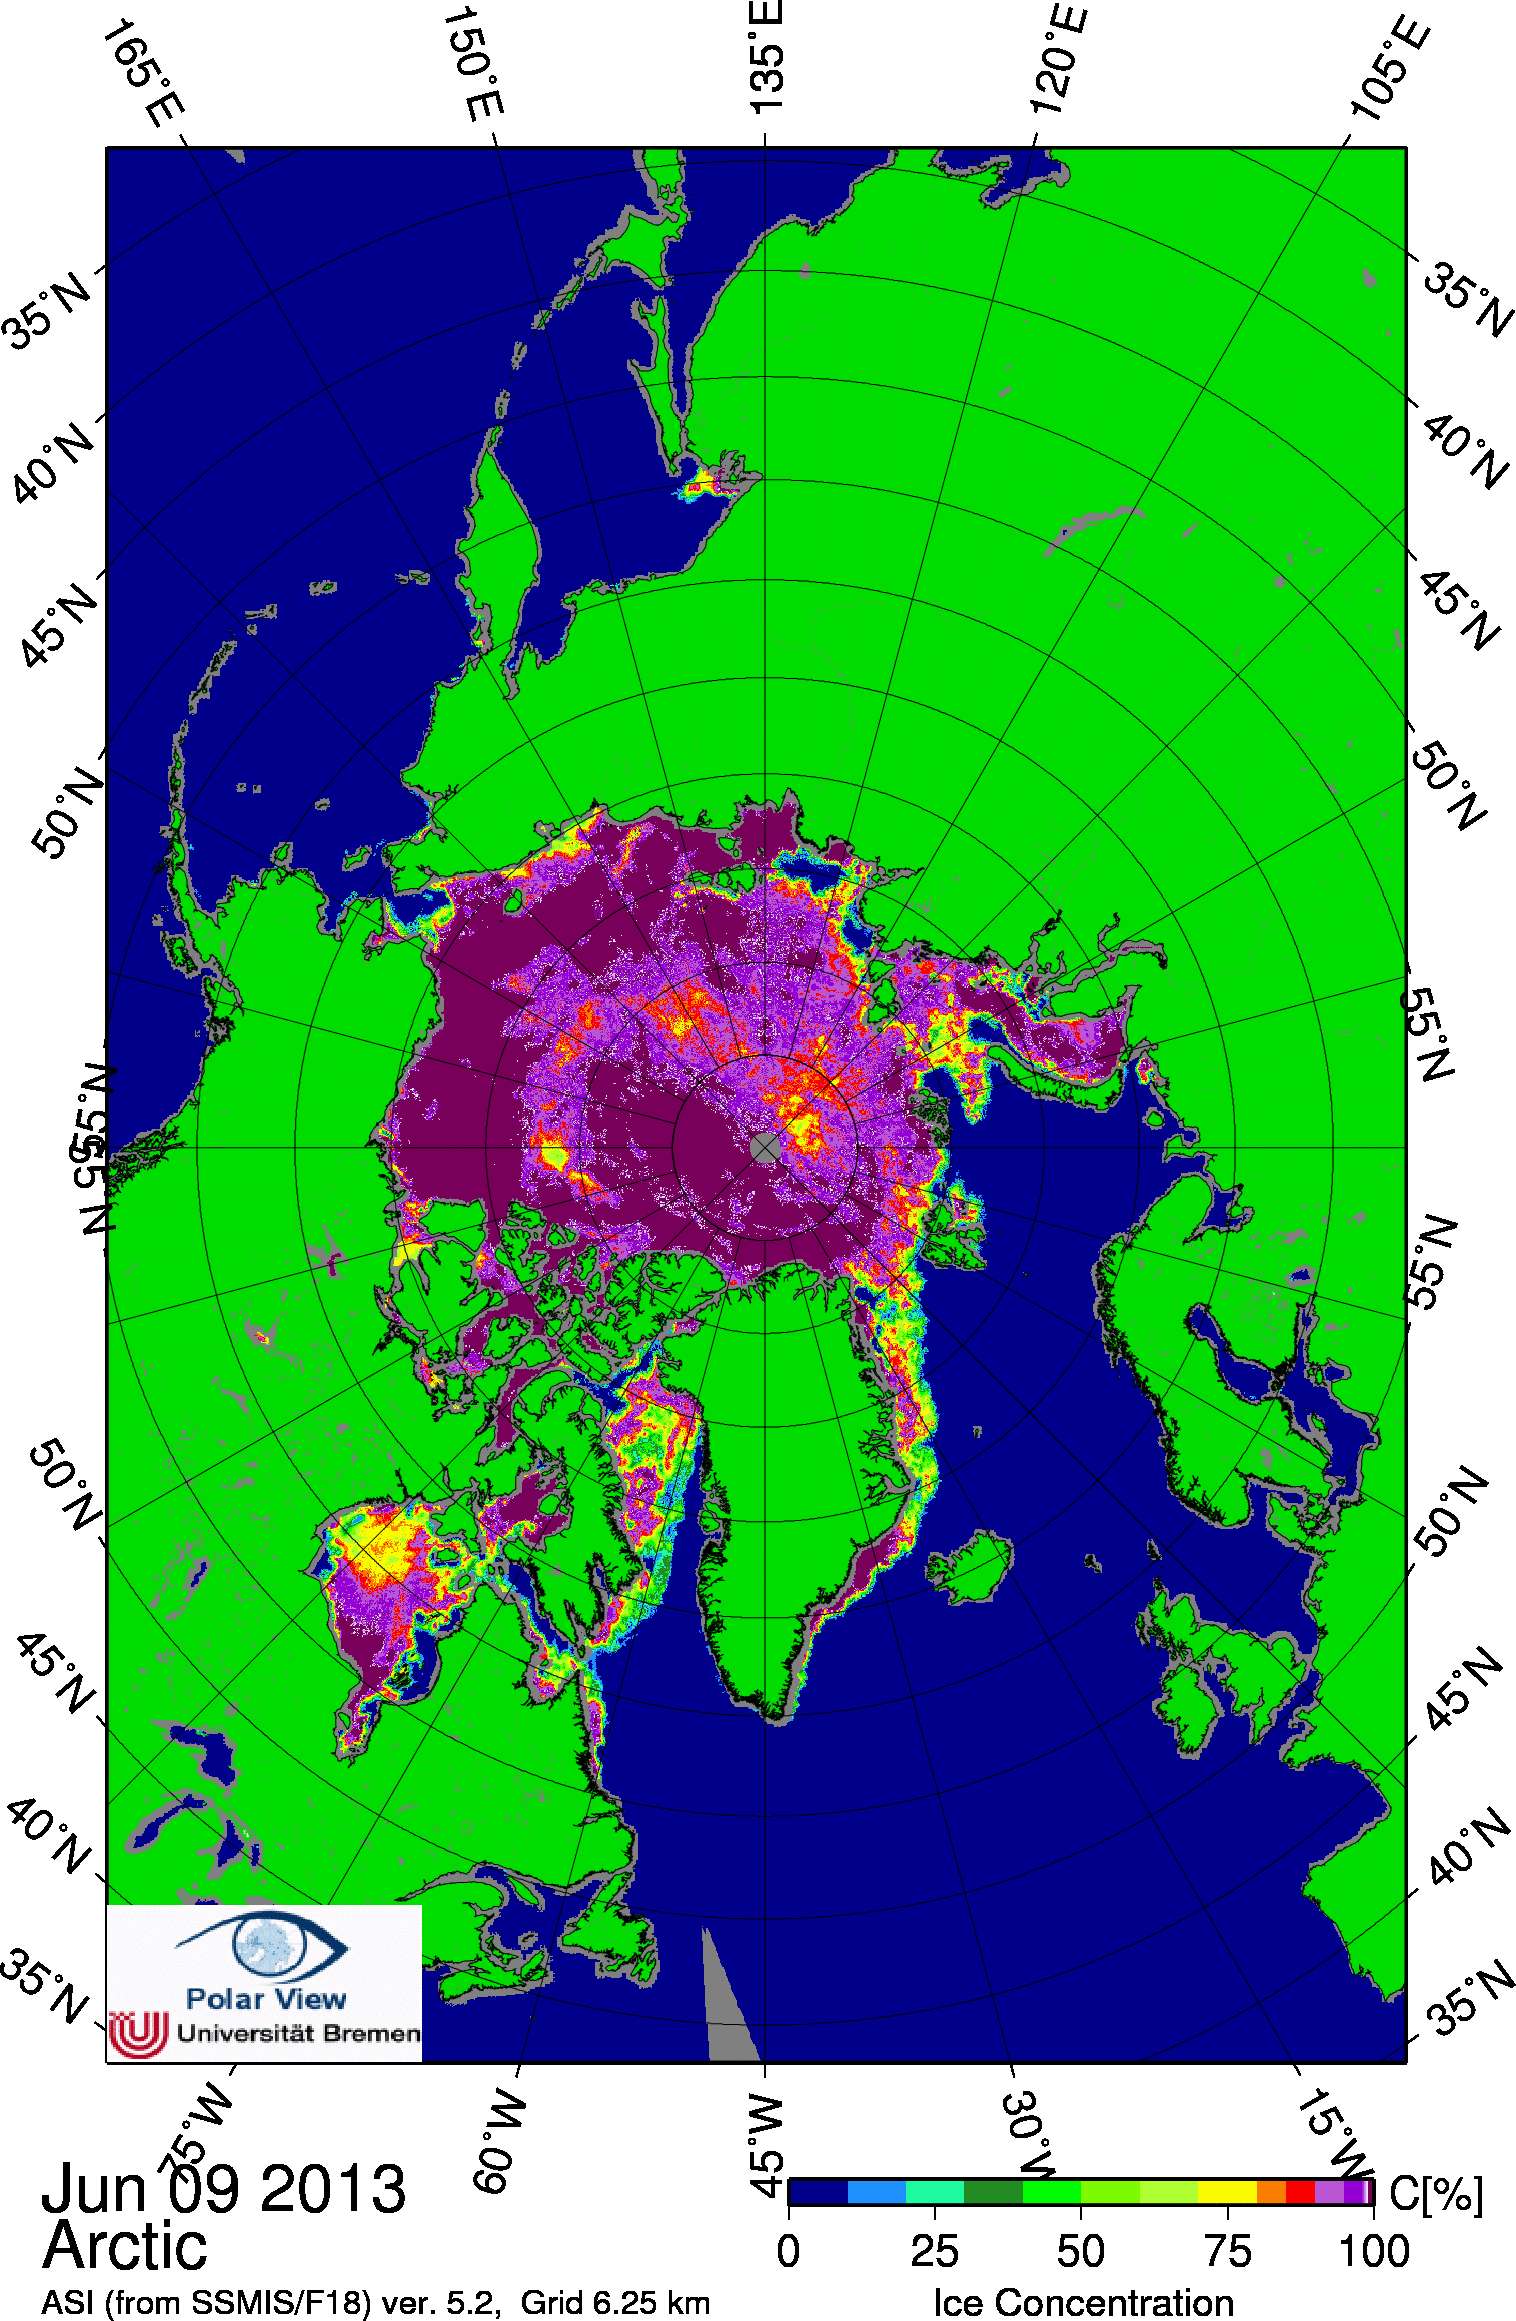

The University of Illinois' measure of sea ice area is in free fall. Rapid melting can be expected to continue in Hudson Bay and the Labrador Sea because it is normal for this time of year. The exceptional area reduction in the central Arctic will be on top of that. These are interesting times.


No comments:
Post a Comment