December 6, 2010
Slow ice growth leads to low November ice extent
Arctic sea ice grew more slowly than average in November, leading to the second-lowest ice extent for the month. At the end of November, Hudson Bay was still nearly ice-free.
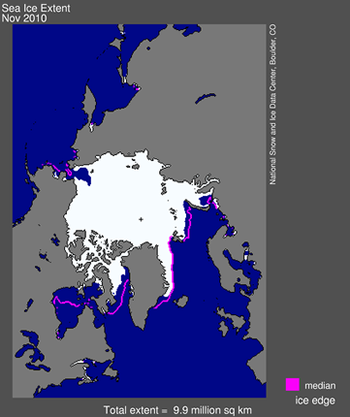
 Figure 1. Arctic sea ice extent for November 2010 was 9.89 million square kilometers (3.82 million square miles). The magenta line shows the 1979 to 2000 median extent for that month. The black cross indicates the geographic North Pole.Sea Ice Index data. About the data.
 —Credit: National Snow and Ice Data Center
High-resolution image
Overview of conditions
Arctic sea ice extent averaged over November 2010 was 9.89 million square kilometers (3.82 million square miles). This is the second-lowest November ice extent recorded over the period of satellite observations from 1979 to 2010, 50,000 square kilometers (19,300 square miles) above the previous record low of 9.84 million square kilometers (3.80 million square miles) set in 2006.
Ice extent was unusually low in both the Atlantic and Pacific sectors of the Arctic and in Hudson Bay. Typically by the end of November, nearly half of Hudson Bay has iced over. But on November 30, only 17% of the bay was covered by sea ice. Compared to the 1979 to 2000 average, the ice extent was 12.4% below average for the Arctic as a whole.
 Figure 2. The graph above shows daily Arctic sea ice extent as of December 4, 2010, along with daily ice extents for previous low-ice-extent years in the month of November. Light blue indicates 2010, pink shows 2006 (the record low for the month) and dark gray shows the 1979 to 2000 average. The gray area around the average line shows the two standard deviation range of the data. Sea Ice Index data.
—Credit: National Snow and Ice Data Center
High-resolution image
Conditions in context
As temperatures drop in autumn, open water areas on the Arctic coastal seas quickly refreeze. After this rapid increase in ice extent during October, ice growth slows in November. This November, ice extent over the entire Arctic grew at an average rate of 74,000 square kilometers per day (28,600 miles per day), which is slower than average. However, local weather conditions kept ice extent very low in some locations, contributing to the low extent for the month.
Near-surface air temperatures over the Siberian and Alaskan side of the Arctic were 3 to 5 degrees Celsius (5 to 9 degrees Fahrenheit) warmer than normal in November. Air temperatures over Baffin Bay were also unusually warm (8 degrees Celsius, or 14 degrees Fahrenheit above average). The warm air came from two sources: unfrozen areas of the ocean continued to release heat to the atmosphere; and a circulation pattern brought warm air into the Arctic from the south.
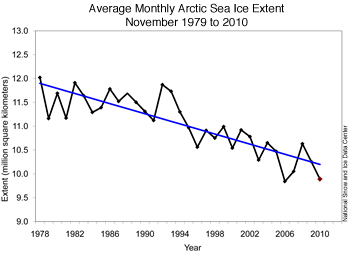
 Figure 3. Monthly November ice extent for 1979 to 2010 shows a decline of 4.7% per decade.
 —Credit: National Snow and Ice Data Center
High-resolution image
November 2010 had the second-lowest ice extent for the month since the beginning of satellite records. The linear rate of decline for the month is –4.7 % per decade.
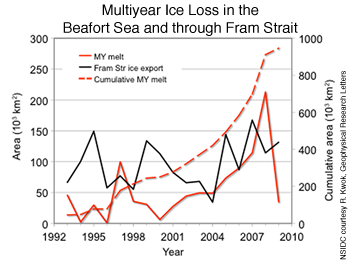
 Figure 4. Older, thicker multiyear ice cover has decreased since 1992. The solid red line shows the annual multiyear ice loss in the Beaufort Sea. Dashed red shows the cumulative multiyear ice loss in the Beaufort Sea. Black indicates multiyear ice loss through Fram Strait.
 —Credit: NSIDC courtesy Geophysical Research Letters
Loss of multiyear ice
The loss of multiyear ice has contributed to low summer ice extents in recent years, because thinner first-year ice melts out more easily than older, thicker ice. Last summer, multiyear ice that had moved into the Beaufort and Chukchi seas during the previous winter largely melted out (see our October post).
Recent research from scientists at the NASA Jet Propulsion Laboratory shows that summer melt of old, thick ice in the Beaufort Sea has contributed substantially to the overall loss of thick multiyear ice in the Arctic. Using data from the QuikSCAT satellite, researchers Ron Kwok and Glenn Cunningham found that the Beaufort Sea lost 947,000 square kilometers (366,000 square miles) of multiyear ice during the summers of 1993 to 2009.
The study also showed that multiyear ice loss increased in the last few years. From 2005 to 2008, the Beaufort Sea lost 490,000 square kilometers (189,000 square miles) of multiyear ice, 32% of the total loss of multiyear ice in the Arctic Ocean during that time period.
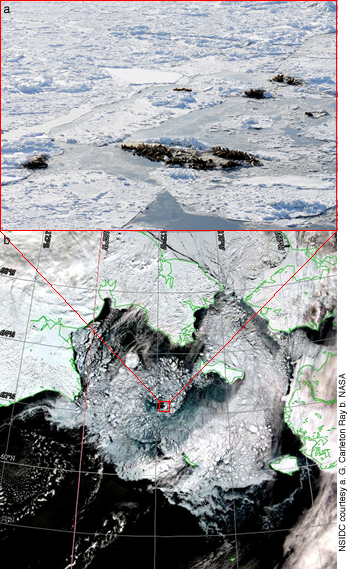
 Figure 5. The top figure shows Pacific walrus on floes within the outlined broken pack southwest of St. Lawrence Island on April 20, 2007. The bottom figure is a MODIS image of the Bering Sea pack at the same time. The red box indicates the location of the walrus groups shown above.
—Credit: National Snow and Ice Data Center courtesy top: G. Carleton Ray, bottom: NASA
Sea ice and ice-dependent animals
Many animals in the Arctic depend on the sea ice cover. A new study by researchers from the University of Virginia and NOAA suggests that seals and walrus rely on certain types of sea ice, called seascapes, for resting and reproduction. The character of these seascapes depends on local and regional weather and ocean conditions, and is changing in conjunction with the long-term downward trend in sea ice extent, cover, and structure.
Researchers G. Carleton Ray, James Overland, and Gary Hufford observed five seal and walrus species from the icebreaker Healy in the Bering Sea. They combined those observations with satellite images of the pack ice to determine the different seascapes that these species prefer. For example, walruses tend to haul out on thicker ice floes, separated by areas of open water, called broken ice. Ribbon and spotted seals instead gather in regions where the ice pack is thin and more dispersed, called loose pack. Understanding how these animals interact with their environments, a field known as landscape ecology, is crucial in this time of fast-changing ice conditions.
Further Reading
Kwok, R. and G. F. Cunningham. 2010. Contribution of melt in the Beaufort Sea to the decline in Arctic multiyear ice coverage: 1993-2009.Geophysical Research Letters, vol. 37. doi:10.1029/2010GL044678.
Ray, G. C., J. E. Overland, G. L. Hufford. 2010. Seascape as an organizing principle for evaluating walrus and seal sea ice habitat in Beringia. Geophysical Research Letters, vol. 37. doi:10.1029/2010GL044452.
Stroeve, J.C., J. Maslanik, M. C. Serreze, I. Rigor, W. Meier, and C. Fowler. 2010. Sea ice response to an extreme negative phase of the Arctic Oscillation during winter 2009/2010. Geophysical Research Letters. In Press.


No comments:
Post a Comment