by Jay Kimball, 8020vision.com
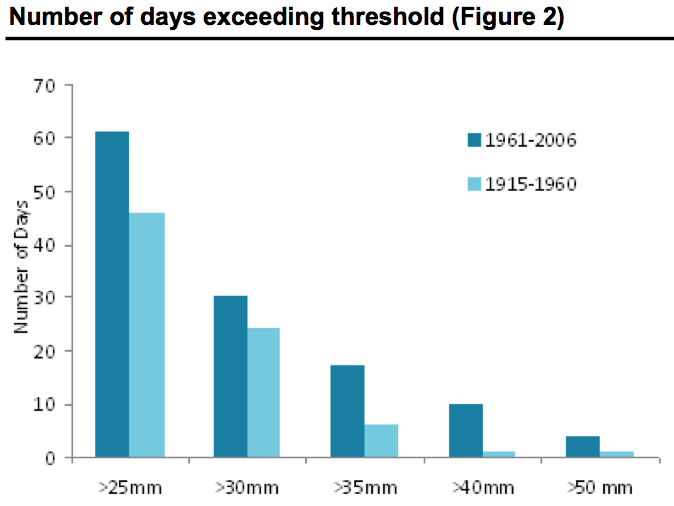
Lloyds of London Emerging Risks Team and the Climate Change Risk Management consultancy have published a whitepaper on Extreme Rainfall. Lloyd’s researchers found rainy days of 25mm have become more frequent, increasing 33%, since 1960. However, the change is most significant for days of extreme rainfall over 40mm, which recorded a 900% increase.
Lloyds of London Emerging Risks Team and the Climate Change Risk Management consultancy have published a whitepaper on Extreme Rainfall. Lloyd’s researchers found rainy days of 25mm have become more frequent, increasing 33%, since 1960. However, the change is most significant for days of extreme rainfall over 40mm, which recorded a 900% increase.
Interestingly, the trends in this paper would be missed under analysis of annual or monthly records. The change in extremes in the daily record is entirely hidden from annual, seasonal and monthly records. This highlights the importance of collecting data and modelling at an appropriate level of granularity.
The study examined daily rainfall levels in East London from 1915 to 2006 and found only one day prior to 1960 of recorded rainfall exceeding 40 mm, compared with 10 days between 1960 and 2006. Over the entire period analysed, over half of the days with rainfall over 40 mm were in September.
Lloyd’s team analyzed data over two separate periods (1915-1960 and 1961-2006), providing two 46-year periods. They found that daily rainfall exceeding 25mm occurred on 107 occasions in the 92-year period, with more in the post-1960 period (61) than in the pre-1960 period (46) (Figure 2).
Figure 3 shows the percentage of increase of various daily rainfall levels between the two time periods. For example, the number of days exceeding 40 mm has increased from once between 1915-1960, to 10 occurrences, a 900% increase, between 1961-2006.
From the Introduction of Lloyd’s Whitepaper
There is a scientific consensus (Oreskes 2004) that the mean surface temperature of the Earth has warmed in recent decades, and that the warming amounts to around 0.8 °C since the beginning of the 20th Century (IPCC 2007). From this, Goddard Institute of Space Studies (GISS) estimate that 2005 tied with 2007 as the warmest year since reliable instrumental measurements became available, and the first six months of 2010 appear to have exceeded these. Detection and attribution studies show that there is a high probability (at least 90%) that this warming is largely the result of man-made emissions of greenhouse gases (mainly CO2) in the troposphere and that the amount and rate of warming are outside of the range of natural variation identified during the latter part of the last 11,000 years.Continued warming is expected to have important consequences for a range of Earth systems (including the atmosphere, cryosphere, oceans, hydrological systems and the biosphere) and there are compelling reasons to expect increases in the magnitude and frequency of some natural hazards such as floods (Huntington 2006), droughts (Mason & Goddard 2001) and landslides (e.g., Fischer et al. 2006). There are also concerns about the stability of several of the large ice sheets on Earth (e.g., Overpeck et al. 2006), as these have the ability to impact upon global sea levels and regulate ocean currents. (See Lloyd’s 360 Risk Insight Report “Rapid Climate Change” – www.lloyds.com/360.)The pattern and extent of future warming has enormously important policy implications for governments and business. The only way in which such predictions can be made is through the use of Global Climate Models (GCMs) and through risk-based analyses.It is clear that climate change presents a risk to the facilities and infrastructure of national and local authorities. An assessment and analysis of these risks is required to develop a robust risk assessment, mitigation and adaptation programme at regional and national levels.The objectives of the preliminary analysis presented in this report were to:
- Describe the patterns of daily rainfall in London and compare the early 20th century record with that of the late 20th and early 21st centuries.
- Catalog the occurrence of rainfall events that have resulted in major downpours in the last century.
- Analyse and interpret changes in daily rainfall patterns.
- Analyse trends in annual, seasonal and monthly rainfall patterns.
The whitepaper can be downloaded here.
For more on Climate Change and weather, see:


1 comment:
The article above was authored by Jay Kimball at 8020 Vision.
For more on climate change, energy, water, food, the global economy, sustainable challenges and solutions, visit us at:
8020vision.com
Jay Kimball
8020 Vision
Post a Comment