Working out climate sensitivity from satellite measurements
by John Cook, Skeptical Science, May 26, 2010Climate sensitivity is a measure of how much our climate responds to an energy imbalance. The most common definition is the change in global temperature if the amount of atmospheric CO2 was doubled. If there were no feedbacks, climate sensitivity would be around 1 °C. But we know there are a number of feedbacks, both positive and negative. So how do we determine the net feedback? An empirical solution is to observe how our climate responds to temperature change. We have satellite measurements of the radiation budget and surface measurements of temperature. Putting the two together should give us an indication of net feedback.
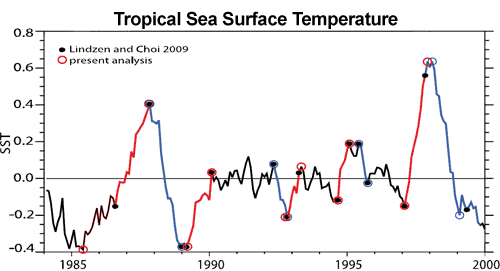
One paper that attempts to do this is "On the determination of climate feedbacks from ERBE data" by Lindzen et al. (2009). It looks at sea surface temperature in the tropics (20° S to 20° N) from 1986 to 2000. Specifically, it looked at periods where the change in temperature was greater than 0.2 °C, marked by red and blue colors (Figure 1).

Figure 1. Monthly sea surface temperature for 20° S to 20° N. Periods of temperature change greater than 0.2 °C marked by red and blue (Lindzen et al. 2009).
Lindzen et al. also analysed satellite measurements of outgoing radiation over these periods. As short-term tropical sea surface temperatures are largely driven by the El Nino–Southern Oscillation, the change in outward radiation offers an insight into how climate responds to changing temperature. Their analysis found that when it gets warmer, there was more outgoing radiation escaping to space. They concluded that net feedback is negative and our planet has a low climate sensitivity of about 0.5 °C.
However, a response ("Relationships between tropical sea surface temperature and top-of-atmosphere radiation" by Trenberth et al. (2010)) to this paper revealed a number of flaws in Lindzen's analysis. It turns out the low climate sensitivity result is heavily dependent on the choice of start and end points in the periods they analyse. Small changes in their choice of dates entirely change the result. Essentially, one could tweak the start and end points to obtain any feedback one wishes.

Figure 2. Warming (red) and cooling (blue) intervals of tropical SST (20° N–20° S) used by Lindzen et al. (2009) (solid circles) and an alternative selection proposed derived from an objective approach (open circles) (Trenberth et al. 2010).
Another major flaw in Lindzen's analysis is that they attempt to calculate global climate sensitivity from tropical data. The tropics are not a closed system – a great deal of energy is exchanged between the tropics and subtropics. To properly calculate global climate sensitivity, global observations are required.
This is confirmed by another paper published in early May (Murphy 2010). This paper finds that small changes in the heat transport between the tropics and subtropics can swamp the tropical signal. They conclude that climate sensitivity must be calculated from global data.
In addition, a paper published last week reproduced the analysis from Lindzen et al. (2009) and compared it to results using near-global data (Chung et al. 2010). The near-global data find net positive feedback and the authors conclude that the tropical ocean is not an adequate region for determining global climate sensitivity.
A full understanding of climate requires we take into account the full body of evidence. In the case of climate sensitivity and satellite data, it requires a global dataset, not just the tropics. Stepping back to take a broader view, a single paper must also be seen in the context of the full body of peer-reviewed research. A multitude of papers looking at different periods in Earth's history independently and empirically converge on a consistent answer – climate sensitivity is around 3 °C, implying net positive feedback.
Link: http://www.skepticalscience.com/Working-out-climate-sensitivity-from-satellite-measurements.html


No comments:
Post a Comment