Stratospheric sudden warmings (SSWs) are a ubiquitous feature of the wintertime flow in the northern hemisphere. Discovered more than sixty years ago (Sherhag, 1952) when radiosonde observations began to provide routine observations at altitudes higher than 20 km above the surface of the earth, these events take their name from a rapid temperature increase of several tens of Kelvin over a few days in the high northern latitudes. Since the initial discovery of this warming, routine radiosonde observations and satellite datasets have been used to construct a fairly complete picture of the dynamical nature of these events, which are caused by the propagation and evolution of planetary scale wave motions in the troposphere and stratosphere. A major midwinter SSW event occurs when polar stratospheric temperatures increase by at least 25 K in one week, and the zonal-mean zonal wind at or near 10 hPa (at about 30 km altitude) reverses direction and becomes easterly north of 60° N. Research has led to a good documentation of the frequency and seasonality of sudden warmings: just over half of the winters since 1960 have experienced a major warming event in January or February (e.g., Charlton & Polvani, 2007). The event in early January 2013 is thus not atypical, but, like all of these events, has unique dynamical characteristics in terms of its development and interactions with the tropospheric flow.
Recent advances in the GEOS-5 analysis and forecasting system present an opportunity to examine the SSW event of January 2013 at a level of detail that was not possible only a few years ago. The configuration of the GEOS-5 atmospheric general circulation model (AGCM) used here has 72 layers that extend from the surface of the earth up to 0.01 hPa, or about 80 km in altitude, in the upper mesosphere. Radiance observations from satellites assimilated into the GEOS-5 system provide constraints on meteorological analyses up to about 50 km, near the stratopause. In addition, GEOS-5 assimilation analyses are currently performed on a horizontal grid with points every 0.25° in latitude and 0.3125° in longitude.
click for larger image
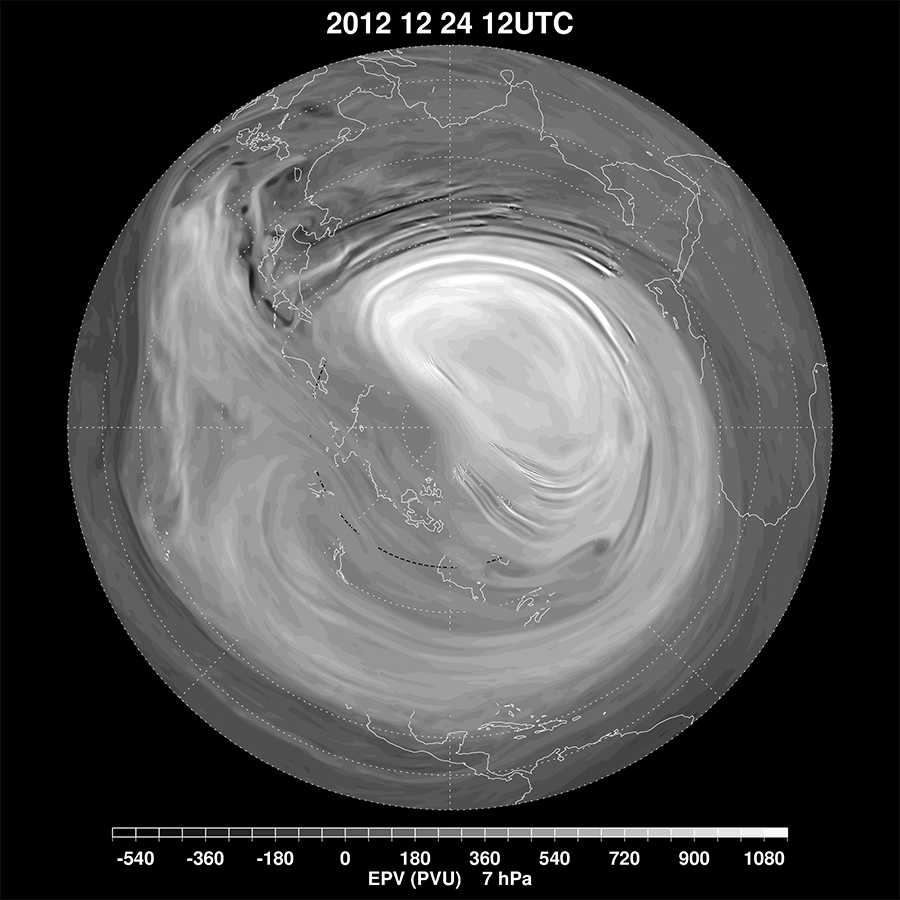
Figure 1. Distribution of EPV at 7 hPa on December 24, 2013, before the SSW occurred. The EPV field is from the GEOS-5 data assimilation system, and shows EPV in potential vorticity units (PVU, 10-6K kg-1m2s-1). The shading shows regions of high EPV, typical of the polar vortex, in white, and regions of low EPV, typical of tropical air masses, in darker shades.
click for larger image
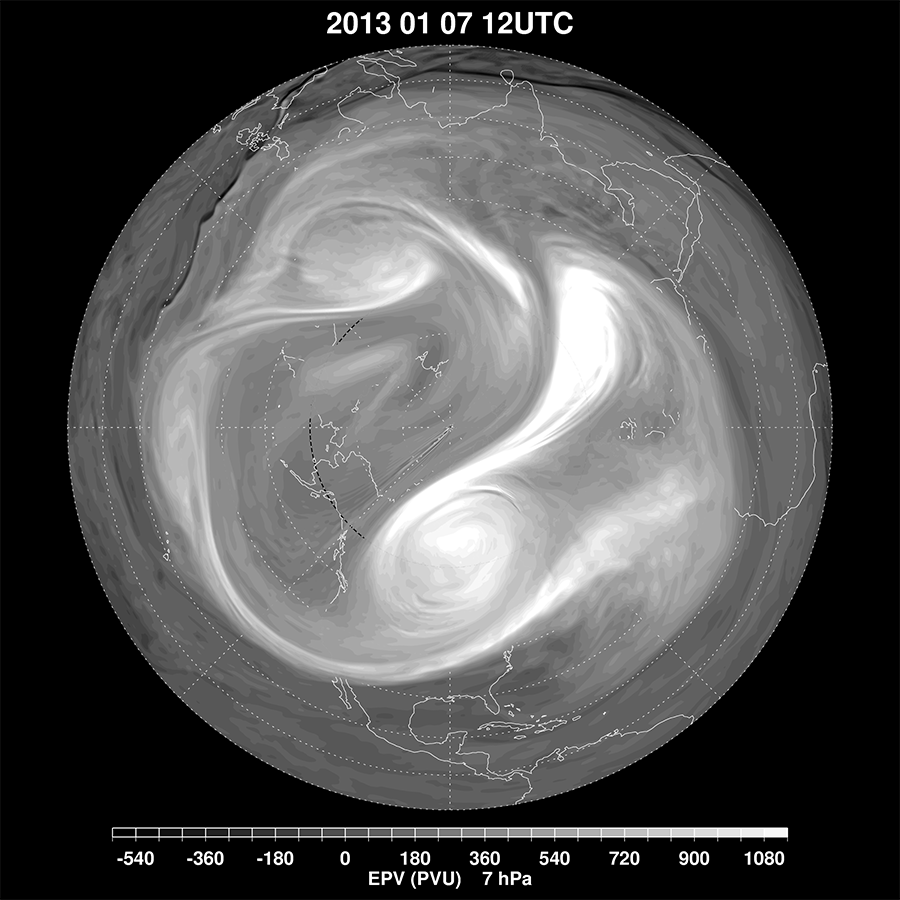
Figure 2. As Figure 1, but for January 7, 2013, showing the breakdown of the polar vortex into three smaller vortices.
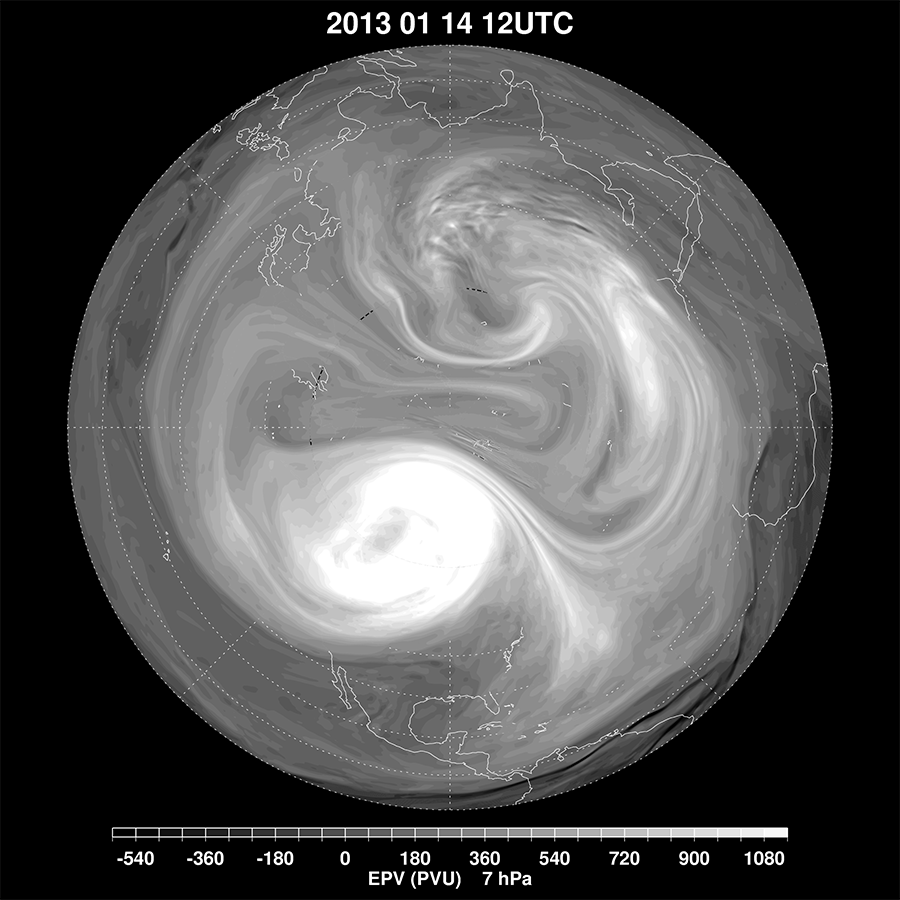
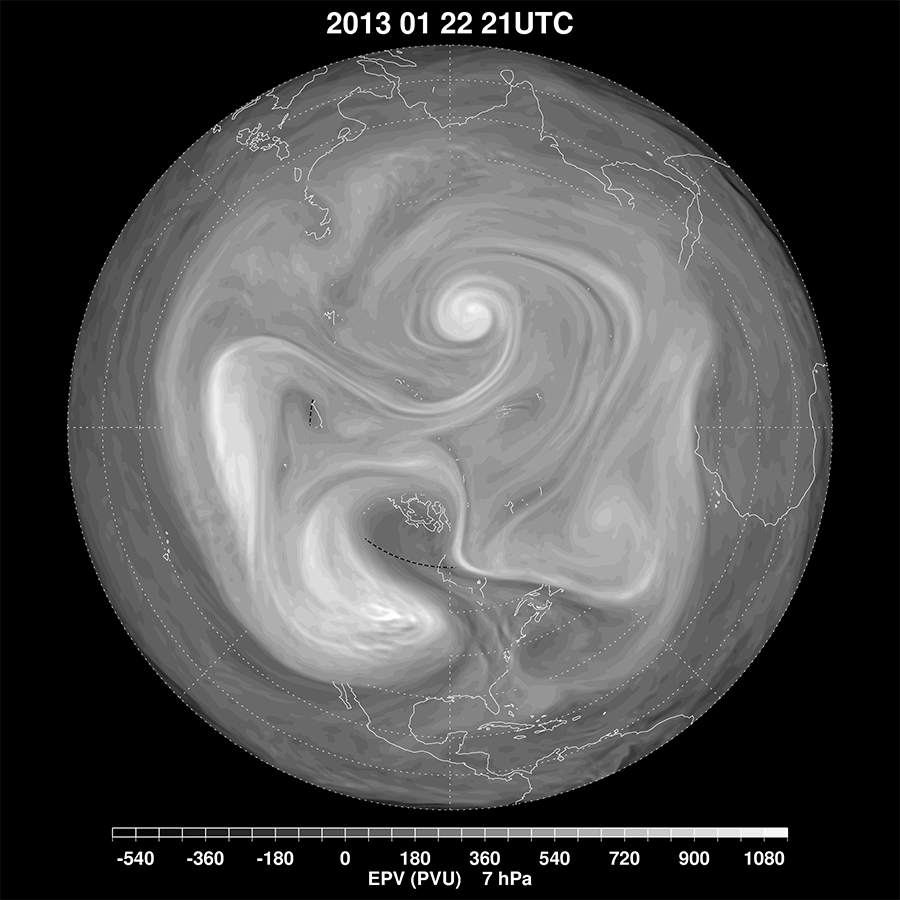
Figure 1 shows the map of Ertel's potential vorticity (EPV), a measure of the rotation of the flow that also takes the Earth's rotation and static stability into account, at 7hPa (about 35 km in altitude) on December 24, 2012. The deep-white regions represent high EPV and depict a strong, elongated polar vortex over northern Europe and Asia, with a "tail" of air advected from the main vortex, which wrapped around the northern latitudes and circumscribed the pole. Over the next few days, the GEOS-5 analyses showed the vortex distorting and breaking up, coincident with the increase in polar temperatures at 10 hPa. By January 7, 2013, the shearing of the original polar vortex by the winds led to the existence of three smaller, interconnected vortices (Figure 2), located over Canada, northern Eurasia, and northeastern Siberia. By January 14, the weakest of these vortices (over Siberia) disappeared (see Figure 3). At this time, the vortex located over Canada was the stronger of the pair, but with the low EPV values remaining over the pole, the high-latitude stratosphere was still anomalously warm. Further stretching and shearing of the vortices occurred, leading to a situation with no well-formed polar vortex for several days. By January 22, as seen in Figure 4, the flow appeared to be reorganizing, with a broad region of cyclonic circulation developing near the pole.
click for larger image
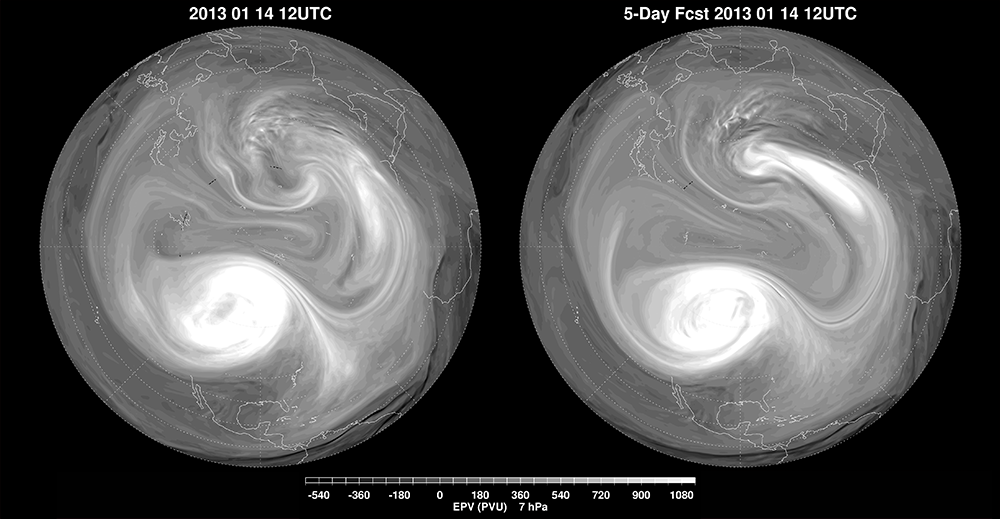
Figure 3. As Figure 1, but for January 14, 2013, with a large vortex forming over Canada.
click for larger image
Figure 4. As Figure 1, but for January 22, 2013, showing the development of a broad cyclonic flow, likely signifying the formation of a new polar vortex and the end of the SSW.
The animation of these northern hemisphere EPV fields from the GEOS-5 atmospheric analyses shows the evolution of this major SSW of January 2013. The movie starts in mid-December 2012 and continues through the various phases of the warming event, until the end of January. The animation includes one frame from every three hours of the GEOS-5 assimilation. Beginning in mid-December, low EPV air (dark in color) can be seen coming up from lower latitudes and being entrained in the polar flow, generating an anti-cyclonic circulation that disrupts the polar vortex. Evident in the animation are the vortex distortion before the warming and the breakdown associated with the shift in wind direction around January 6, when the event was officially classified as a major SSW. Also seen is the subsequent unsettled nature of the flow in the following days, which remained highly disturbed into late January.

» Smaller Version (15MB MPEG4) | » Larger Version (44MB MOV)
Animation: GEOS-5 analyses of the distribution of EPV (in PVU) in the Northern Hemisphere hourly, from 00Z December 15, 2012 to 21Z January 28, 2013. As in the other figures of EPV presented here, lighter shades represent regions of high EPV, while darker shades represent regions of low EPV.
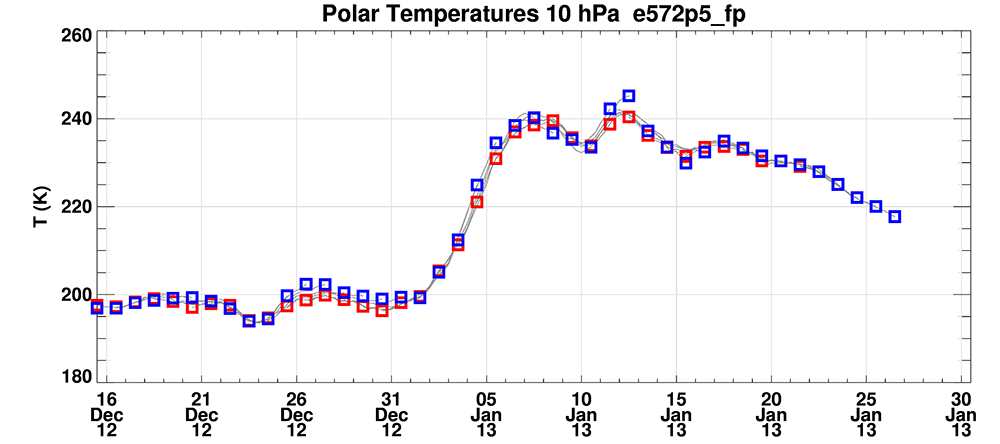
Along with the four daily analyses, two five-day forecasts, initialized at 00Z and 12Z, were produced using the GEOS-5 AGCM. Evaluation of these forecasts in the stratosphere revealed that GEOS-5 was able to predict the onset and evolution of the SSW event well, even capturing the distorted flow patterns with some accuracy up to four-to-five days in advance. For instance, the five-day forecast launched at 12Z on January 2, 2013, began to display the substantial change in wind and temperature in the upper stratosphere. That forecast predicted that by January 7, the temperature in the polar stratosphere at 10hPa would increase by more than 40 K, and the zonal (East-to-West) winds at high latitudes would reverse direction. As can be seen in the time series in Figure 5, this forecast was verified, and a cross section of 10 hPa temperature at polar latitudes from the GEOS-5 analyses shows that the model was able to forecast the increase in polar stratospheric temperatures very realistically. Additionally, the forecast wind profile at 60° N closely matches the analysis profile in the stratosphere, and a cross section of 10 hPa winds in the polar latitudes shows a good agreement between the forecast and the analysis at the same time (see Figure 6).
click for larger image
Figure 5. Time series of observed (red squares) and five-day forecast (blue squares) temperature, in Kelvin, at 10 hPa in the polar latitudes. Each plotted grey line connects an analysis (red square) to the forecast (blue square) it initialized five days earlier.

click for larger image
Figure 6. Cross section of forecast (blue) and observational analyses (red and green) of stratospheric temperatures (K, left) and zonal winds (m/s, middle), and profile of zonal winds (m/s, right): Winds and temperatures at 12Z on January 2, 2013 show conditions pre-warming, and the winds and temperatures at 12Z on January 7, 2013 show that the January 2 12Z five-day forecast predicted the event very well. Note the log scale on the rightmost wind plot.
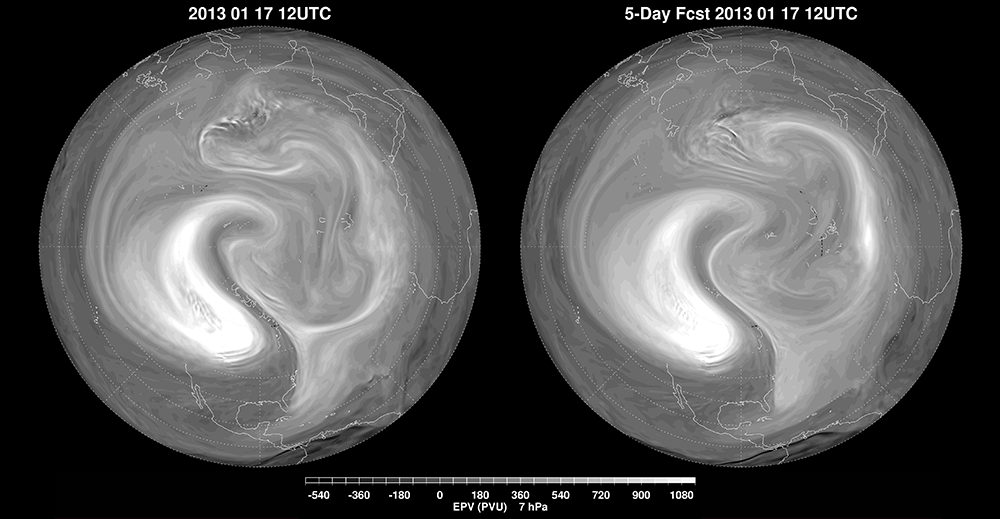
Consistent with SSWs, GEOS-5 also forecast that the polar vortex would break apart, and the five-day forecast valid at 12Z on January 7 predicted that the three smaller vortices seen in the analyses at that time would form. The forecast vortices formed close to where they appeared in the analyses, and were largely similar in shape to those observed. The exception is the Eurasian vortex, which, as seen in Figure 7, was more elongated in reality than it was in the five-day forecast. In Figure 8, the five-day forecast of EPV valid at 12Z on January 14 depicts two vortices, the largest and strongest of which is over Canada. This forecast is also very similar to the analysis from the same time, though the smaller vortex is weaker in the analysis, and slightly west of its forecast position. The five-day forecast valid at 12Z on January 17 (see Figure 9) shows that GEOS-5 was able to predict that the stratospheric flow in the poles was still in flux, as lower EPV air can be seen entering the flow and disturbing the large vortex that had formed over Canada.

click for larger image
Figure 7. As in Figure 1, for January 7, 2013. GEOS-5 analysis at left, and five-day forecast at right.
click for larger image
Figure 8. As in Figure 1, for January 14, 2013. GEOS-5 analysis at left, and five-day forecast at right.
Because of the timing of this major warming event in early January 2013, there is ample time for a polar vortex to re-establish in the polar region, with a return to low temperatures near the pole. Though the GEOS-5 five-day forecasts, as of January 25 2013, still predict a disturbed flow pattern at high latitudes in the stratosphere, they are beginning to show the reformation of a polar vortex at higher altitudes. A slow cooling along with the establishment of a new polar vortex are typical features of mid-winter SSWs.
click for larger image
Figure 9. As in Figure 1, for January 17, 2013. GEOS-5 analysis at left, and five-day forecast at right.
In summary, the quarter-degree resolution GEOS-5 analyses depict the distortion and breakdown of the stratospheric polar vortex in January of 2013 with a degree of detail that was unprecedented just a few years ago. The accuracy of the analyses and the integrity of the underlying GEOS-5 model lead to a successful prediction of this SSW event up to five days in advance, with the initial displacement of the vortex followed by its dynamical breakdown into three smaller vortices. Routine GEOS-5 forecasts currently end at five days, so this work suggests that extensions out to 10 days would offer value for future studies of the stratosphere.


No comments:
Post a Comment