Average Arctic sea ice extent for November set a record low, reflecting unusually high air temperatures, winds from the south, and a warm ocean. Since October, Arctic ice extent has been more than two standard deviations lower than the long-term average. Antarctic sea ice extent quickly declined in November, also setting a record low for the month and tracking more than two standard deviations below average during the entire month. For the globe as a whole, sea ice cover was exceptionally low.
Overview of conditions
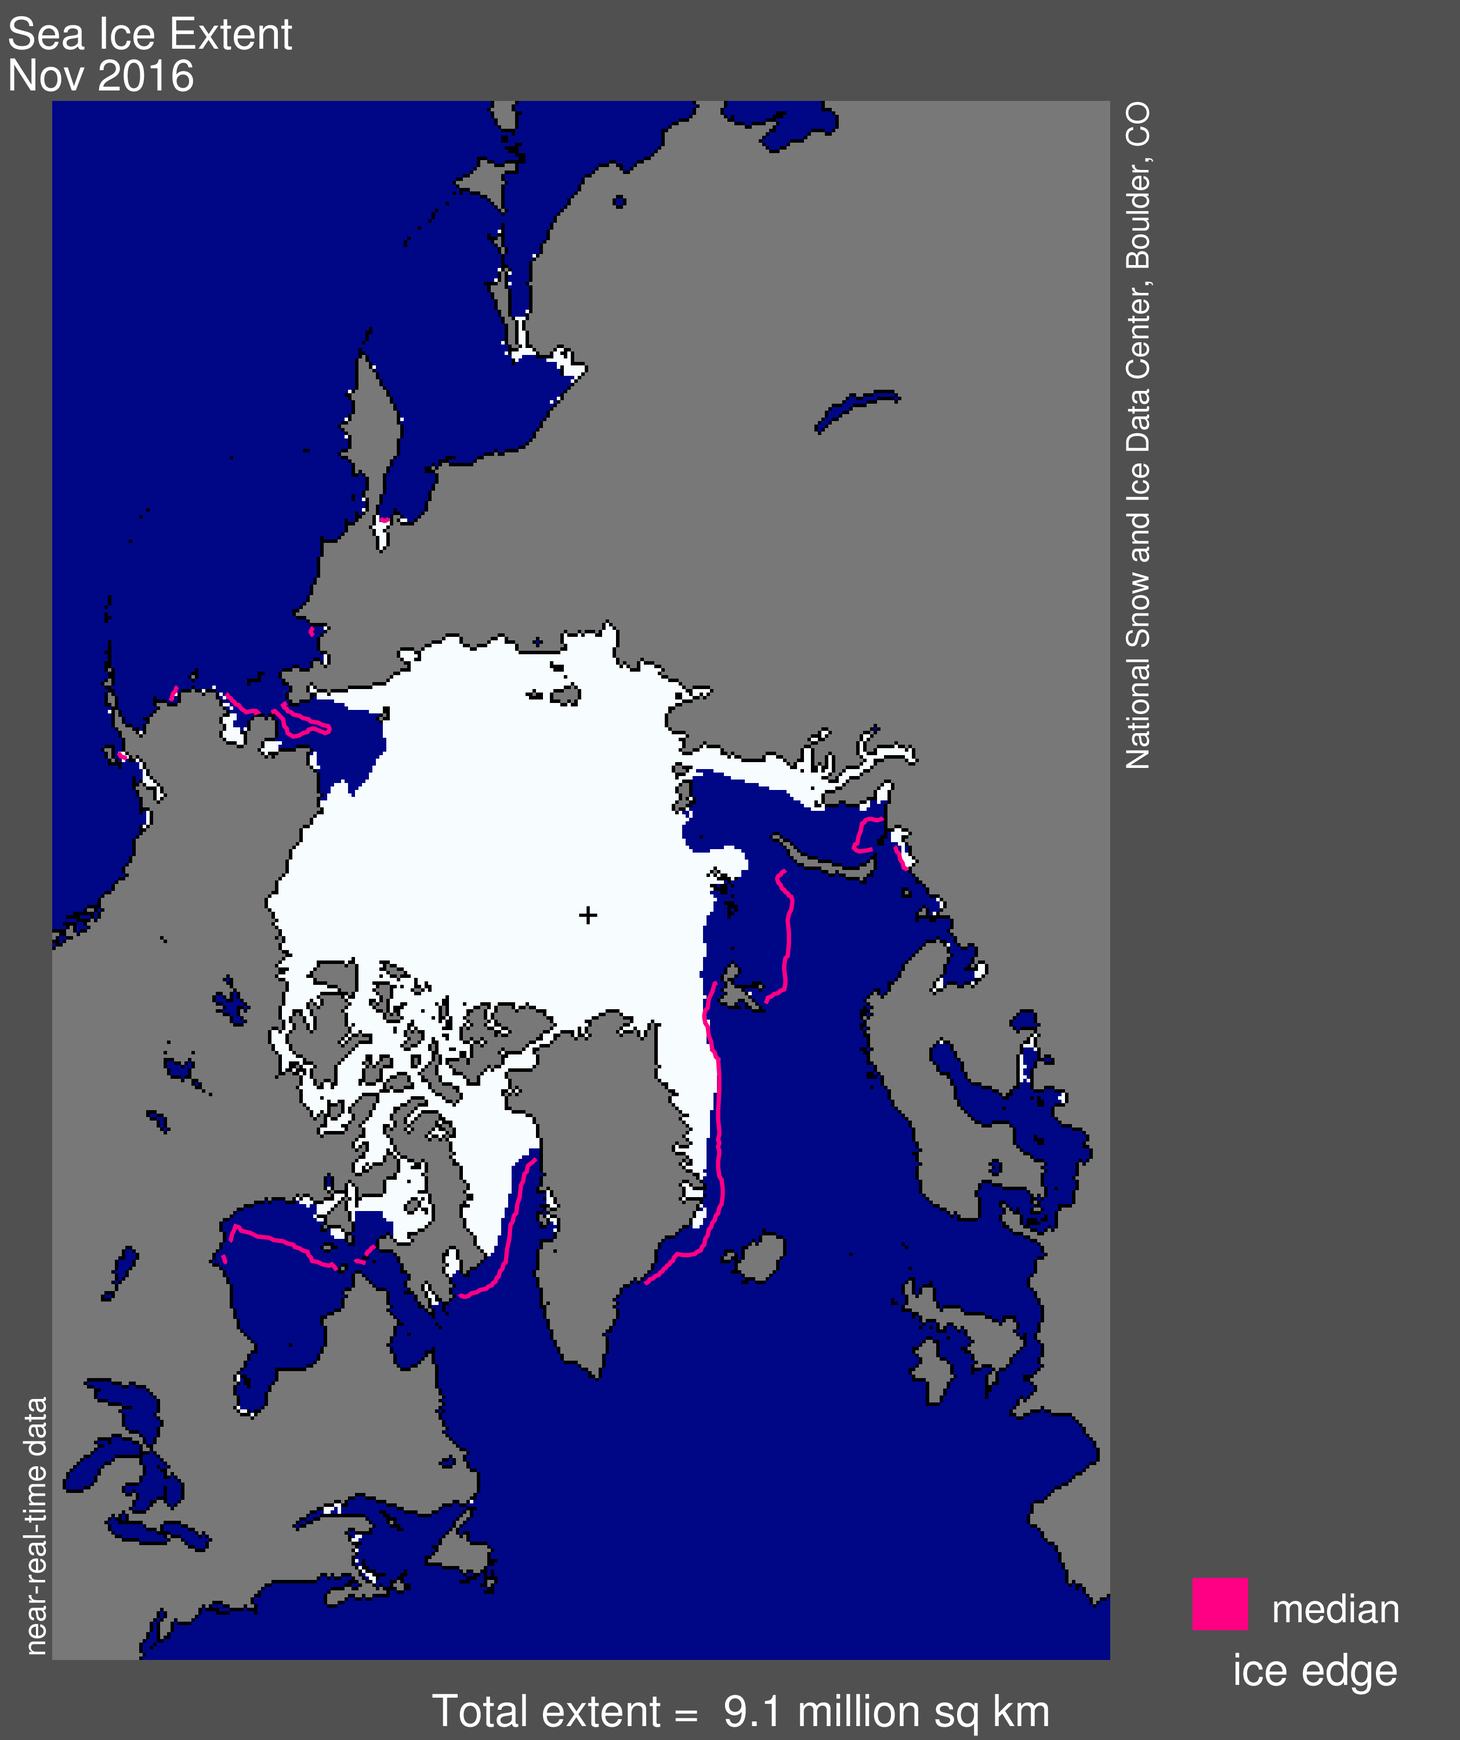
Figure 1. Arctic sea ice extent for November 2016 was 9.08 million square kilometers (3.51 million square miles). The magenta line shows the 1981 to 2010 median extent for the month. The black cross indicates the geographic North Pole. Sea Ice Index data. About the data. Credit: National Snow and Ice Data Center
High-resolution image
High-resolution image
In November 2016, Arctic sea ice extent averaged 9.08 million square kilometers (3.51 million square miles), the lowest November in the satellite record. This is 800,000 square kilometers (309,000 square miles) below November 2006, the previous lowest November, and 1.95 million square kilometers (753,000 square miles) below the 1981 to 2010 long-term average for November. For the month, ice extent was 3.2 standard deviations below the long-term average, a larger departure than observed in September 2012 when the Arctic summer minimum extent hit a record low.
At this time of year, air temperatures near the surface of the Arctic Ocean are generally well below freezing, but this year has seen exceptional warmth. The overall rate of ice growth this November was 88,000 square kilometers (34,000 square miles) per day, a bit faster than the long-term average of 69,600 square kilometers (26,900 square miles) per day. However, for a brief period in the middle the month, total extent actually decreased by 50,000 square kilometers, or 19,300 square miles—an almost unprecedented occurrence for November over the period of satellite observations. A less pronounced and brief retreat of 14,000 square kilometers (5,400 square miles) occurred in 2013.
Ice growth during November as a whole occurred primarily within the Beaufort, Chukchi and East Siberian Seas, as well as within Baffin Bay. Ice extent slightly retreated in the Barents Sea for the month. Compared to the previous record low for the month set in 2006, sea ice was less extensive in the Kara, Barents, East Greenland, and Chukchi Seas, and more extensive in Baffin Bay this year.
Conditions in context

Figure 2a. The graph above shows daily Arctic sea ice extent as of December 5, 2016, along with daily ice extent data for four previous years. 2016 is shown in blue, 2015 in green, 2014 in orange, 2013 in brown, and 2012 in purple. The 1981 to 2010 average is in dark gray. The gray area around the average line shows the two standard deviation range of the data. Sea Ice Index data.
Credit: National Snow and Ice Data Center. High-resolution image
Credit: National Snow and Ice Data Center. High-resolution image
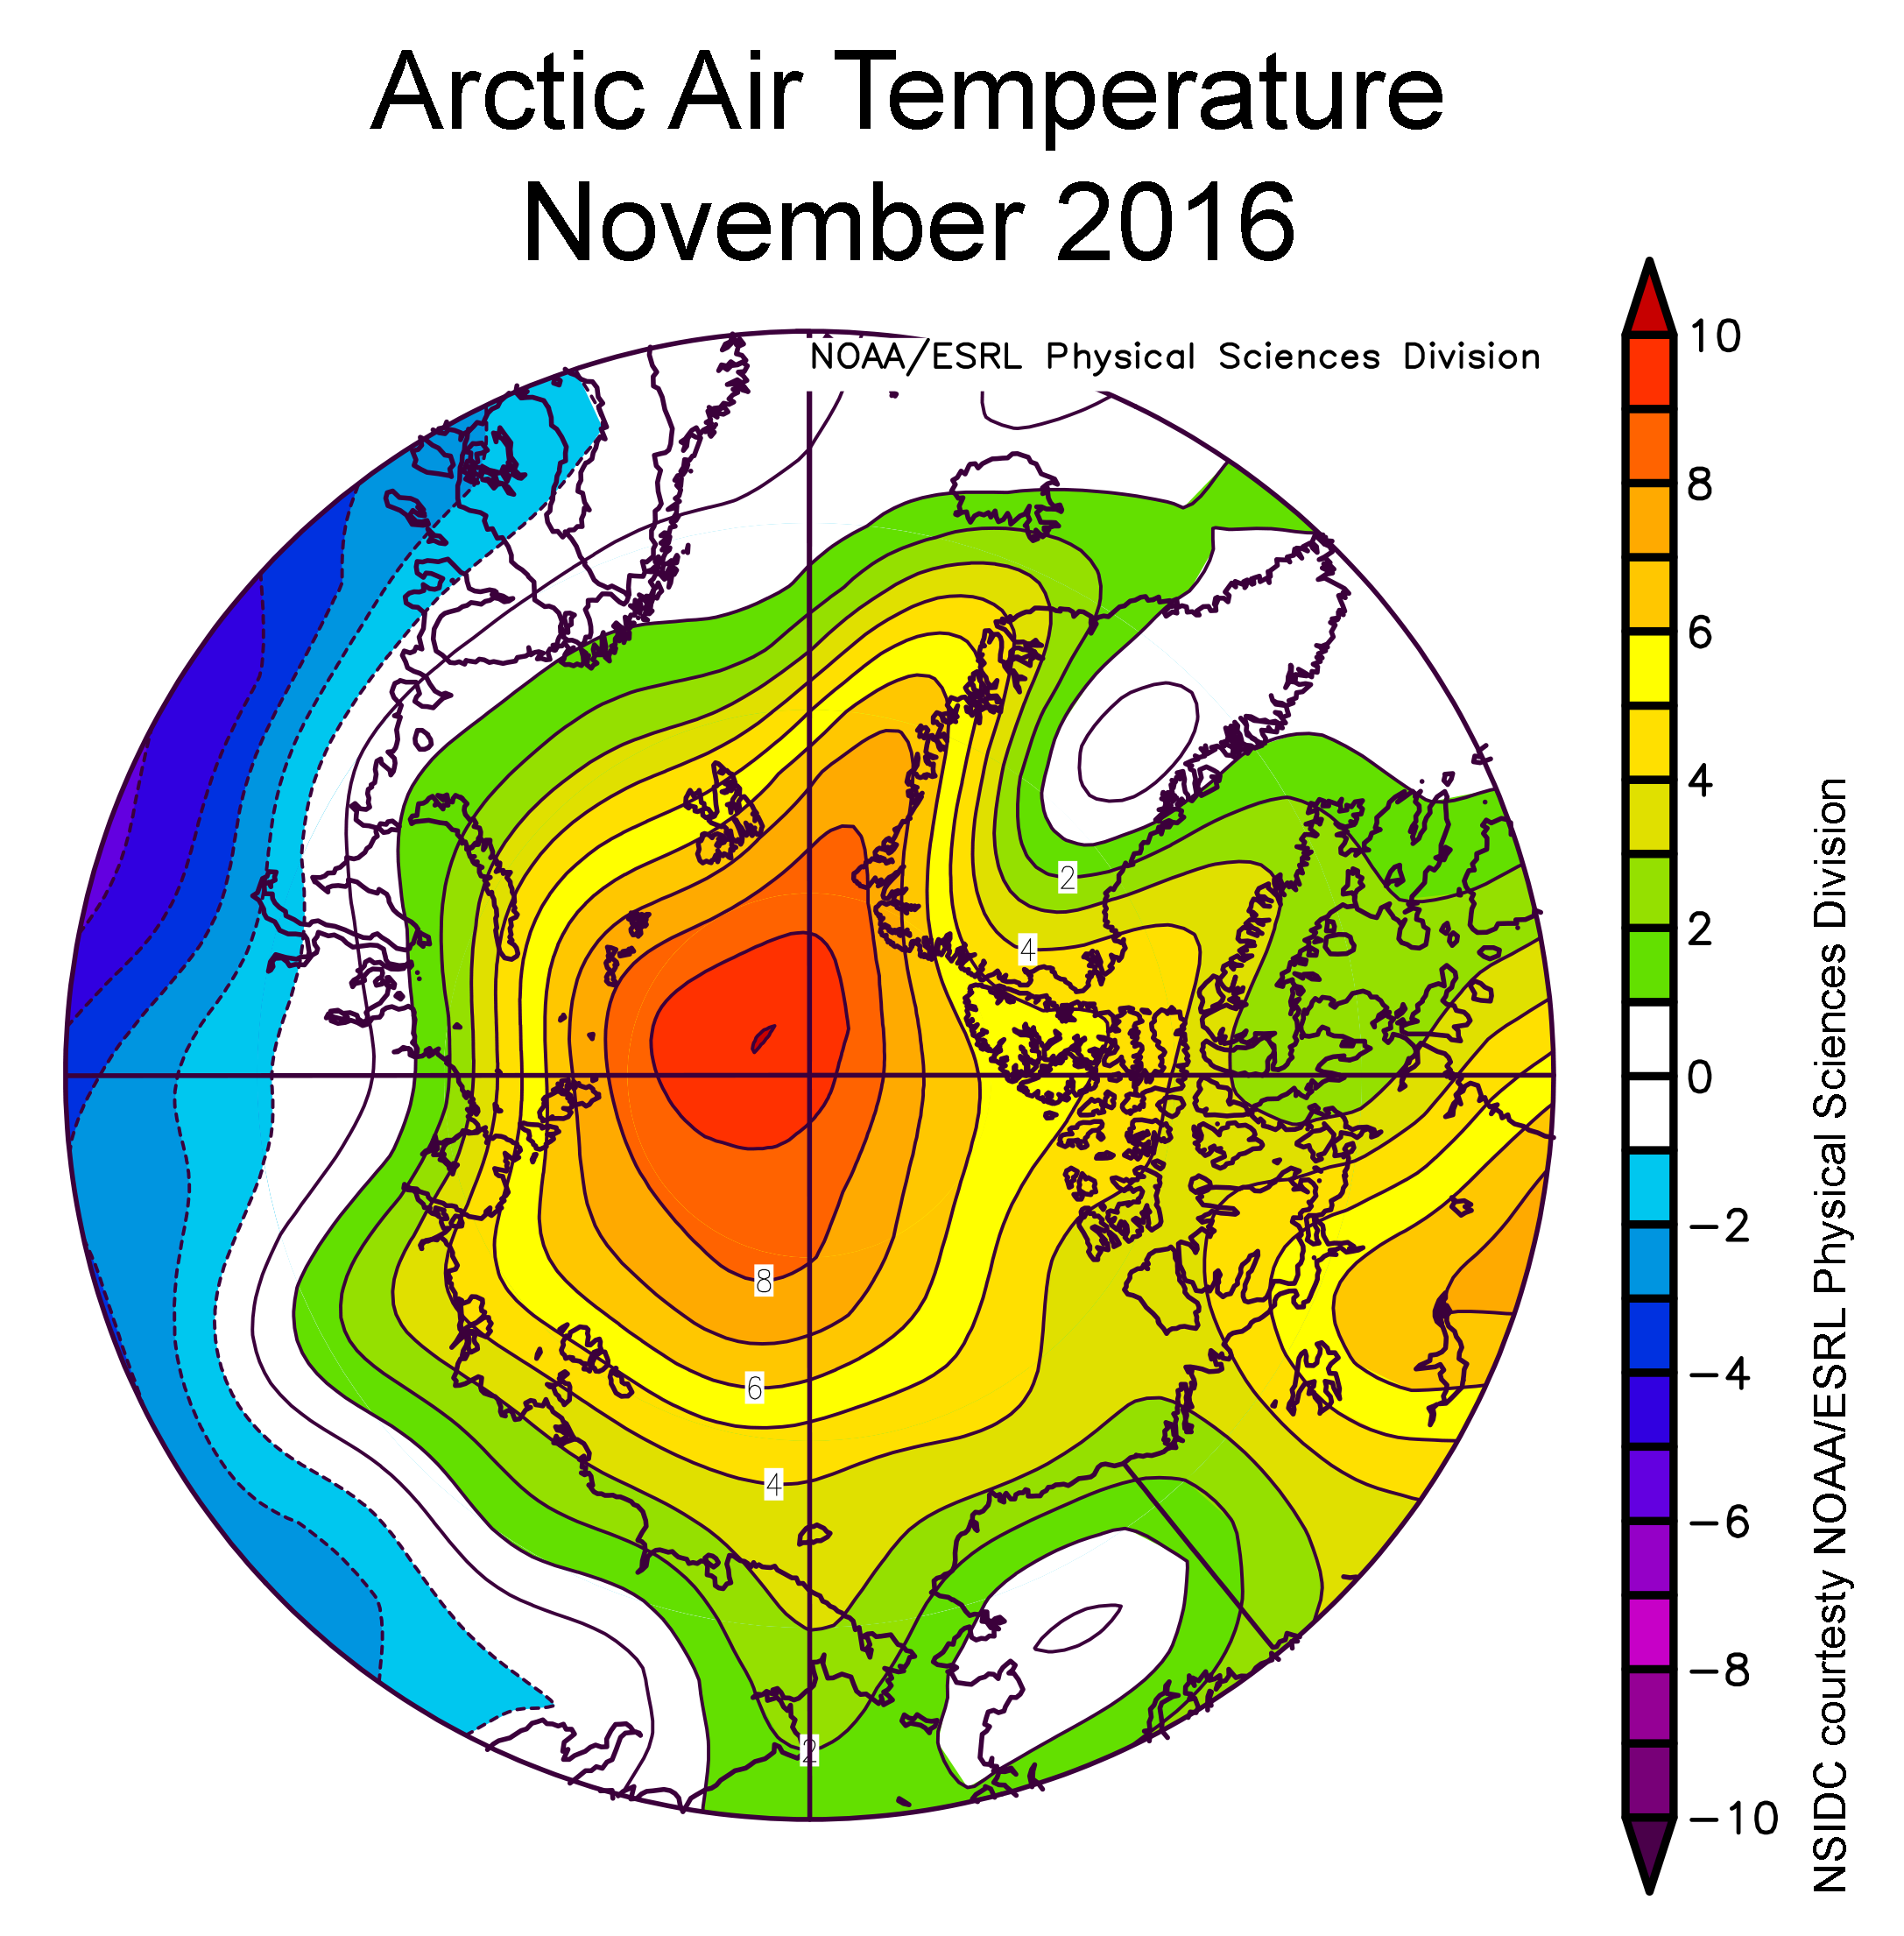
Figure 2b. This plot shows air temperature difference from average in the Arctic for November 2016. Air temperatures at the 925 hPa (approximately 2,500 feet) level in the atmosphere were above the 1981 to 2010 average over the entire Arctic Ocean and, locally up to 10 C (18 F) above average near the North Pole. This is in sharp contrast to northern Eurasia, where temperatures were up to 4-8 C (7-14 F) below average. Credit: NSIDC courtesy NOAA/ESRL Physical Sciences Division. High-resolution image
Continuing the warm Arctic pattern seen in October, November air temperatures were far above average over the Arctic Ocean and Canada. Air temperatures at the 925 hPa level (about 2,500 feet above sea level) were above the 1981 to 2010 average over the entire Arctic Ocean and, locally up to 10 degrees Celsius (18 degrees Fahrenheit) above average near the North Pole. This is in sharp contrast to northern Eurasia, where temperatures were as much as 4 to 8 degrees Celsius (7 to 14 degrees Fahrenheit) below average (Figure 2b). Record snow events were reported in Sweden and across Siberia early in the month.
In autumn and winter, the typical cyclone path is from Iceland, across the Norwegian Sea and into the Barents Sea. This November, an unusual jet stream pattern set up, and storms instead tended to enter the Arctic Ocean through Fram Strait (between Svalbard and Greenland). This set up a pattern of southerly wind in Fram Strait, the Eurasian Arctic and the Barents Sea and accounts for some of the unusual warmth over the Arctic Ocean. The wind pattern also helped push the ice northwards and helps to explain why sea ice in the Barents Sea retreated during November.
Sea surface temperatures in the Barents and Kara Seas remained unusually high, which also helped prevent ice formation. These high sea surface temperatures are a result of warm Atlantic water circulating onto the Arctic continental shelf seas.
November 2016 compared to previous years
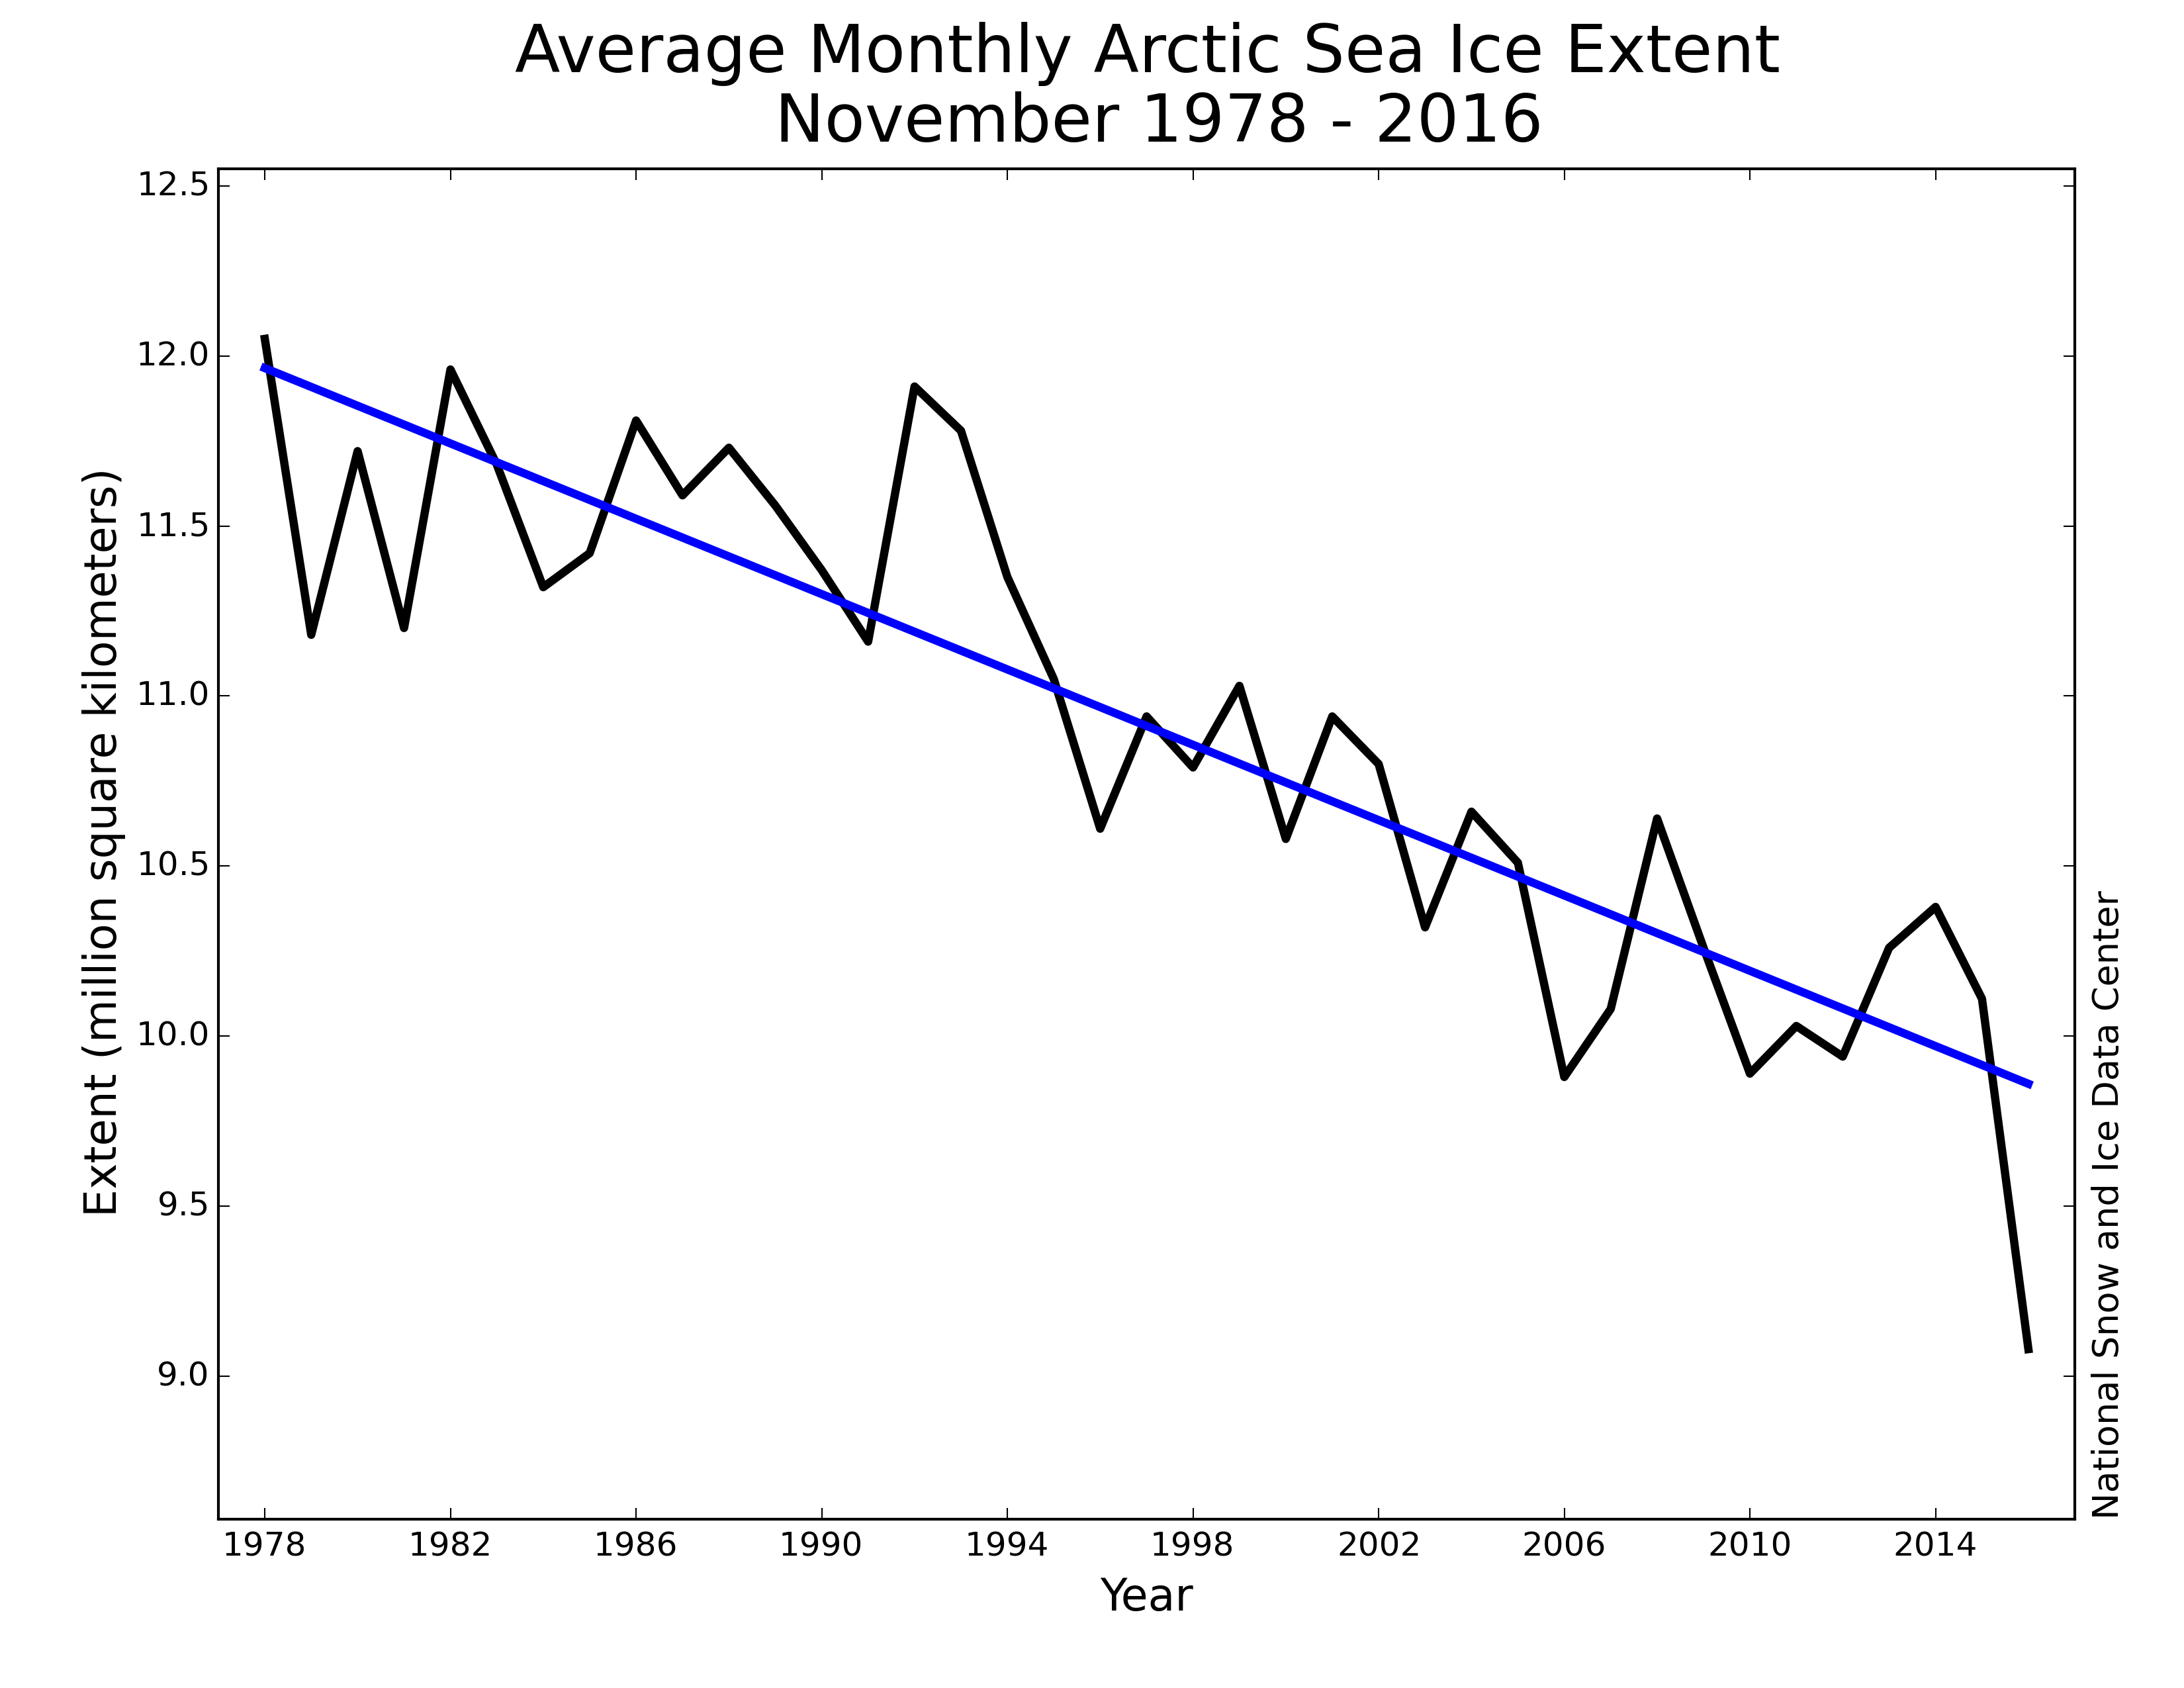
Figure 3. Monthly November ice extent for 1979 to 2016 shows a decline of 5.0% per decade. Credit: National Snow and Ice Data Center. High-resolution image
Through 2016, the linear rate of decline for November is 55,400 square kilometers (21,400 square miles) per year, or 5.0% per decade.
Warm Arctic delays ice formation in Svalbard’s fjords
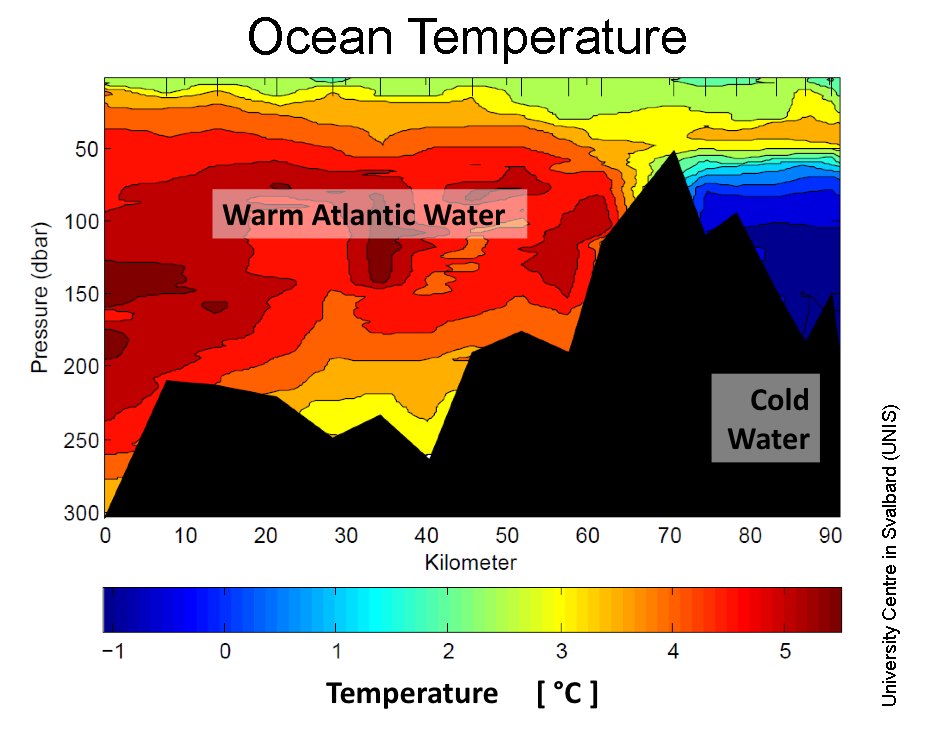
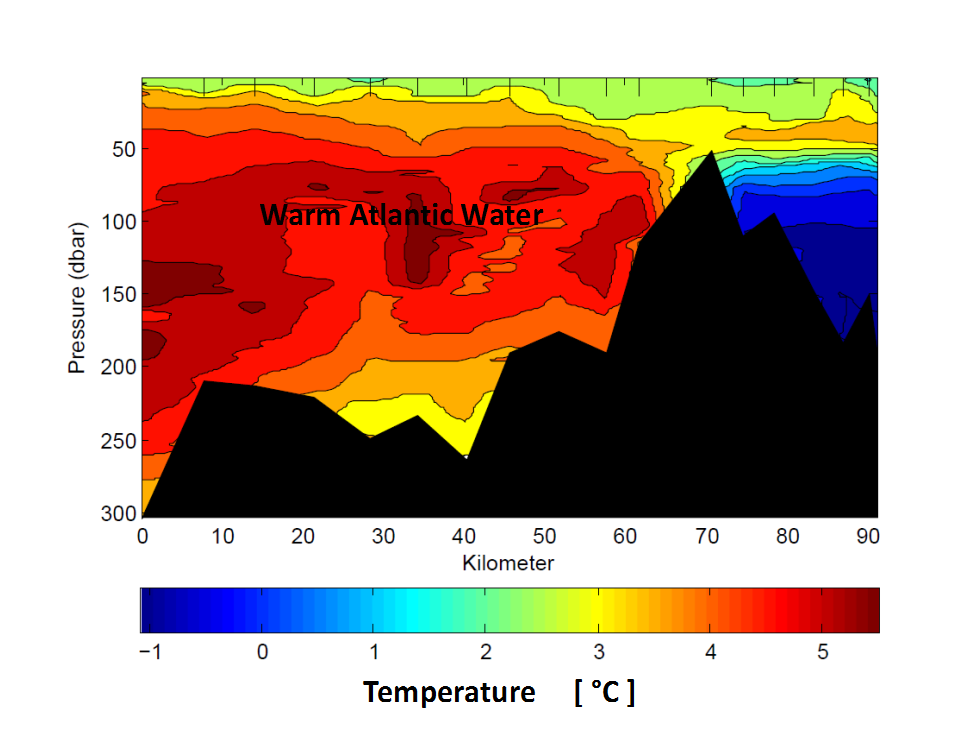
Figure 4a. This plot shows ocean temperature differences from average by depth (y-axis, in decibars; a decibar is approximately one meter) along a transect (x-axis, in kilometers) from the outer continental shelf to the inner parts of Isfjorden, the largest fjord in the Svalbard archipelago, for mid November 2016. (Areas in black show the undersea topography.) Atlantic Water is as warm as 5 C (41 F) and the surface layer still about 2 C (36 F). The surface layer would normally have cooled to the salinity adjusted freezing point at (-1.8 C, 29 F) at this time of year, enabling sea ice formation. Credit: University Centre in Svalbard. High-resolution image
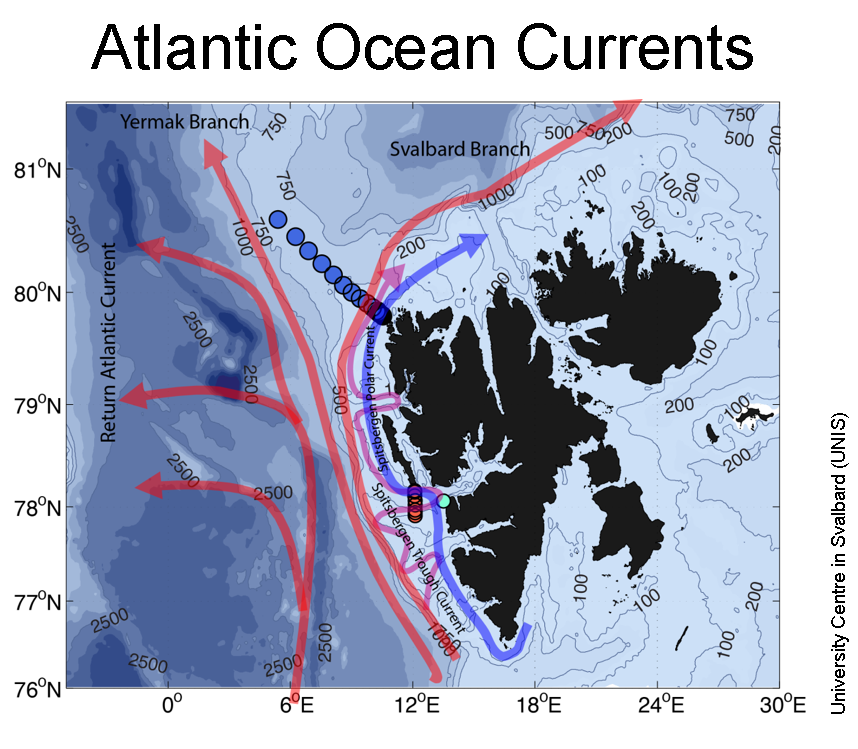
Figure 4b. The West Spitsbergen Current consists of three branches (red arrows) that transport warm and salty Atlantic Water northward: the Return Atlantic Current (westernmost branch), the Yermak Branch and the Svalbard Branch. The Spitsbergen Trough Current (purple) transports Atlantic Water from the Svalbard Branch into the troughs indenting the shelf along Svalbard. Since 2006, changes in atmospheric circulation have resulted in more warm Atlantic Water reaching these fjords. The blue and red circles on the figure indicate locations where hydrographic data were collected. Credit: University Centre in Svalbard (UNIS). High-resolution image

Figure 4c. An inky-black polar night—but no cooling. The moon is the only source of light in the Arctic now, and here shines over open water in Isfjorden, the largest fjord in the Svalbard archipelago, in mid-November 2016. Credit: Lars H. Smedsrud. High-resolution image
In the Svalbard archipelago, sea ice usually begins to form in the inner parts of the fjords in early November. This November, however, no sea ice was observed. Throughout autumn, the wind pattern transported warm and moist air to Svalbard, leading to exceptionally high air temperatures and precipitation, which fell as rain.
Atmospheric and oceanic conditions in the fjord system were assessed by students from the University Centre in Svalbard. They noted an unusually warm ocean surface layer about 4 degrees Celsius (7 degrees Fahrenheit) above the salinity-adjusted freezing point (Figure 4a). Coinciding with exceptionally high air temperatures over Svalbard during autumn, the water has hardly cooled at all, and it is possible that no sea ice will form this winter.
The above-average ocean temperatures arose in part from changes in ocean currents that bring warm and salty Atlantic Water into the fjords. As the warm Gulf Stream moves east, it becomes the branching North Atlantic Drift. One small branch is named the West Spitsbergen Current (Figure 4b). This current flows along the continental shelf on the west coast of Svalbard and is one mechanism for transporting heat towards the fjords. Since 2006, changes in atmospheric circulation have resulted in more Atlantic water reaching these fjords, reducing sea ice production in some and stopping ice formation entirely in others.
Antarctic sea ice continues to track well below average

Figure 5a. Monthly November Antarctic sea ice extent for 1979 to 2016 shows an increase of 0.36% per decade. Credit: National Snow and Ice Data Center. High-resolution image
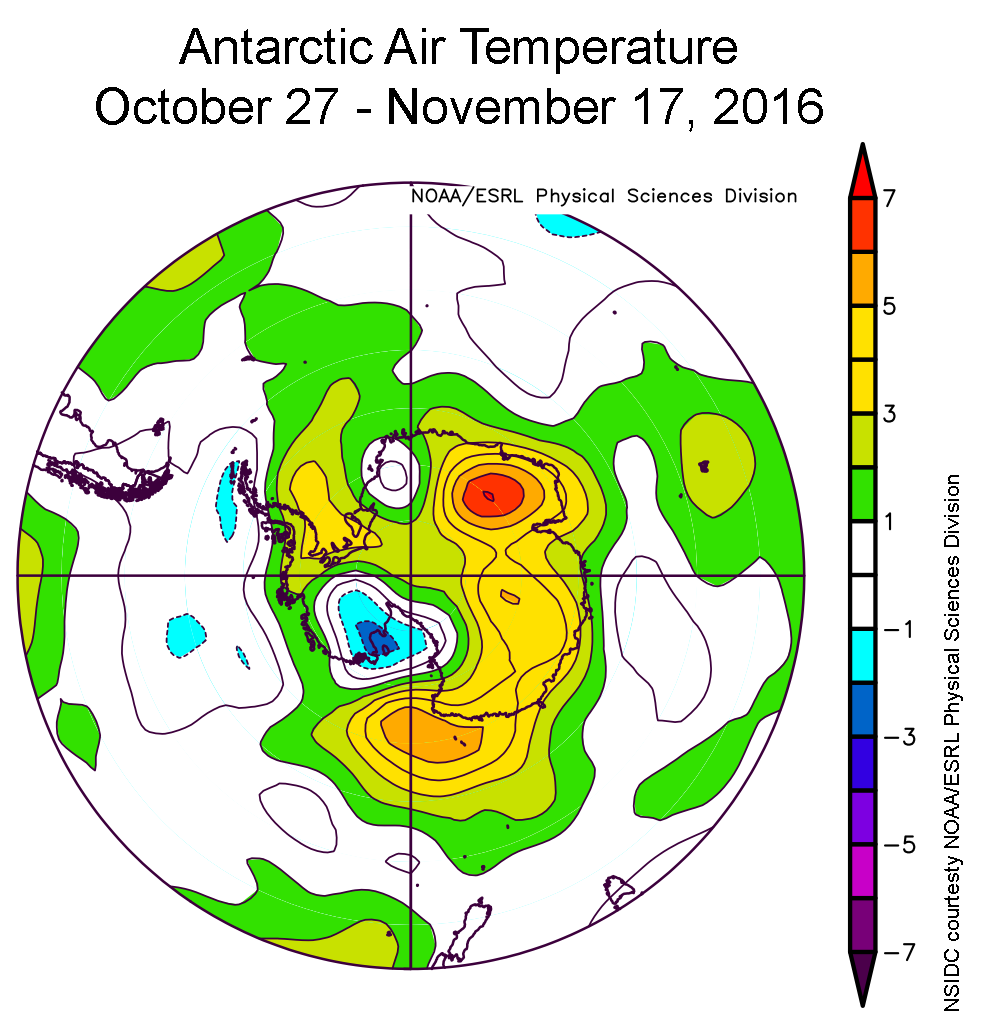
Figure 5b. This plot shows air temperature difference from average in the Antarctic for October 27 to November 17, 2016. Air temperatures at the 925 hPa level (approximately 2,500 feet) during the period of rapid sea ice decline in Antarctica (October 27 through November 17) were 2-4 C (4-7 F) above average near the sea ice edge. Credit: NSIDC courtesy NOAA/ESRL Physical Sciences Division. High-resolution image
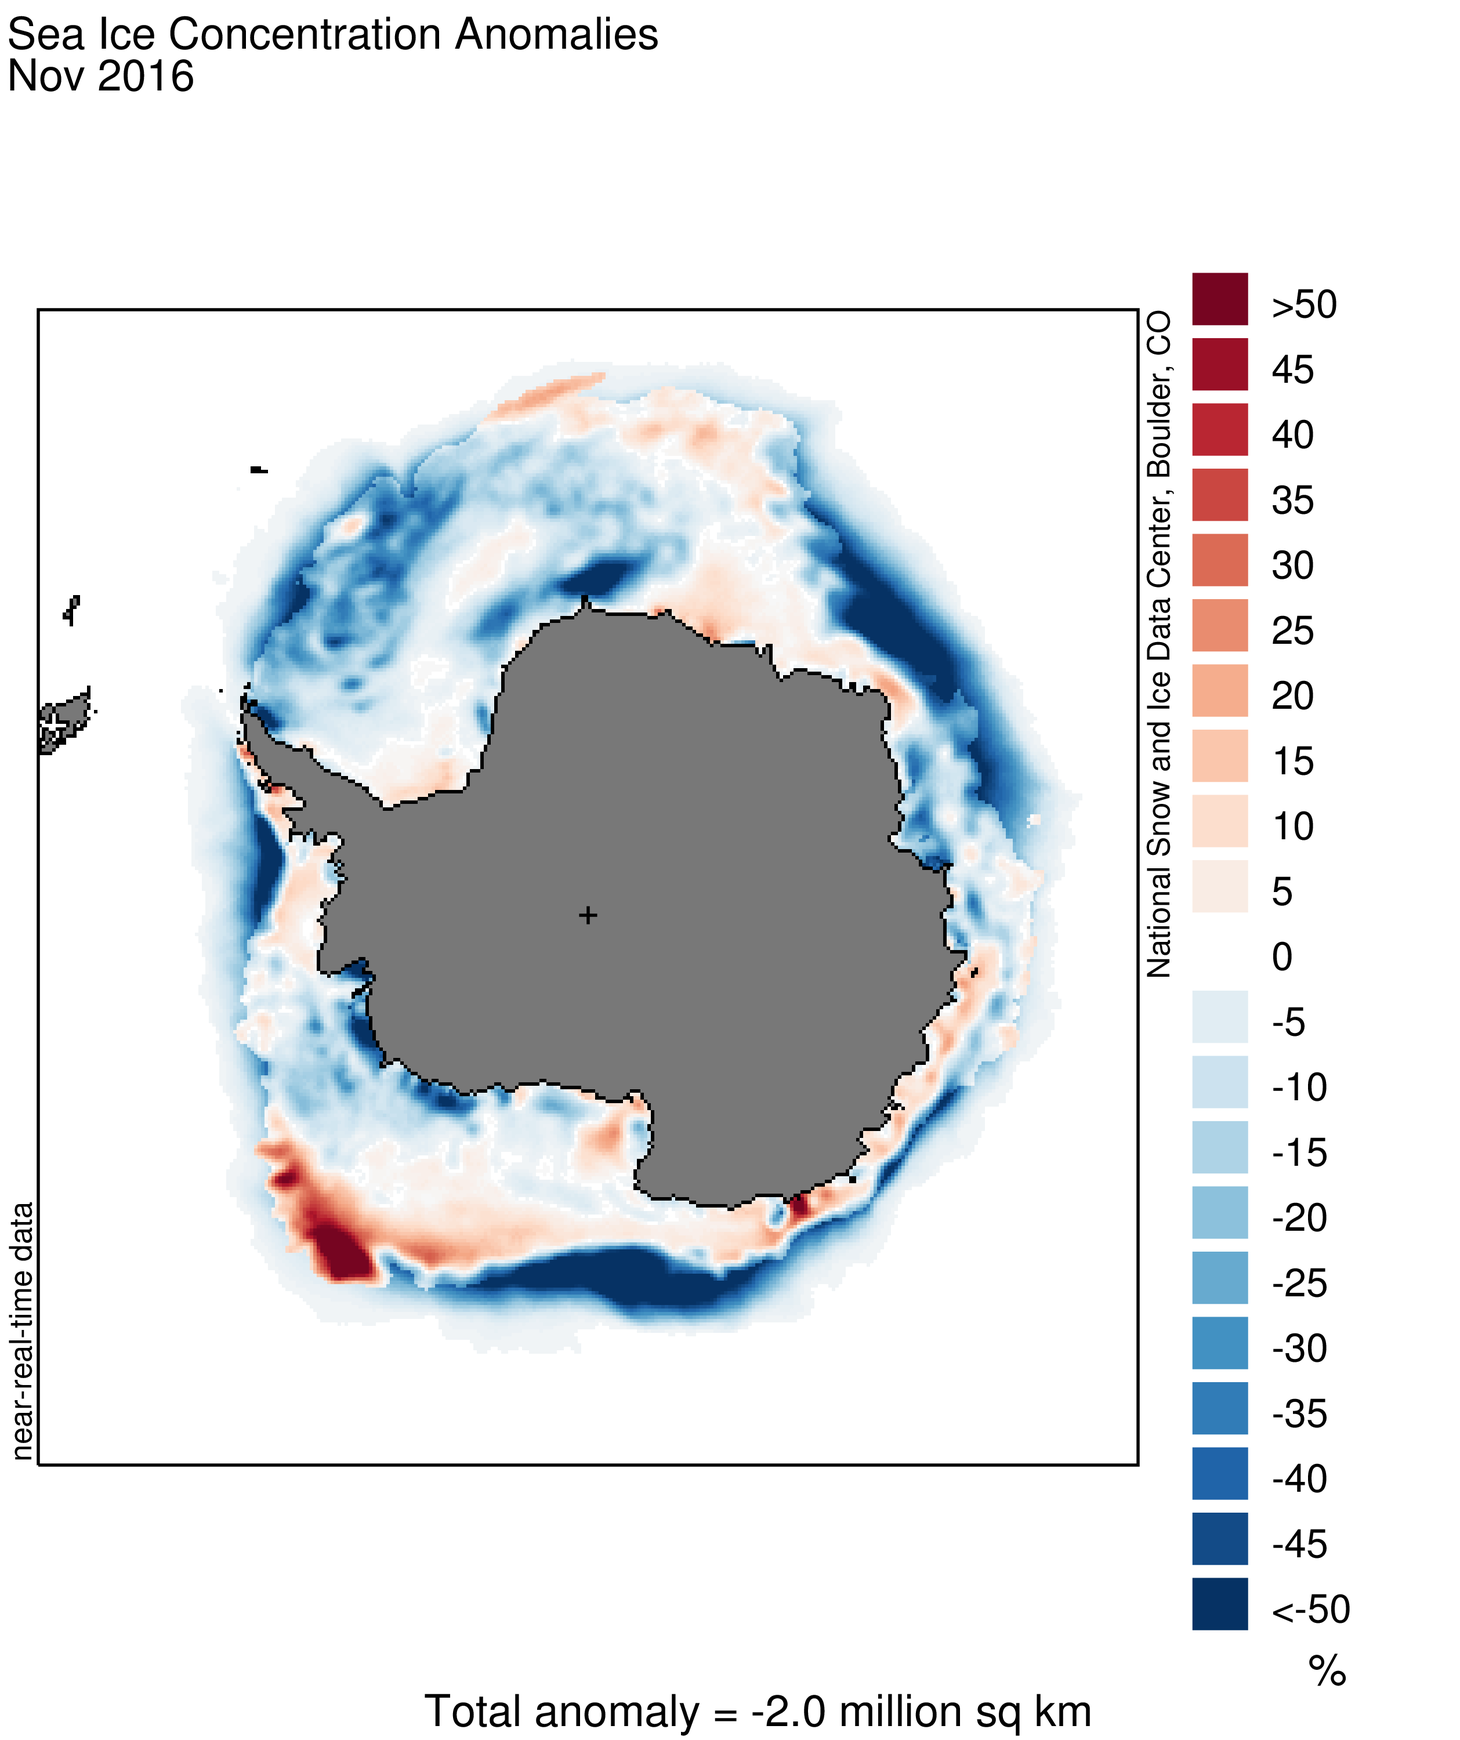
Figure 5c. This map of sea ice concentration difference from average for November 2016 shows very low ice extent in three areas of the ice edge (near the Antarctic Peninsula, near the western Ross Sea and Wilkes Land, and near Enderby Land) as well as extensive areas of lower-than-average concentration within the interior ice pack in the Weddell Sea, Amundsen Sea, and near the Amery Ice Shelf. Sea Ice Index data. Credit: National Snow and Ice Data Center. High-resolution image
This year, Antarctic sea ice reached its annual maximum extent on August 31, much earlier than average, and has since been declining at a fairly rapid pace, tracking more than two standard deviations below the 1981-2010 average. This led to a new record low for the month of November over the period of satellite observations (Figure 5a). Average extent in November was 14.54 million square kilometers (5.61 million square miles). This was 1.0 million square kilometers (386,000 square miles) below the previous record low of 15.54 million square kilometers (6.00 million square miles) set in 1986 and 1.81 million square kilometers (699,000 square miles) below the 1981 to 2010 average.
For the month, Antarctic ice extent was 5.7 standard deviations below the long-term average. This departure from average was more than twice as large as the previous record departure from average, set in November 1986.
Ice extent is lower than average on both sides of the continent, particularly within the Indian Ocean and the western Ross Sea, but also to a lesser extent in the Weddell Sea and west of the Antarctic Peninsula in the eastern Bellingshausen Sea. Moreover, several very large polynyas (areas of open water within the pack) have opened in the eastern Weddell and along the Amundsen Sea and Ross Sea coast.
Air temperatures at the 925 mbar level were 2 -4 C (4-7 F) above average near the sea ice edge during late October and early November, corresponding to the period of rapid sea ice decline (Figure 5b).
The entire austral autumn and winter (since March 2016) was characterized by generally strong west to east winds blowing around the continent. This was associated with a positive phase of the Southern Annular Mode, or SAM. This pattern tends to push the ice eastward, but the Coriolis force acting in the ice adds a component of northward drift. During austral spring (September, October and November), the SAM index switched from strongly positive (+4 in mid-September, a record) to negative (-2.8 in mid-November). When the westerly wind pattern broke down in November, winds in several areas of Antarctica started to blow from the north. Over a broad area near Wilkes Land, the ice edge was pushed toward the continent. Areas with southward winds were also located between Dronning Maud Land and Enderby Land, and near the Antarctic Peninsula. This created three regions where ice extent quickly became much less extensive than usual (Figure 5c), reflected in the rapid decline in extent for the Antarctic as a whole. Interspersed with the areas of compressed sea ice and winds from the north, areas of south winds produced large open water areas near the coast, creating the polynyas.
Arctic sea ice loss linked to rising anthropogenic CO2 emissions
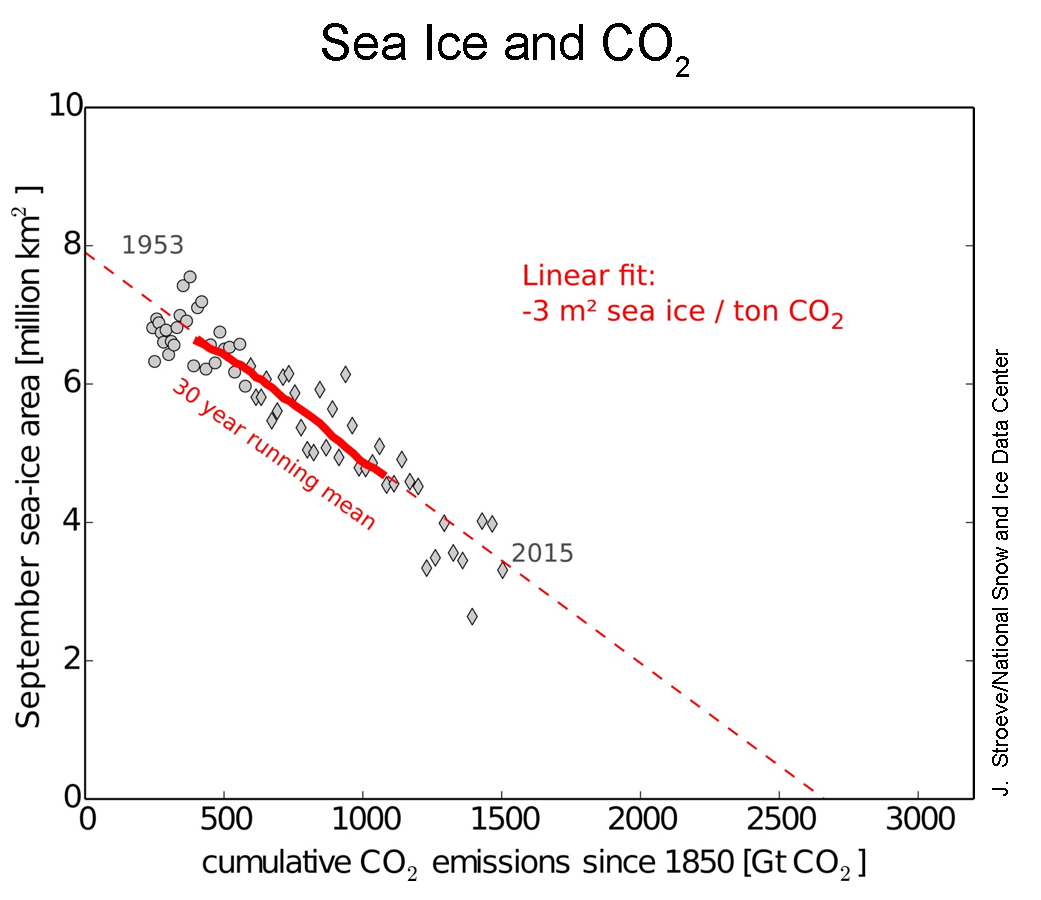
Figure 6. This plot shows the relationship between September sea ice extent (1953-2015) and cumulative CO2 emissions since 1850. Grey diamonds represent the individual satellite data values; circles represent pre-satellite era values; the solid red line shows the 30-year running average. The dotted red line indicates the linear relationship of 3 square meters per metric ton of CO2. Credit: J. Stroeve, National Snow and Ice Data Center High-resolution image
A new study published in the journal Science links Arctic sea ice loss to cumulative CO2 emissions in the atmosphere through a simple linear relationship (Figure 6). Researchers conducting the study, including NSIDC scientist Julienne Stroeve, examined this linear relationship based on observations from the satellite and pre-satellite era since 1953, and in climate models. The observed relationship is equivalent to a loss of 3 square meters (9.9 square feet) for every metric ton of CO2 added to the atmosphere, compared the average from all the climate models of 1.75 square meters (5.8 square feet). This smaller value, or lower sensitivity, from the models is consistent with findings that the models tend to be generally conservative relative to observations in regard to how fast the Arctic has been losing its summer ice cover. The observed rate of ice loss per metric ton of CO2 allows individuals to more easily grasp their contribution to Arctic sea ice loss.
Global sea ice far below average

Figure 7. This time series of daily global sea ice extent (Arctic plus Antarctic, month and first day of month on the x-axis) shows global extent tracking below the 1981-2010 average. Sea Ice Index data. Credit:W. Meier, NASA Cryospheric Sciences, GSFC. High-resolution image
As a result of both Arctic and Antarctic sea ice currently tracking at record low levels, global ice extent near November’s end stood at 7.3 standard deviations below average (Figure 7). However, the processes governing the evolution of sea ice in both hemispheres is a result of different atmospheric and oceanic processes and geographies and it unlikely that record low conditions in the two hemispheres are connected. Also, it is not especially instructive to assess a global sea ice extent because the seasons are opposite in the two hemispheres. In November the Arctic is in its ice growth season while Antarctic is losing ice. Antarctic sea ice as a whole has slightly increased over the past four decades (but with the last two austral winters having average and below average extent, respectively). The slight overall increase in Antarctic ice over the satellite record can be broadly linked to wind patterns that have helped to expand the ice cover towards the north (towards the equator).
NASA Operation IceBridge completes its 2016 Antarctic campaign
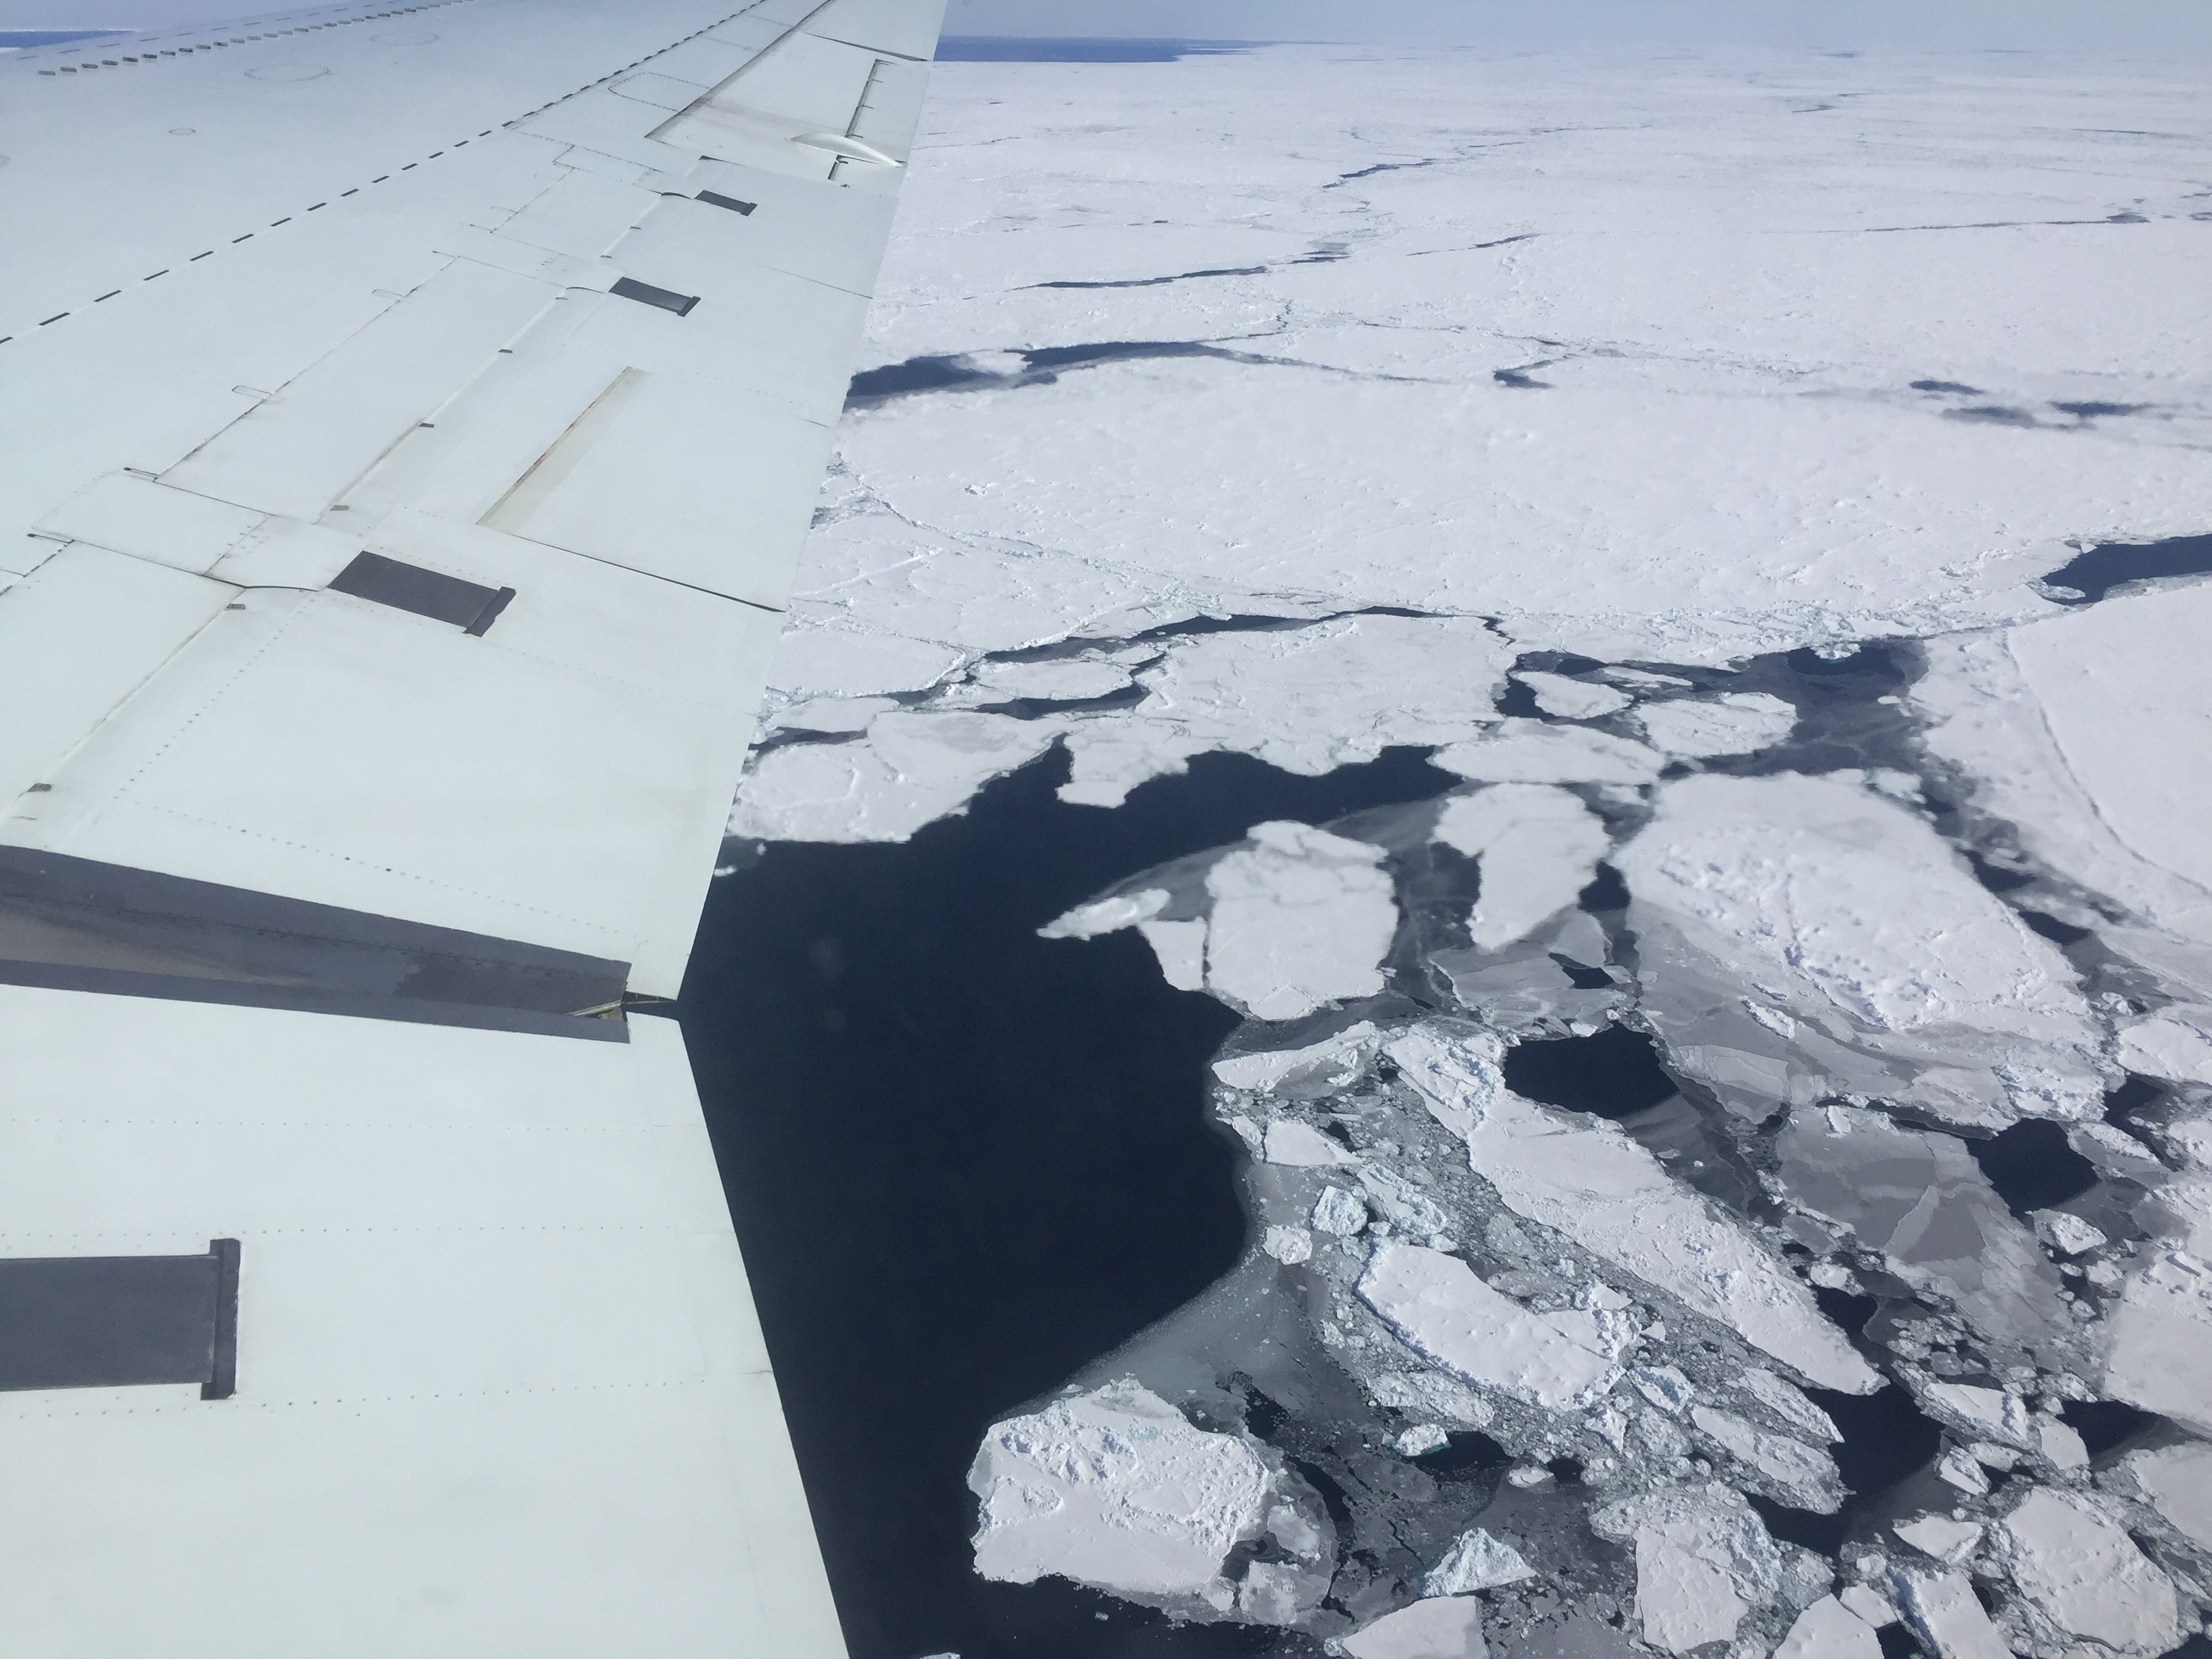
Figure 8. This photograph from Operation IceBridge shows broken floes of sea ice floating in the Weddell Sea. A large area of open water can be seen on the horizon. Credit: J. Beitler/National Snow and Ice Data Center. High-resolution image
In October, four NSIDC personnel accompanied the NASA Operation IceBridge campaign on its airborne surveys over Antarctica. The campaign completed a total of 24 flights over the continent in October and November, covering sea ice, land ice, ice shelves, and glaciers as Antarctica headed into its austral summer. Missions surveyed sea ice in the Weddell and Bellinghausen Seas with instruments that measure both sea ice extent and thickness. These measurements add to a time series of data that measures changes in sea ice and helps researchers assess the future trajectory of the ice pack and its impact on the climate. Visual observations from the flights confirmed that areas in the Bellingshausen Sea that are typically covered in sea ice were open water this year.
One of this year’s missions flew over a massive rift in the Antarctic Peninsula’s Larsen C Ice Shelf. Ice shelves are the floating parts of ice streams and glaciers, and they buttress the grounded ice behind them; when ice shelves collapse, the ice behind accelerates toward the ocean, where it then adds to sea level rise. Larsen C neighbors a smaller ice shelf that disintegrated in 2002 after developing a rift similar to the one now growing in Larsen C.
The IceBridge scientists measured the Larsen C fracture to be about 70 miles long, more than 300 feet wide and about a third of a mile deep. The crack completely cuts through the ice shelf but it does not go all the way across it. Once it does, it will produce an iceberg roughly the size of the state of Delaware.
The mission of Operation IceBridge is to collect data on changing polar land and sea ice and maintain continuity of measurements between NASA’s Ice, Cloud and Land Elevation Satellite (ICESat) missions. The original ICESat mission ended in 2009, and its successor, ICESat-2, is scheduled for launch in 2018. Operation IceBridge, which began in 2009, is currently funded until 2019. The planned overlap with ICESat-2 will help scientists validate the satellite’s measurements.
Further reading
Nilsen, F., Skogseth, R., Vaardal-Lunde, J., and Inall, M. 2016. A simple shelf circulation model: Intrusion of Atlantic Water on the West Spitsbergen Shelf. J. Physical Oceanography, 46, 1209-1230. doi:10.1175/JPO-D-15-0058.1
Notz, D. and J. Stroeve. 2016. Observed Arctic sea-ice loss directly follows anthropogenic CO2 emission. Science, 11 Nov 2016: Vol. 354, Issue 6313, pp. 747-750. doi:10.1126/science.aag2345.
Parkinson, C. 2014. Global sea ice coverage from satellite data: Annual cycle and 35-year trends. Journal of Climate, December 2014. doi:10.1175/JCLI-D-14-00605.1.
References
Fetterer, F., K. Knowles, W. Meier, and M. Savoie. 2016, updated daily. Sea Ice Index, Version 2. Boulder, Colorado USA. NSIDC: National Snow and Ice Data Center. doi:10.7265/N5736NV7.


 Posts
Posts