Blog Archive

Saturday, February 16, 2019

Chris Mooney, WaPo: Earth Is 'Missing' at Least 20 Ft of Sea Level Rise. Antarctica Could Be The Time Bomb

main article image

by Chris Mooney, The Washington Post, February 12, 2019

Some 115,000 years ago, Homo sapiens were still living in bands of hunter gatherers, largely confined to Africa. We still shared the globe with the Neanderthals, although it's not clear we had met them yet.

And though these various hominids didn't know it, the Earth was coming to the end of a major warm period. It was one that's quite close to our current climate, but with one major discrepancy - seas at the time were 20 to 30 feet (6 to 9 metres) higher.
During this ancient period, sometimes called the Eemian, the oceans were about as warm as they are today.
And last month, intriguing new research emerged suggesting that Northern Hemisphere glaciers have already retreated just as far as they did in the Eemian, driven by dramatic warming in Arctic regions.
The finding arose when a team of researchers working on Baffin Island, in northeastern Canada, sampled the remains of ancient plants that had emerged from beneath fast-retreating mountain glaciers.
And they found that the plants were very old indeed, and had probably last grown in these spots some 115,000 years ago.
That's the last time the areas were actually not covered by ice, the scientists believe.
"It's very hard to come up with any other explanation, except that at least in that one area where we're working ... the last century is as warm as any century in the last 115,000 years," said Gifford Miller, a geologist at the University of Colorado in Boulder who led the research on Baffin Island.
But if Miller is right, there's a big problem. We have geological records of sea levels from the Eemian. And the oceans, scientists believe, were 20 to 30 feet (6 to 9 metres) higher.
Some extra water likely came from Greenland, whose ice currently contains over 20 feet (6 metres) of potential sea level rise. But it couldn't have been just Greenland, because that entire ice sheet did not melt at the time.
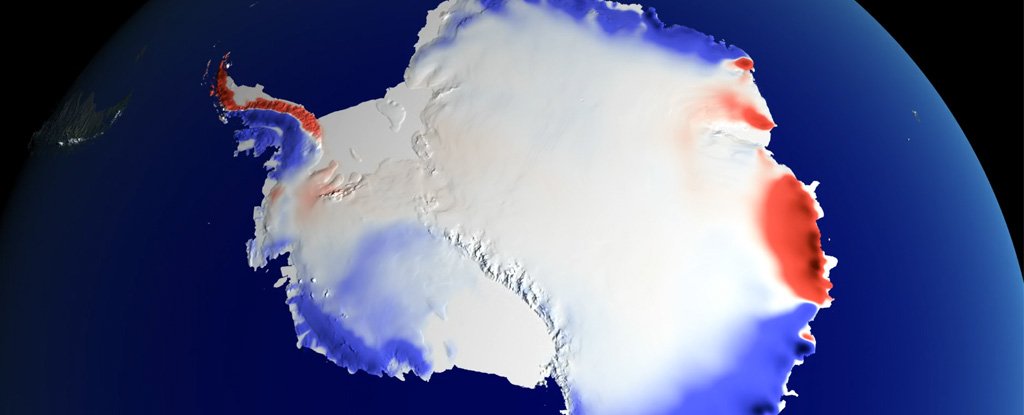
That's why researchers also suspect a collapse of the most vulnerable part of Antarctica, the West Antarctic ice sheet. This region could easily supply another 10 feet (3 metres) of sea level rise, or more.
"There's no way to get tens of meters of sea level rise without getting tens of meters of sea level rise from Antarctica," said Rob DeConto, an Antarctic expert at the University of Massachusetts.
Trying to understand how Antarctica will fall
Scientists are now intensely debating precisely which processes could have played out then — and how soon they'll play out again. After all, West Antarctica has already been shown, once again, to be beginning a retreat.
Some researchers, including DeConto, think they have found a key process - called marine ice cliff collapse - that can release a lot of sea level rise from West Antarctica in a hurry.
But they're being challenged by another group, whose members suspect the changes in the past were slow - and will be again.
To understand the dispute, consider the vulnerable setting of West Antarctica itself.
Essentially, it's an enormous block of ice mostly submerged in very cold water. Its glaciers sit up against the ocean in all directions, and toward the center of the ice sheet, the seafloor slopes rapidly downward, even as the surface of the ice sheet itself grows much thicker, as much as two miles thick in total.
As much as a mile and a half of that ice rests below the sea level, but there is still plenty of ice above it, too.
So if the gateway glaciers start to move backward - particularly a glacier named Thwaites, by far the largest of them - the ocean would quickly have access to much thicker ice.
The idea is that during the Eemian, this whole area was not a block of ice at all, but an unnamed sea. Somehow, the ocean got in, toppling the outer glacial defenses, and gradually setting all of West Antarctica afloat and on course to melting.
DeConto, with his colleague David Pollard, built a model that looked to the Eemian, and another ancient warm period called the Pliocene, to try to understand how this could happen.
In particular, they included two processes that can remove glaciers. One, dubbed 'marine ice sheet instability,' describes a situation in which a partially submerged glacier gets deeper and thicker as you move toward its center.
In this configuration, warm water can cause a glacier to move backward and downhill, exposing ever thicker ice to the ocean - and thicker ice flows outward faster.
So the loss feeds upon itself.
Marine ice sheet instability is probably underway already in West Antarctica, but in the model, it wasn't enough. DeConto and Pollard also added another process that they say is currently playing out in Greenland, at a large glacier called Jakobshavn.
Jakobshavn is moving backward down an undersea hill slope, just in the way that it is feared the much larger Thwaites will drift. But Jakobshavn is also doing something else. It is constantly breaking off thick pieces at its front, almost like a loaf of bread, dropping slice after slice.
That's because Jakobshavn no longer has an ice shelf, a floating extension that used to grow out over the ocean at the front of the glacier and stabilize it. The shelf collapsed as Greenland warmed in the past two decades.
As a result, Jakobshavn now presents a steep vertical front to the sea. Most of the glacier's ice is under the water, but more than 100 meters (330 feet) extend above it - and for DeConto and Pollard, that's the problem. That's too much to be sustained.
Ice is not steel. It breaks. And breaks. And breaks.
This additional process, called 'marine ice cliff collapse,' causes an utter disaster if you apply it to Thwaites. If Thwaites someday loses its own ice shelf and exposes a vertical front to the ocean, you would have ice cliffs hundreds of meters above the surface of the water.
DeConto and Pollard say that such cliffs would continually fall into the sea. And when they added this computation, it not only recreated Eemian sea level rise, it greatly increased their projection of how much ice Antarctica could yield in this century - more than three feet.
Since there are other drivers of sea level rise, like Greenland, this meant that we could see as much as six feet in total in this century, roughly double prior projections. And in the next century, the ice loss would get even worse.
"What we pointed out was, if the kind of calving that we see in Greenland today were to start turning on in analogous settings in Antarctica, then Antarctica has way thicker ice, it's a way bigger ice sheet, the consequences would be potentially really monumental for sea level rise," DeConto said.
Moreover, the process, he argues, is essential to understanding the past - and thus how we could replicate it.
"We cannot recreate six meters of sea level rise early in the Eemian without accounting for some brittle fracture in the ice sheet model," said DeConto.
A massive debate over marine ice cliffs
Tamsin Edwards is not convinced. A glaciologist at Kings College London, she is lead author - with a number of other Antarctic experts - of a study published Wednesday in Nature (the same journal that published DeConto and Pollard in 2016) that disputes their model, in great detail.
Using a statistical technique to examine the results, Edwards and her collaborators find that the toppling of ice cliffs is not necessary to reproduce past warm periods after all.
They also present lower sea level rise possibilities from Antarctica in this century. If they're right, the worst case is back down to about 40 centimeters, or a little over a foot, rather than three to four feet.
"Things may not be as absolutely terrible as that last study predicted," Edwards said. "But they're still bad."
It is a new science, she said, and without more modeling it's unclear how ice cliffs will ultimately affect sea level rise.
But then what happened in the Eemian? Edwards thinks it just took a long time to lose West Antarctica. That it wasn't fast. After all, the entire geologic period was thousands of years long.
"We're an impatient lot, humans, and the ice sheets don't respond in a decade, they're slow beasts," she said.
DeConto says he's learned something from the critique.
"The Edwards study does illustrate the need for more in-depth statistics than we originally applied to our 2016 model output, but the models are evolving rapidly and they have already changed considerably since 2016," he said in a written statement.
But he's not backing down on marine ice cliffs. The new critique, DeConto said, implies that "these processes aren't important for future sea level rise. And I think to me, that's kind of a dangerous message."
He certainly has his allies. Richard Alley, a well known glaciologist at Penn State University who has published with DeConto and Pollard, wrote in an email that "cliff retreat is not some strange and unexpected physical process; it is happening now in some places, has happened in the past, and is expected wherever sufficiently high temperatures occur in ocean or air around ice flowing into the ocean."
The Eemian - but worse?
There's one important thing to consider - the Eemian occurred without humans emitting lots of greenhouse gases.
Atmospheric carbon dioxide was far lower than it is today. The event was instead driven by changes in the Earth's orbit around the sun, leading to more sunlight falling on the northern hemisphere.
The big difference, this time around, is that humans are heating things up far faster than what is believed to have happened in the geologic past.
And that makes a key difference, said Ted Scambos, an Antarctic researcher who is leading the US side of an international multimillion dollar mission to study Thwaites Glacier, and who is a senior researcher at the National Snow and Ice Data Center in Colorado.
"The current pace of climate change is very fast," Scambos said, and the rate of warming might cause glaciers to behave differently than they did in the past.
Accordingly, Scambos says he sees the current debate as fruitful - "it's the discussion that needs to happen" - but that it doesn't lessen his worry about the fate of Thwaites Glacier if it retreats far enough.
"There's no model that says the glacier won't accelerate if it gets into those conditions," said Scambos. "It just has to."
Humans were nowhere near the Antarctic in the Eemian - and we have never, in the modern period, seen a glacier as big as Thwaites retreat. It's possible something is going to happen that we don't have any precedent or predictions for.
Just last week, for instance, scientists reported a large cavity opening beneath one part of the glacier - something they said models could not have predicted.
There is a massive stake involved now in at least trying to figure out what could happen - before it actually does. It will help determine whether humans, now organized and industrialized and masters of fossil fuels, are poised to drive a repeat of our own geological history.
2019 © The Washington Post

Friday, February 15, 2019

FloodList: New Scale to Characterize Strength and Impacts of Atmospheric River Storms


A team of researchers led by Scripps Institution of Oceanography at the University of California San Diego has created a scale to characterize the strength and impacts of “atmospheric rivers” - long narrow bands of atmospheric water vapor pushed along by strong winds. They are prevalent over the Pacific Ocean and can deliver to the Western United States much of its precipitation during just a few individual winter storms.
Atmospheric river hits California. Credit: Jesse Allen, NASA Earth Observatory/ VIIRS satellite
They are the source of most of the West Coast’s heaviest rains and floods, and are a main contributor to water supply. For example, roughly, 80 percent of levee breaches in California’s Central Valley are associated with land-falling atmospheric rivers.
The scale, described in the February 2019 Bulletin of the American Meteorological Society, assigns five categories to atmospheric rivers (ARs) using as criteria the amount of water vapor they carry and their duration in a given location. The intention of the scale is to describe a range of scenarios that can prove beneficial or hazardous based on the strength of atmospheric rivers.
The scale was developed by F. Martin Ralph, director of the Center for Western Water and Weather Extremes (CW3E) at Scripps, in collaboration with Jonathan Rutz from the National Weather Service and several other experts. It ranks atmospheric rivers from 1 to 5 and creates the categories “weak,” “moderate,” “strong,” “extreme,” and “exceptional.” It uses amounts of water vapor within an atmospheric river as its basis and a period of 24-48 hours as its standard measurement of duration. When an AR lasts in an area for less than 24 hours, it is demoted by one category, but if it lingers for more than 48 hours, it is promoted. This approach is based on research showing that a combination of strong water vapor transport with long duration over a location, is what causes the greatest impacts. Unlike the hurricane scale, recently criticized for not representing adequately the impacts of slow-moving lower-category hurricanes, the AR scale builds in duration as a fundamental factor.
Key describing atmospheric river intensity categories. Credit: CW3E/Scripps Institution of Oceanography at UC San Diego.
The scale ranks ARs as follows:
  • AR Cat 1 (Weak): Primarily beneficial. For example, a February 23, 2017, AR hit California, lasted 24 hours at the coast, and produced modest rainfall.
  • AR Cat 2 (Moderate): Mostly beneficial, but also somewhat hazardous. An atmospheric river on November 19-20, 2016, hit Northern California, lasted 42 hours at the coast, and produced several inches of rain that helped replenish low reservoirs after a drought.
  • AR Cat 3 (Strong): Balance of beneficial and hazardous. An atmospheric river on October 14-15, 2016, lasted 36 hours at the coast, produced 5-10 inches of rain that helped refill reservoirs after a drought, but also caused some rivers to rise to just below flood stage.
  • AR Cat 4 (Extreme): Mostly hazardous, but also beneficial. For example, an atmospheric river on January 8-9, 2017, that persisted for 36 hours produced up to 14 inches of rain in the Sierra Nevada and caused at least a dozen rivers to reach flood stage.
  • AR Cat 5 (Exceptional): Primarily hazardous. For example, a Dec. 29 1996 to January 2, 1997, atmospheric river lasted over 100 hours at the Central California coast. The associated heavy precipitation and runoff caused more than $1 billion in damages.
Ralph is considered a leading authority on atmospheric rivers, which were officially defined by the American Meteorological Society in 2017. Researchers have only begun to study atmospheric rivers in depth in the past two decades building on earlier research into extra-tropical cyclone structure and precipitation, especially in the United Kingdom. In that time, they have also come to understand how these events frequently make the difference between flood and drought years in key coastal regions around the world such as California.

All categories of atmospheric river intensity were observed during a 2017 event. Credit: CW3E/Scripps Institution of Oceanography at UC San Diego
Ralph said that the scale could provide a crucial tool to officials with an operational need to assess flood potential in their jurisdictions before storms strike. Unlike other scales that focus primarily on damage potential, such as the Fujita scale for tornadoes or the Saffir-Simpson scale for hurricanes, the atmospheric river scale accounts not only for storms that can prove hazardous, but also for storms that can provide benefits to water supply.
“The scale recognizes that weak ARs are often mostly beneficial because they can enhance water supply and snow pack, while stronger ARs can become mostly hazardous, for example if they strike an area with conditions that enhance vulnerability, such as burn scars, or already wet conditions,” say Ralph and co-authors in the paper appearing today in the February 2019 issue of the Bulletin of the American Meteorological Society, “Extended durations can enhance impacts.”
Coauthors of the paper include weather forecasters, such as meteorologist Jon Rutz and Chris Smallcomb of the National Weather Service (NWS).
“The concept of ARs has directly benefited NWS operations in the West through better scientific understanding, more accurate precipitation forecasts, and a better vehicle for communicating impacts to our partners,” said Rutz. “The AR scale is a significant step forward, providing forecasters with a tool to distinguish between primarily beneficial and primarily hazardous storms. I anticipate that this scale will be adopted and highly used.”
Previous analysis has shown that on the West Coast, the Oregon coast receives the most atmospheric rivers in the “extreme” range (AR Cat 4), averaging about one per year. Washington receives extreme atmospheric rivers about every two years, the Bay Area about every three years and Los Angeles every 10 years. The 1996-1997 atmospheric river that caused the largest flood damages in California since 1950 would be categorized as an “exceptional” AR storm. The strongest atmospheric river storms hitting the Southern California coast annually, typically fall in the “moderate” to “strong” range (AR Cat 2-3).
When atmospheric river storms along the West Coast are predicted, the scale rankings will be updated and communicated via the CW3E website and Twitter handle. This new scale will add to data, seasonal outlooks and precipitation forecasts provided by the center as a resource to water managers, weather forecasters, emergency officials, policy makers, and others.
The researchers said that the atmospheric river scale is intended as a tool to increase situational awareness ahead of a major storm in a way that reflects conditions broadly in a region of roughly 50 km size. It is not intended to represent detailed conditions on smaller spatial scales where variable topography, land surface types, and vulnerabilities vary greatly and thus modulate storm impacts.
“This scale enables improved awareness of the potential benefit versus hazard of a forecast AR,” said co-author Michael Anderson of the California Department of Water Resources. “It can serve as a focal point for discussion between water managers, emergency response personnel and the research community as these key water supply and flood inducing storms continue to evolve in a changing climate.”
“Forecasters in the western U.S. have been using the concept of ARs in their forecasting for a few years now, and many have been looking for a way to distinguish beneficial from hazardous AR storms,” said Rutz. “The scale was designed partly to meet this need, and it is anticipated that it will be used extensively.”
Source: University of California – San Diego

L. A. Times: As lawsuits over climate change heat up, oil industry steps up spurious attacks on its critics

As lawsuits over climate change heat up, oil industry steps up attacks on its critics

The Deepwater Horizon oil rig, aflame in the Gulf of Mexico in 2010. The rig's owner, BP, is one of more than 20 oil companies being sued over their alleged role in climate change. (Gerald Herbert / AP)


by Michael Hiltzik, The Los Angeles Times, February 12, 2019
The oil industry has been depicting itself lately as the target of a conspiracy by scientists, local government officials and climate change activists to make it look bad.
It would be odd to think that a conspiracy is necessary to punch holes in the fossil fuel companies’ public reputation, but here’s the argument presented by the Independent Petroleum Association of America (IPAA), one of the industry’s leading lobby organizations.

“In a highly-coordinated move,” the IPAA declares on its website, “nearly 30 scientists, government officials and third-party organizations recently joined the fledgling climate litigation campaign.” The IPAA labeled this a “free-for-all” and quoted an industry newsletter calling the campaign “a carefully orchestrated effort by local governments in California and elsewhere to use state law to collect damages from companies producing and marketing fossil fuels.”

If you think this sounds like a Goliath pretending to be a David, you are right. The litigation campaign IPAA refers to is a cluster of lawsuits pioneered in 2017 by the California counties of San Mateo, Imperial Beach, Marin, and Santa Cruz, and the cities of Richmond, Oakland, and San Francisco, among other jurisdictions, against more than 20 oil and gas companies.

The plaintiffs assert that the companies freely promoted the use of their products even though they were aware of the products’ effect on global warming — information the industry allegedly suppressed for years. The municipalities are asking that the companies be forced to help pay for the damage wreaked by climate change, including drought, wildfires, sea level rise, and extremes of heat and precipitation. Since the filing of the California cases, similar lawsuits have been filed by Rhode Island, Washington’s King County (that is, Seattle), Baltimore, and New York City.

The oil companies succeeded in transferring the state lawsuits to federal court, where they expect to face less liability under the law. The plaintiffs’ argument that the cases belong back in state court is being heard by the U.S. 9th Circuit Court of Appeals in San Francisco.

What has the industry vibrating at the moment is a sheaf of eight friend-of-the-court, or amicus, briefs all filed on January 29, 2019, with the appellate court supporting the transfer back to state court. Among other parties, the briefs were filed by the California Assn. of Counties, the Natural Resources Defense Council, a group of six prominent oil company critics, and the National League of Cities.

To the industry, this looks like a cabal. In a blog post, the IPAA found something sinister in “the fact that all eight of the briefs were filed within hours of one another on a random January afternoon (i.e. there wasn’t a court-designated deadline).” Not only was that “reason enough to suspect some level of coordination took place,” the blog post observes, but “signing onto the amicus briefs were many of the activists and politicians who have played key roles in the broader campaign to take down the oil and natural gas industry for years.”

A couple of points are pertinent here. First of all, there was indeed a court-designated deadline for filing the briefs — January 29, the day they were filed. The court’s procedural calendar specifies that amicus briefs must be filed no later than seven days after the main brief of the party they’re supporting. The California plaintiffs filed their brief on January 22, seven days earlier. So much for the “coordination.”

Second, why should it be so odd that the supporters of the cities and counties are drawn from the community of fossil fuel critics? Who else?

Let’s examine some of the industry’s other points. Among the chief targets of its pushback are Naomi Oreskes and Geoffrey Supran of the Department of the History of Science at Harvard University, who filed one of the amicus briefs, in conjunction with four other scholars with interest in climate change science.

Oreskes and Supran were the authors of a 2017 study detailing the industry’s determined, decades-long effort to suppress scientific evidence of global warming caused by the burning of fossil fuels, despite warnings by its own scientific researchers that the phenomenon was genuine, dangerous, and accelerating. 

We reported here on their study, which focused on Exxon Mobil. They compared hundreds of Exxon Mobil's internal reports and peer-reviewed research papers with its advertising — especially paid "advertorials" the company placed in the op-ed section of the New York Times from 1972 through 2001. The authors concluded that Exxon Mobil had systematically "misled non-scientific audiences about climate science."

The IPAA blog post claims that the Oreskes-Supran study has been debunked, but that’s not so. Their statistical method was questioned by another researcher, who was paid by Exxon Mobil. But the core of their findings wasn’t statistical but empirical. They compared internal company documents with the ad campaign and found them wildly divergent.

Oreskes, in an email, labeled the so-called debunking “the sort of expert-for-hire doubt-mongering” engaged in by the tobacco industry when it was fighting medical science over the dangers of smoking. That’s a topic she’s familiar with, having covered it in the 2010 book “Merchants of Doubt,” co-written with Erik M. Conway.

It’s hardly surprising that the oil industry would be uneasy about the “fledgling climate litigation campaign.” The plaintiffs aim to use state laws to fix blame on the fossil fuel companies in ways that can’t be accomplished under federal environmental laws such as the Clean Air Act.

Indeed, federal law vests the states with primary responsibility for addressing air pollution, according to Victor Sher, the San Francisco attorney representing the counties and cities. “Cases involving false and deceptive marketing, over-promotion of products, campaigns to deceive the public — those are traditional state police power matters that the Clean Air Act doesn’t address at all.”

Federal Judge Vince Chhabria of San Francisco largely agreed last March, when he ordered the lawsuits returned to state court. The oil companies appealed his order, which is why it’s now before the 9th Circuit bench.

The municipalities also are hoping to take advantage of California’s “public nuisance” doctrine, which holds that business can be held responsible for damage done by its products even if their usage was standard practice at the time.

The public nuisance argument was central to a lawsuit brought by California municipalities against lead paint manufacturers that concluded in 2017 with an order that the companies pay to clean up residual lead in dwellings that could pose a health hazard to children in those homes.

There’s no question that the cities and counties face a long and arduous road to saddling the oil industry with the responsibility for climate change and the expense of addressing its impacts. The lead paint lawsuit lasted 17 years before the verdict was made final.

But there’s also no question that the industry did its best to hide what it knew about the prospects of global warming and its products’ role in it. The latest misleading attack on its critics shows, if nothing else, that it still hasn’t learned to tell the truth, the whole truth and nothing but the truth.