Arctic ice extent low overall, high in the Bering Sea
Overall, Arctic sea ice extent remained lower than average in January. However, in the Bering Sea, ice extent was much greater than normal. The heavy ice cover caused problems for fishermen and made for an arduous late-season resupply mission to Nome, Alaska. The Arctic Oscillation, which had been in its positive phase most of the winter so far, switched to a negative mode, bringing cold weather to Europe and changing the direction of sea ice movement.
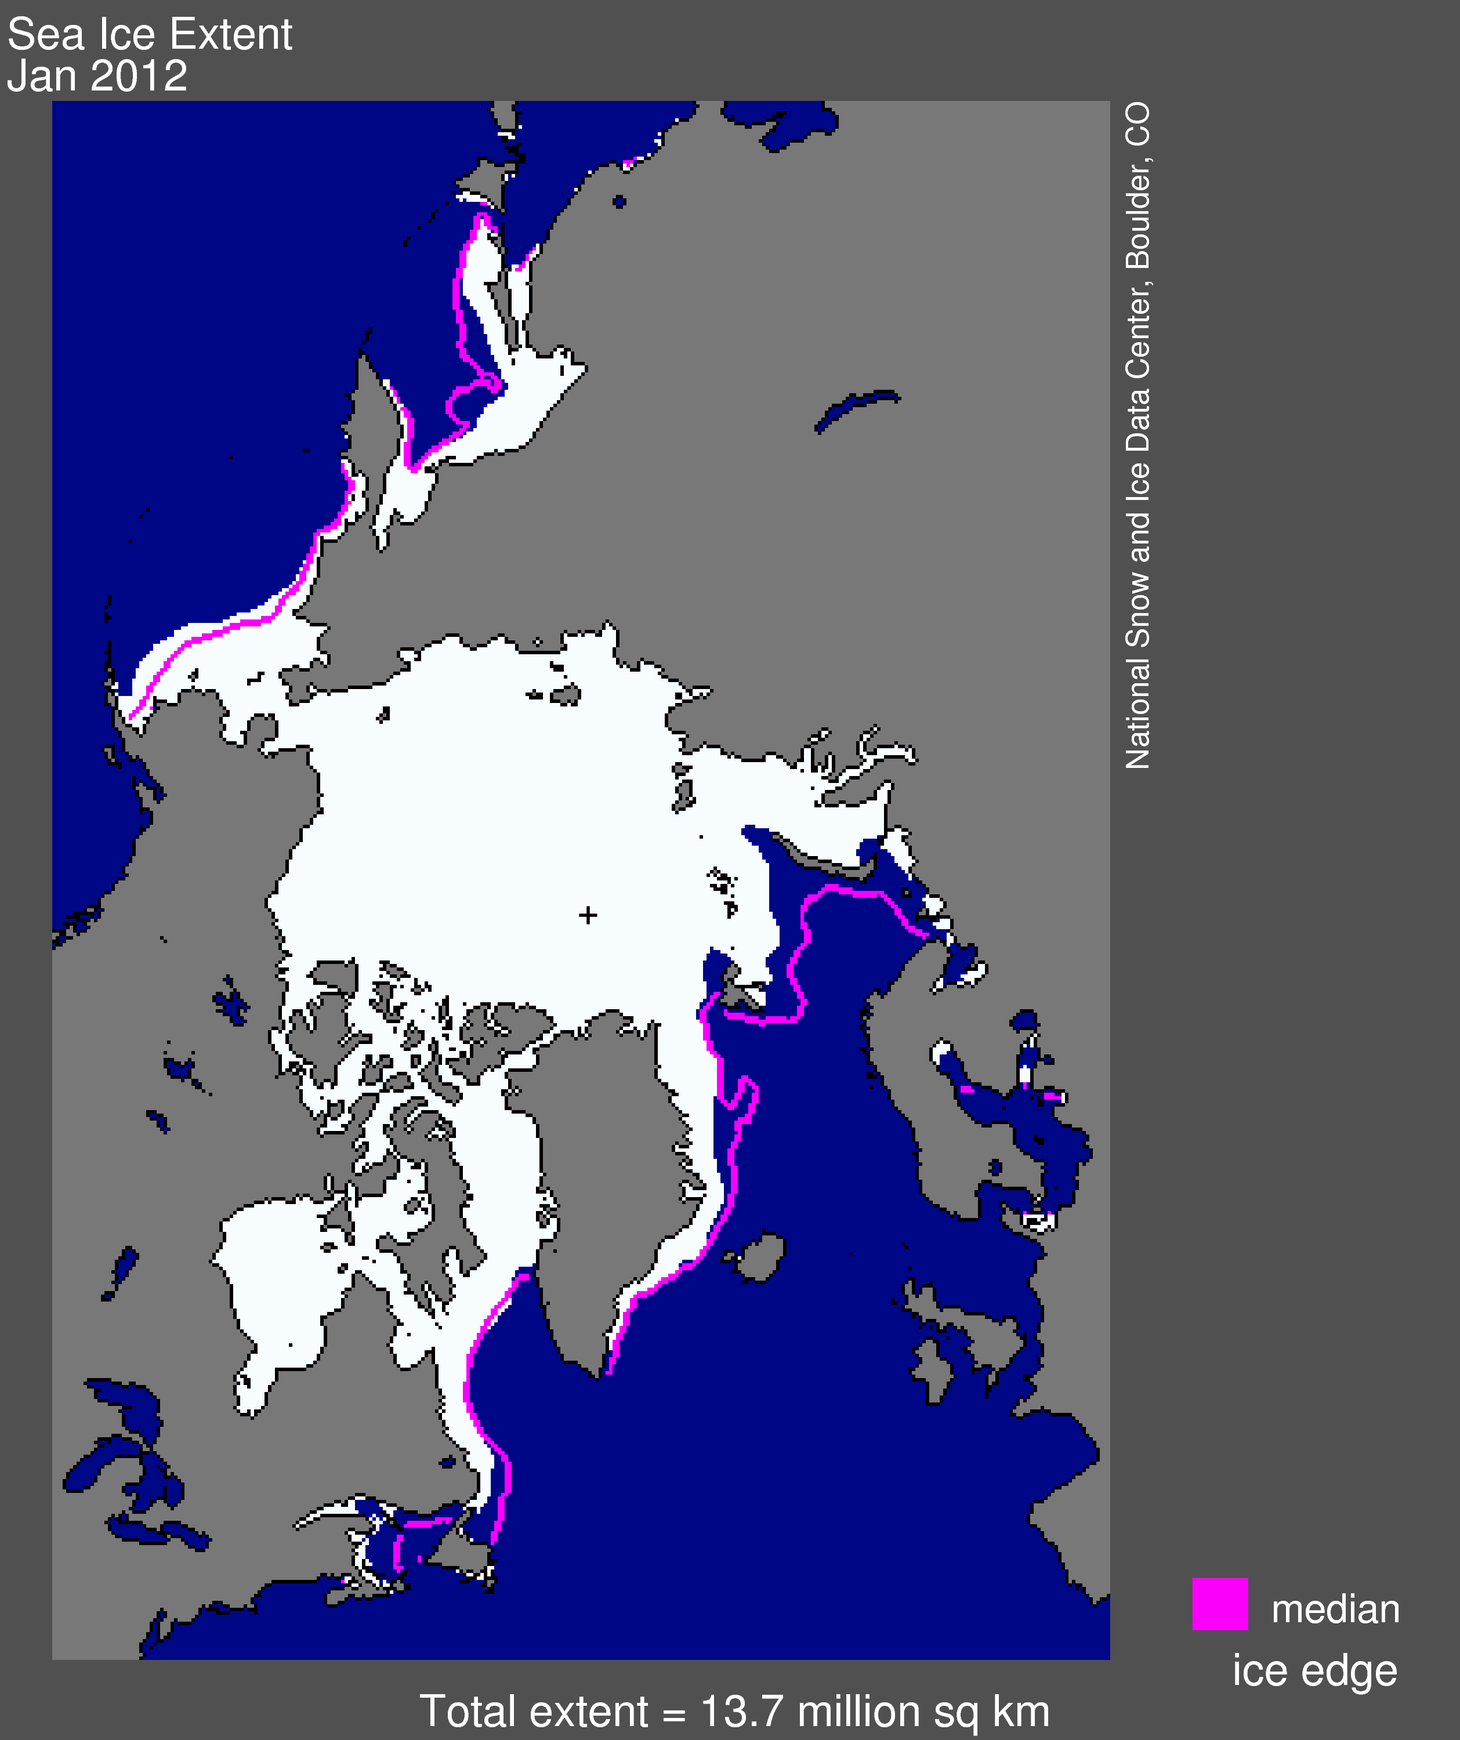
Arctic sea ice extent for January 2012 was 13.73 million square kilometers (5.30 million square miles). The magenta line shows the 1979 to 2000 median extent for that month. The black cross indicates the geographic North Pole. Sea Ice Index data.
Credit: National Snow and Ice Data Center
High Resolution Image
Credit: National Snow and Ice Data Center
High Resolution Image
Overview of conditions
Arctic sea ice extent in January 2012 averaged 13.73 million square kilometers (5.30 million square miles). This is the fourth-lowest January ice extent in the 1979 to 2012 satellite data record, 1.10 million square kilometers (425,000 square miles) below the 1979 to 2000 average extent.
Arctic sea ice extent in January 2012 averaged 13.73 million square kilometers (5.30 million square miles). This is the fourth-lowest January ice extent in the 1979 to 2012 satellite data record, 1.10 million square kilometers (425,000 square miles) below the 1979 to 2000 average extent.
As in December, ice extent was lower than normal on the Atlantic side of the Arctic, especially in the Barents and Kara Seas. However, on the other side of the Arctic, ice extent in the Bering Sea was much greater than average, reaching the second-highest levels for January in the satellite record. The greater-than-normal ice extent in the Bering Sea partly compensated for low ice extent on the Atlantic side of the Arctic Ocean, but ice extent as a whole remained far below average.
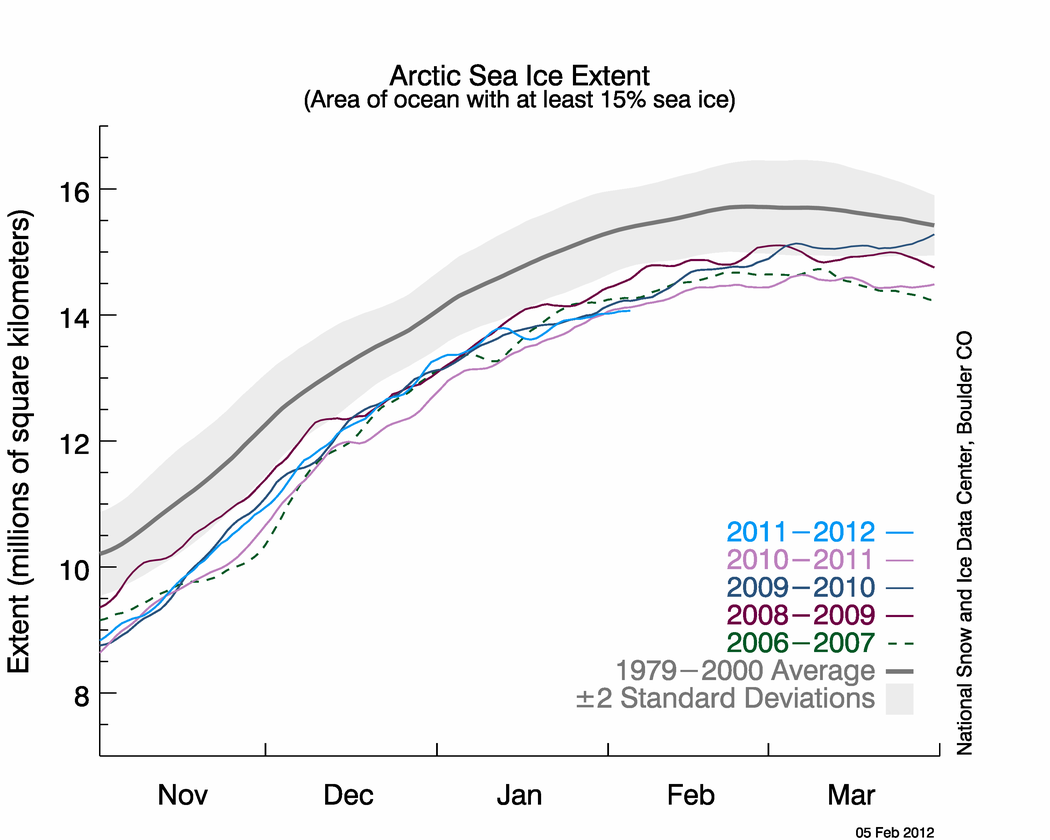
The graph above shows daily Arctic sea ice extent as of February 5, 2012, along with the ice extents for the previous four years. 2011 is shown in light blue, 2010 is in pink, 2009 in dark blue, 2008 is in purple, and 2007, the year with the record low minimum, is dashed green. The gray area around the average line shows the two standard deviation range of the data.
Sea Ice Index data. Credit: National Snow and Ice Data Center. High Resolution Image
Sea Ice Index data. Credit: National Snow and Ice Data Center. High Resolution Image
Conditions in context
The growth rate for Arctic sea ice in January was the slowest in the satellite record. After growing relatively quickly early in January, ice extent declined briefly in the middle of the month, and then grew more slowly than normal for the rest of the month. The slow growth likely stemmed from winds from the south and west that compressed the sea ice in the Kara and Barents seas, and above-average temperatures and winds that limited ice growth in the Sea of Okhotsk.
The growth rate for Arctic sea ice in January was the slowest in the satellite record. After growing relatively quickly early in January, ice extent declined briefly in the middle of the month, and then grew more slowly than normal for the rest of the month. The slow growth likely stemmed from winds from the south and west that compressed the sea ice in the Kara and Barents seas, and above-average temperatures and winds that limited ice growth in the Sea of Okhotsk.
Overall, the Arctic gained 765,000 square kilometers (295,000 square miles) of ice during the month. This was 545,000 square kilometers (210,000 square miles) less than the average ice growth rate for January 1979 to 2000.
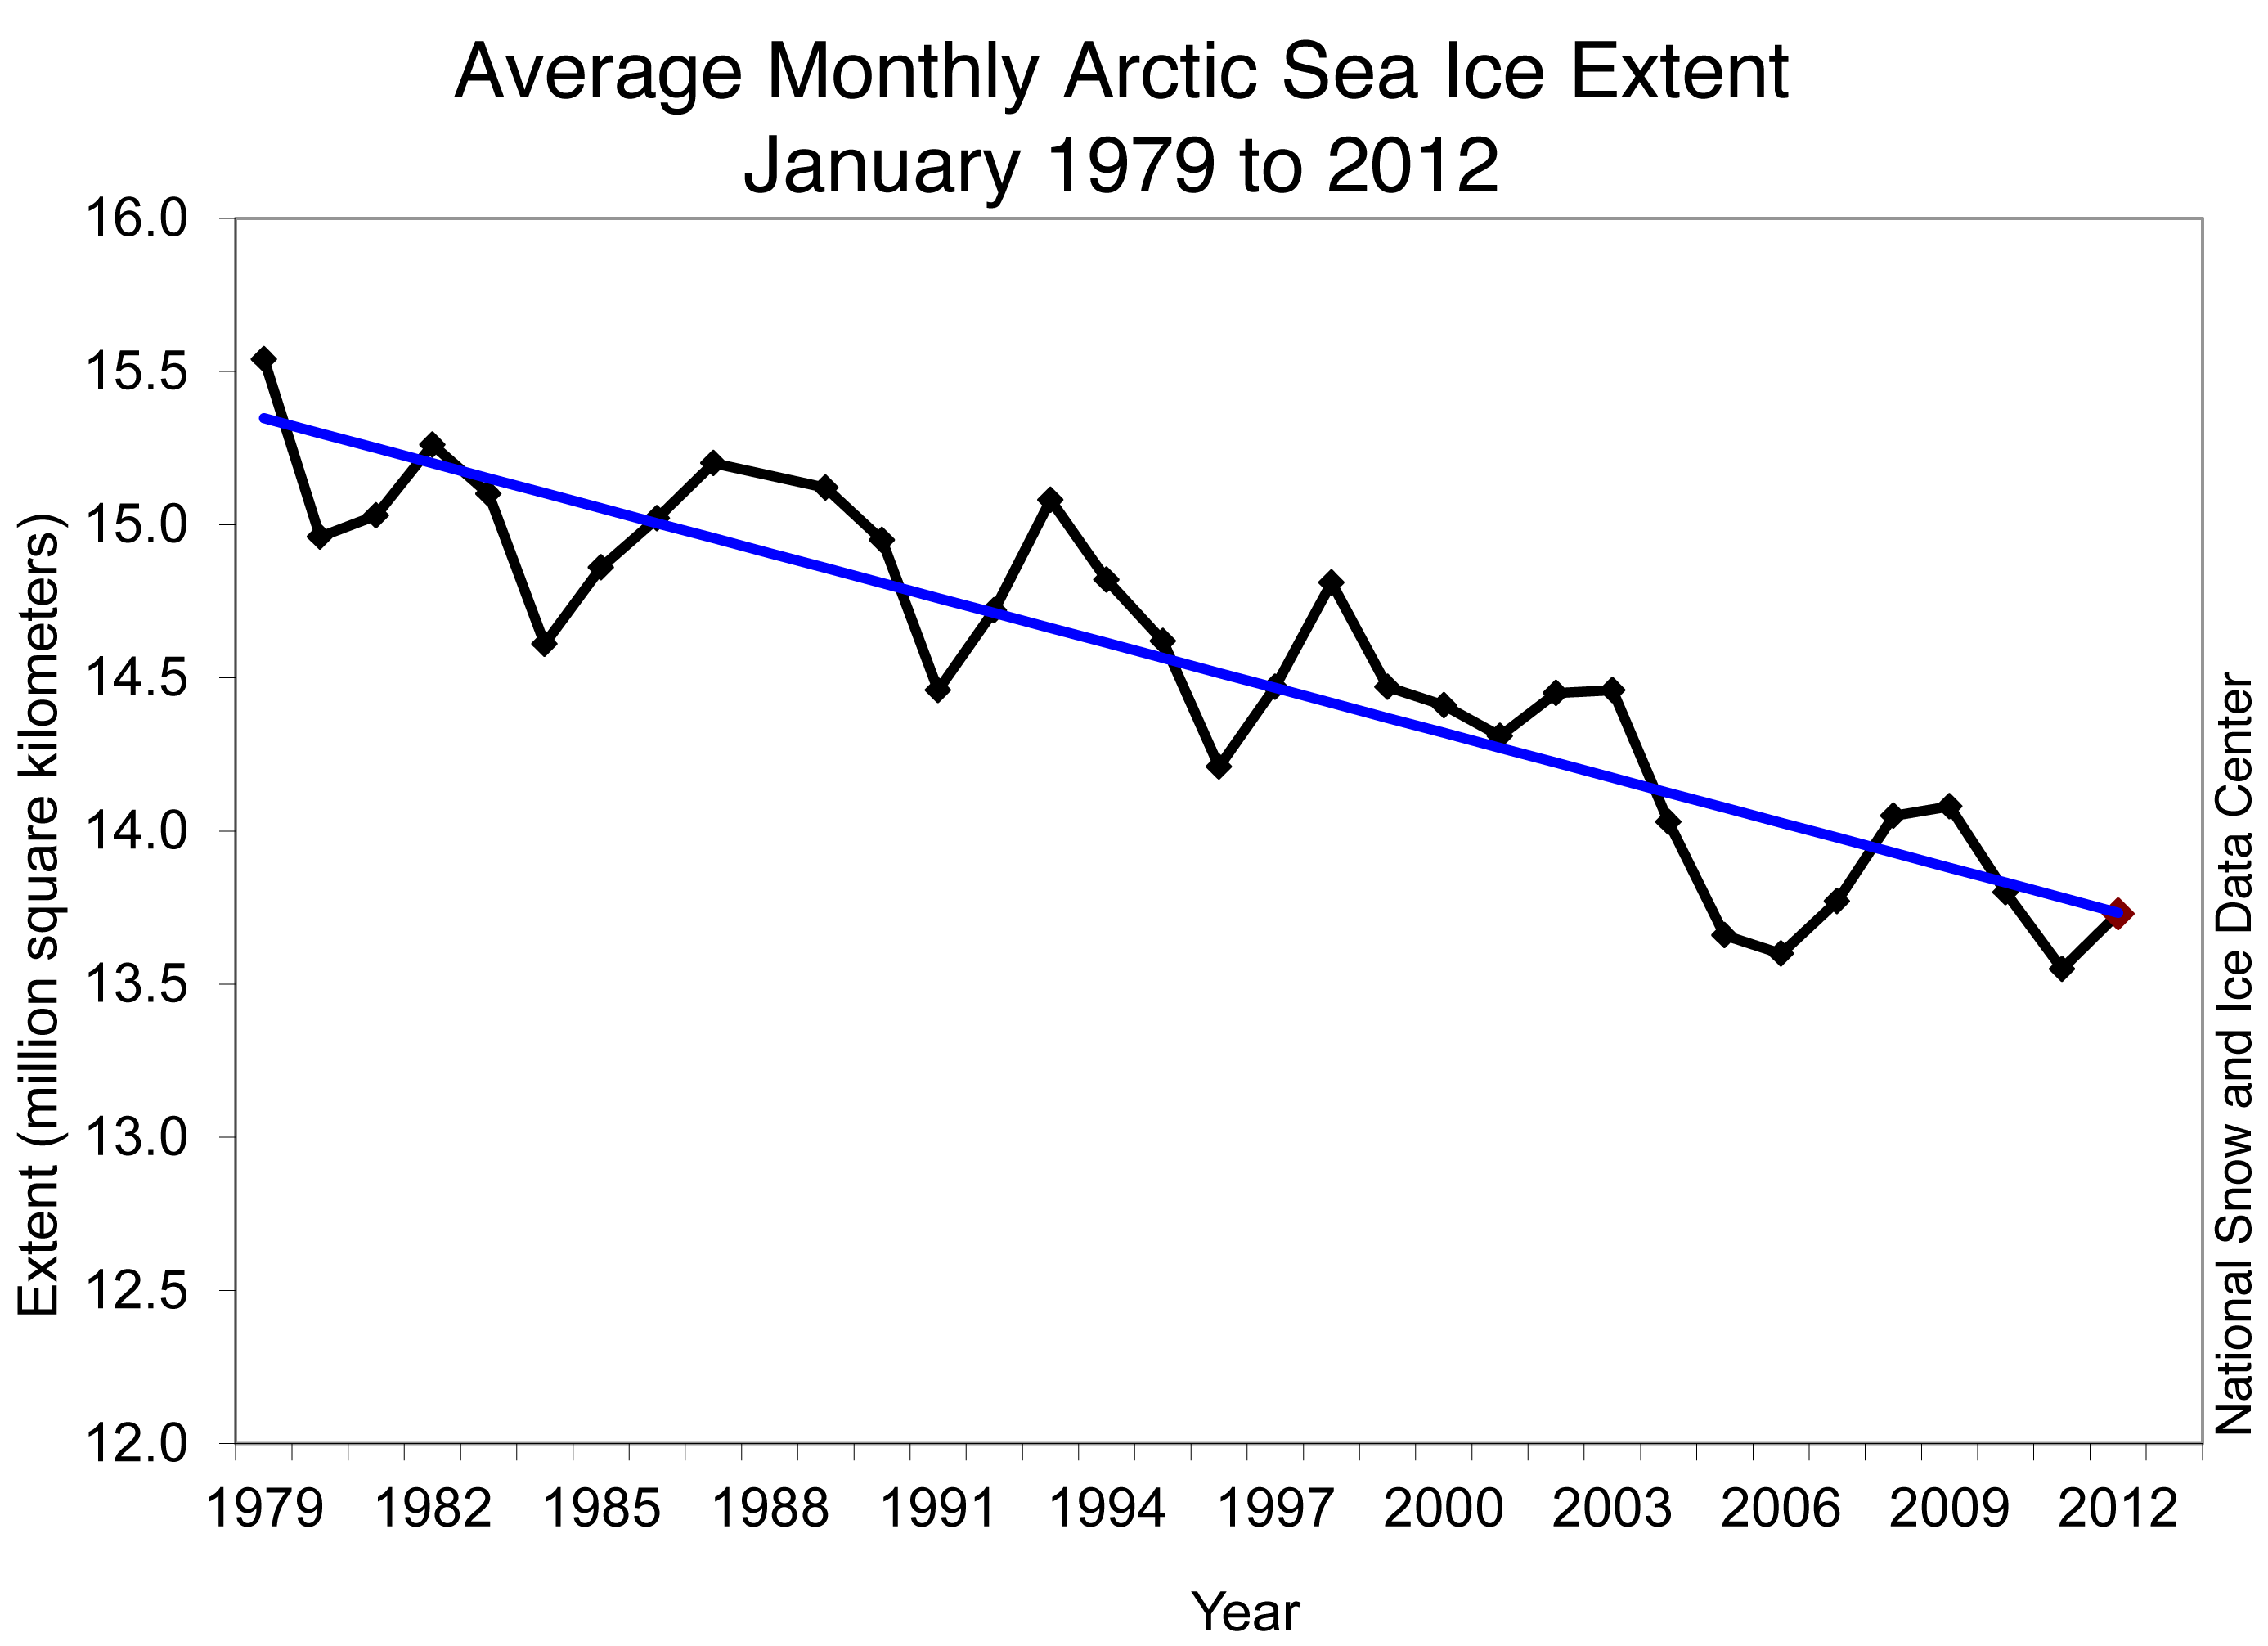
Monthly January ice extent for 1979 to 2012 shows a decline of 3.2% per decade. Credit: National Snow and Ice Data Center. High Resolution Image
January 2012 compared to past years
Arctic sea ice extent for January 2012 was the fourth lowest in the satellite record. Including the year 2012, the linear rate of decline for January ice extent over the satellite record is 3.2% per decade.
Based on the satellite record, before 2005 average January ice extent had never been lower than 14 million square kilometers (5.41 million square miles). January ice extent has now fallen below that mark six out of the last seven years.
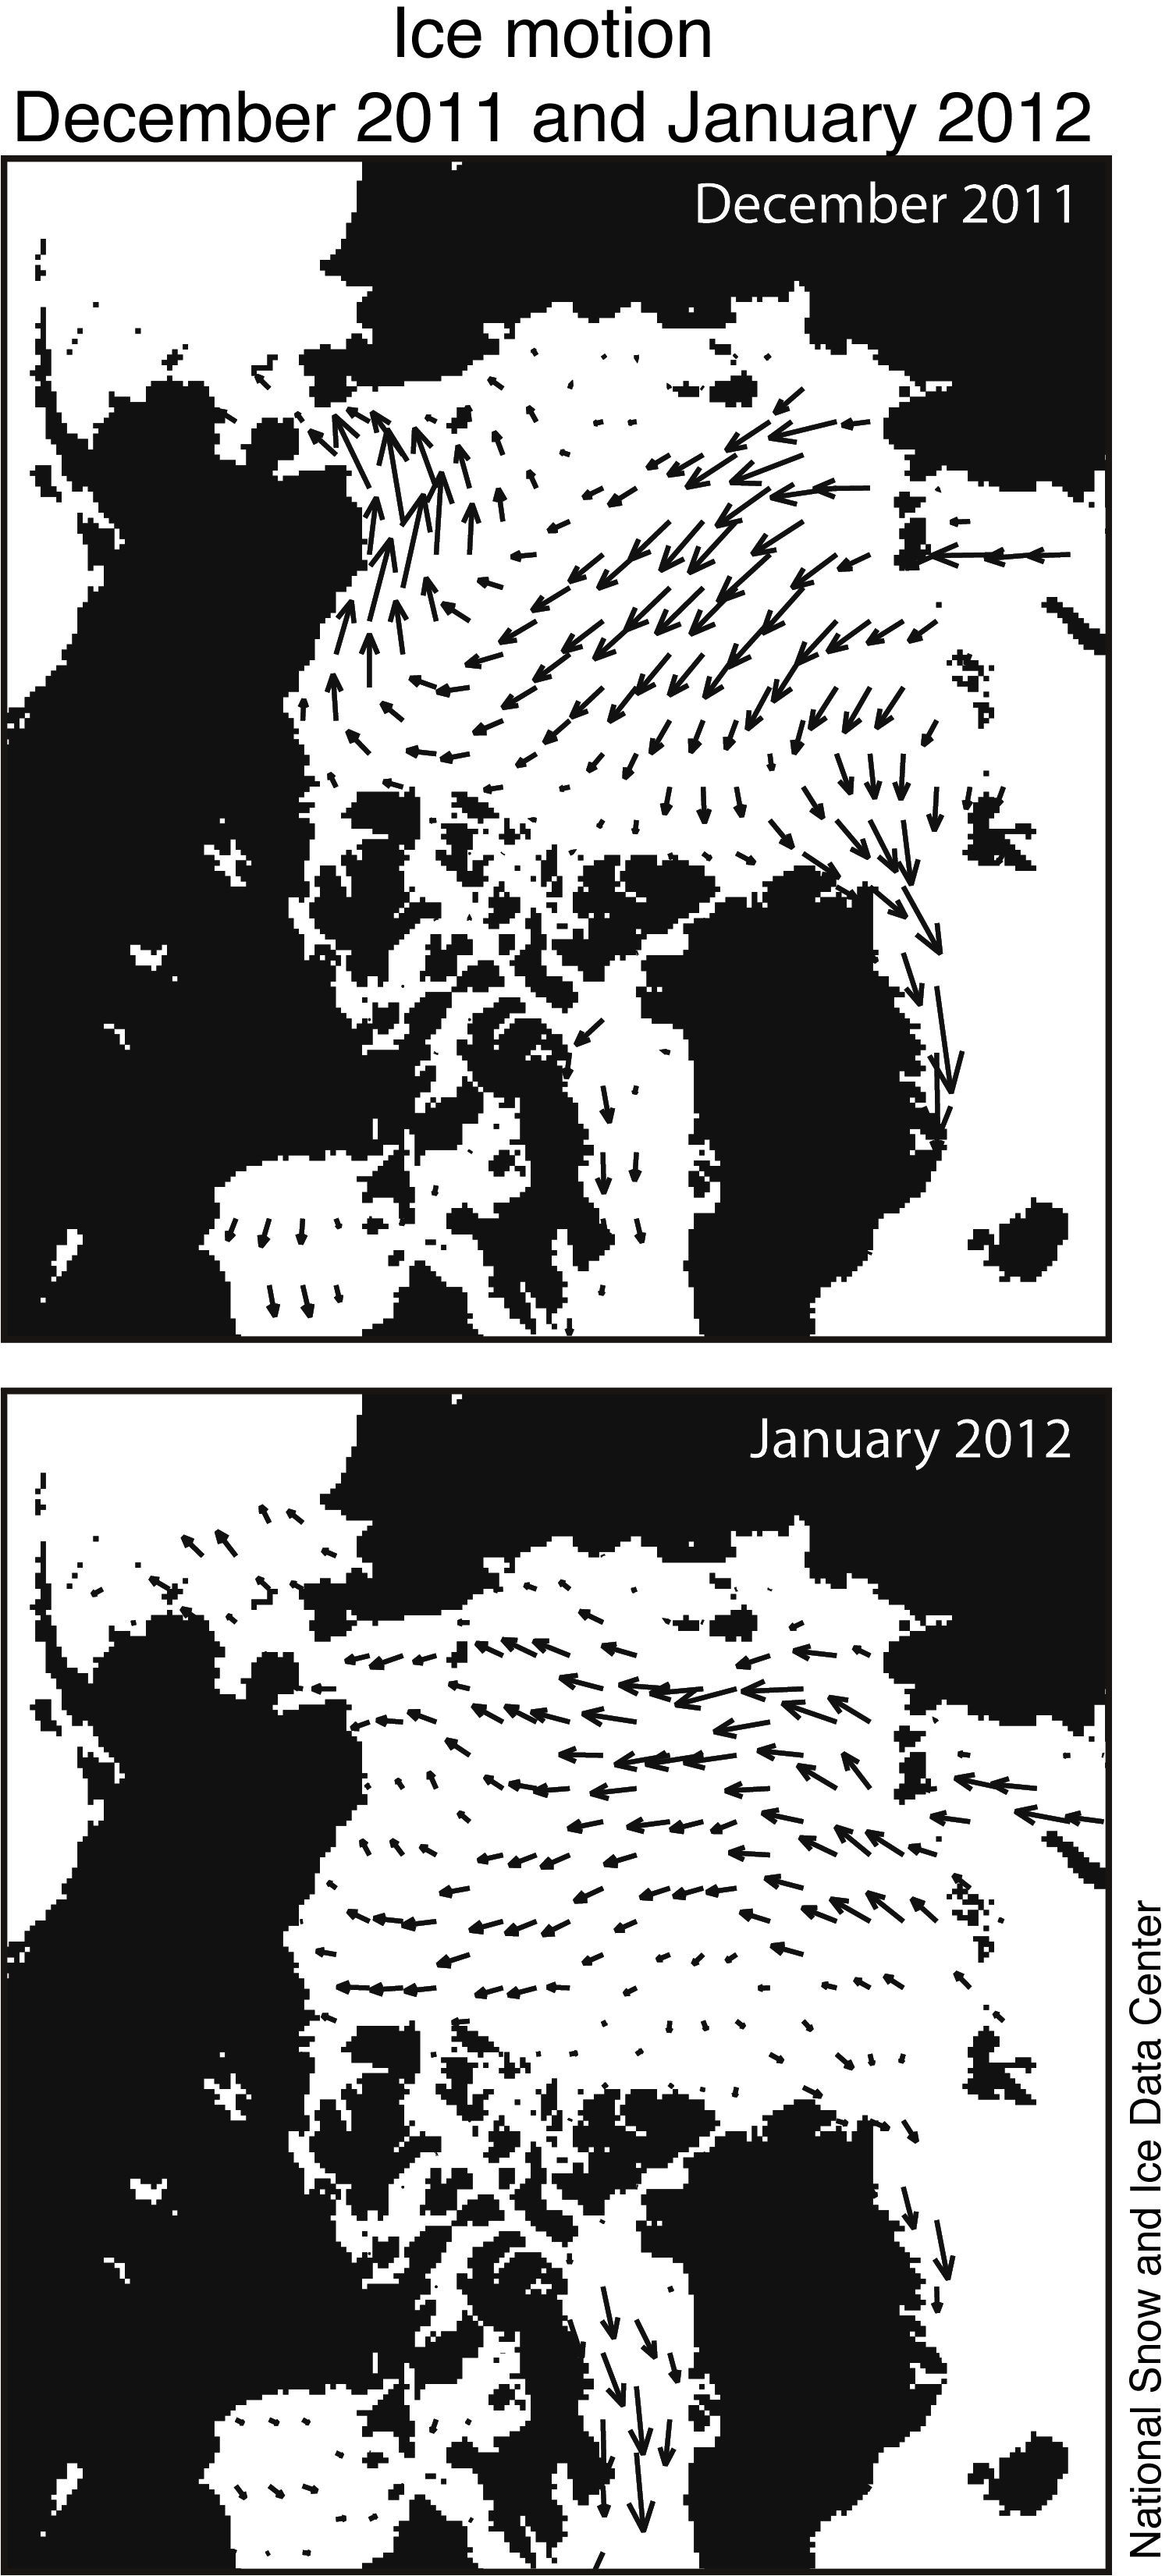
Monthly average sea ice motion for December 2011 (top) and January 2012 (bottom), derived from the DMSP Special Sensor Microwave Imager and Sounder (SSMIS) shows how the changing Arctic Oscillation (AO) phase affects the movement of ice. In January, the AO switched from a positive phase to a negative phase. Credit: National Snow and Ice Data Center. High Resolution Image
The Arctic Oscillation turns negative
From November through the first part of January, the Arctic Oscillation (AO) was in a generally positive phase, which tends to bring warm conditions to the United States and Europe, and colder conditions to the Arctic. However, in the middle of the month, the AO shifted back to a negative phase. This shift helped bring cold air outbreaks over middle latitudes, notably a record cold snap throughout much of Europe.
The Arctic Oscillation also affects how sea ice moves in the Arctic, which can affect how much ice melts in the summer months. In December, when the AO was in its positive phase, ice was flowing from Siberia toward North America, and also south out of the Arctic through Fram Strait. That pattern favors a thinner, younger ice cover in the summer. In mid-January, the AO switched to its negative phase. In general, the negative phase of the AO tends to retain ice in the Arctic Ocean, leading to a stronger, more resilient summer sea ice cover. Ice motion charts for January confirm that in January, there was less motion across the pole and through Fram Strait but a stronger clockwise motion in the Beaufort Sea called the Beaufort Gyre.
For background on the Arctic Oscillation, see the NSIDC Icelights post: The Arctic Oscillation, winter storms and sea ice.
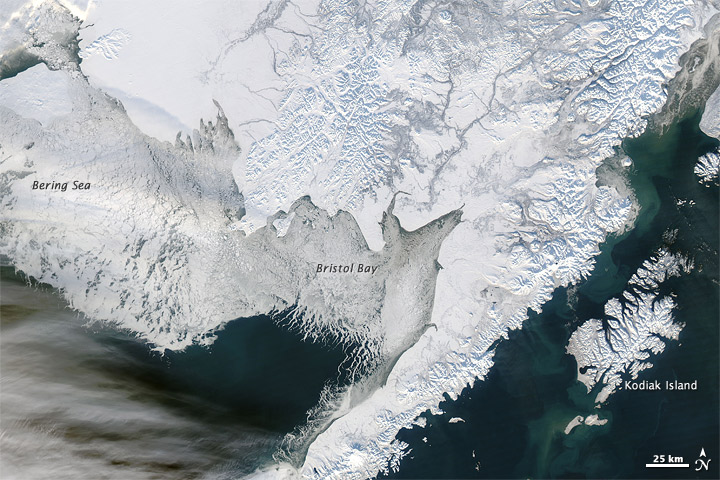
This NASA Moderate Resolution Imaging Spectroradiometer (MODIS) image, acquired in mid-January, shows heavy sea ice conditions in Bristol Bay and the Bering Sea, off the western coast of Alaska. Credit: NASA Earth Observatory courtesy Jeff Schmaltz, LANCE/EOSDIS MODIS Rapid Response Team at NASA GSFC. High Resolution Image
Ice-covered Bering Sea
Arctic sea ice extent in the Bering Sea was the second highest in the satellite record for the month of January. Ice extent in the Bering Sea was 562,000 square kilometers (217,000 square miles), which is 104,600 square kilometers (40,400 square miles) above the 1979 to 2000 average. The record high ice extent for the month occurred in January 2000, at 629,000 square kilometers (242,900 square miles).
Arctic sea ice extent in the Bering Sea was the second highest in the satellite record for the month of January. Ice extent in the Bering Sea was 562,000 square kilometers (217,000 square miles), which is 104,600 square kilometers (40,400 square miles) above the 1979 to 2000 average. The record high ice extent for the month occurred in January 2000, at 629,000 square kilometers (242,900 square miles).
The above-average sea ice extent in the Bering Sea stemmed from a weather pattern that brought cold air from the Arctic into the Bering Sea, driving sea ice southwards. The weather pattern, which has persisted since November, features unusually low surface pressure south and east of the Alaskan coast, which leads to winds from the north or northeast that blow into the Bering Sea region. This weather pattern also brought moist air from the Pacific Ocean to the southern Alaska coast, helping to explain record snowfalls in towns such as Cordova, Alaska, which received over 15 feet of snow between early November and mid-January.
The extensive sea ice impeded winter fishing in the Bering Sea and slowed an important fuel resupply mission to Nome, on the west coast of Alaska. More information on sea ice conditions off southwestern Alaska, and a full-resolution version of the image at left, are available on the NASA Earth Observatory Web site.
http://nsidc.org/arcticseaicenews/
http://nsidc.org/arcticseaicenews/


No comments:
Post a Comment