NSIDC: Melt season gains momentum
June 3, 2009
After a slow start to the melt season, ice extent declined quickly in May. Scientists are monitoring the ice pack for signs of what will come this summer. The thinness of the ice pack makes it likely that the minimum ice extent will again fall below normal, but how far below normal will depend on atmospheric conditions through the summer.
 Figure 1. Arctic sea ice extent for May 2009, was 13.39 million km² (5.17 million sq. miles). The magenta line shows the 1979-2000 median extent for that month. The black cross indicates the geographic North Pole. Sea Ice Index data. About the data. —Credit: National Snow and Ice Data Center
Overview of conditions
Sea ice extent averaged over the month of May 2009 was 13.39 million square kilometers (5.17 million square miles). This was 81,000 square kilometers (31,000 square miles) above the record low for that month, which occurred in May 2004, and 21,000 square kilometers (8,100 square miles) below the 1979 to 2000 average.
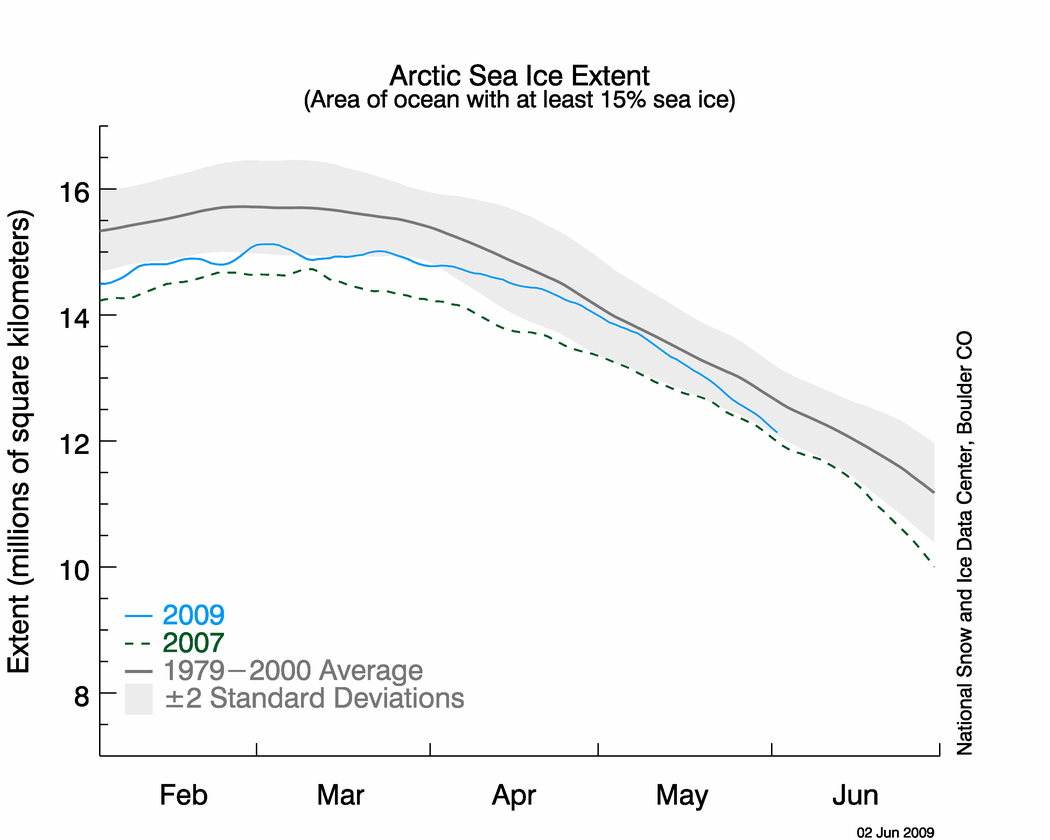 Figure 2. The graph above shows daily sea ice extent as of June 2, 2009. The solid blue line indicates 2009; the dashed green line shows 2007;and the solid gray line indicates average extent from 1979 to 2000. The gray area around 1979-2000 average line shows the two standard deviation range of the data. Sea Ice Index data. Credit: National Snow and Ice Data Center
Conditions in context
Although the 2009 melt season started slowly, the pace of ice loss quickened through May. During May, the Arctic Ocean lost 1.67 million km² (645,000 sq. miles) of ice, an average decline of 54,000 km² (21,000 sq. miles) per day. This is similar to the rate of decline observed last year. For comparison, the long-term average (1979-2000) rate of decline for May is 47,000 km² per day (18,000 sq. miles per day). By the end of May 2009, ice extent was 84,000 km² (32,000 sq. miles) higher than extent at the end of May 2007.
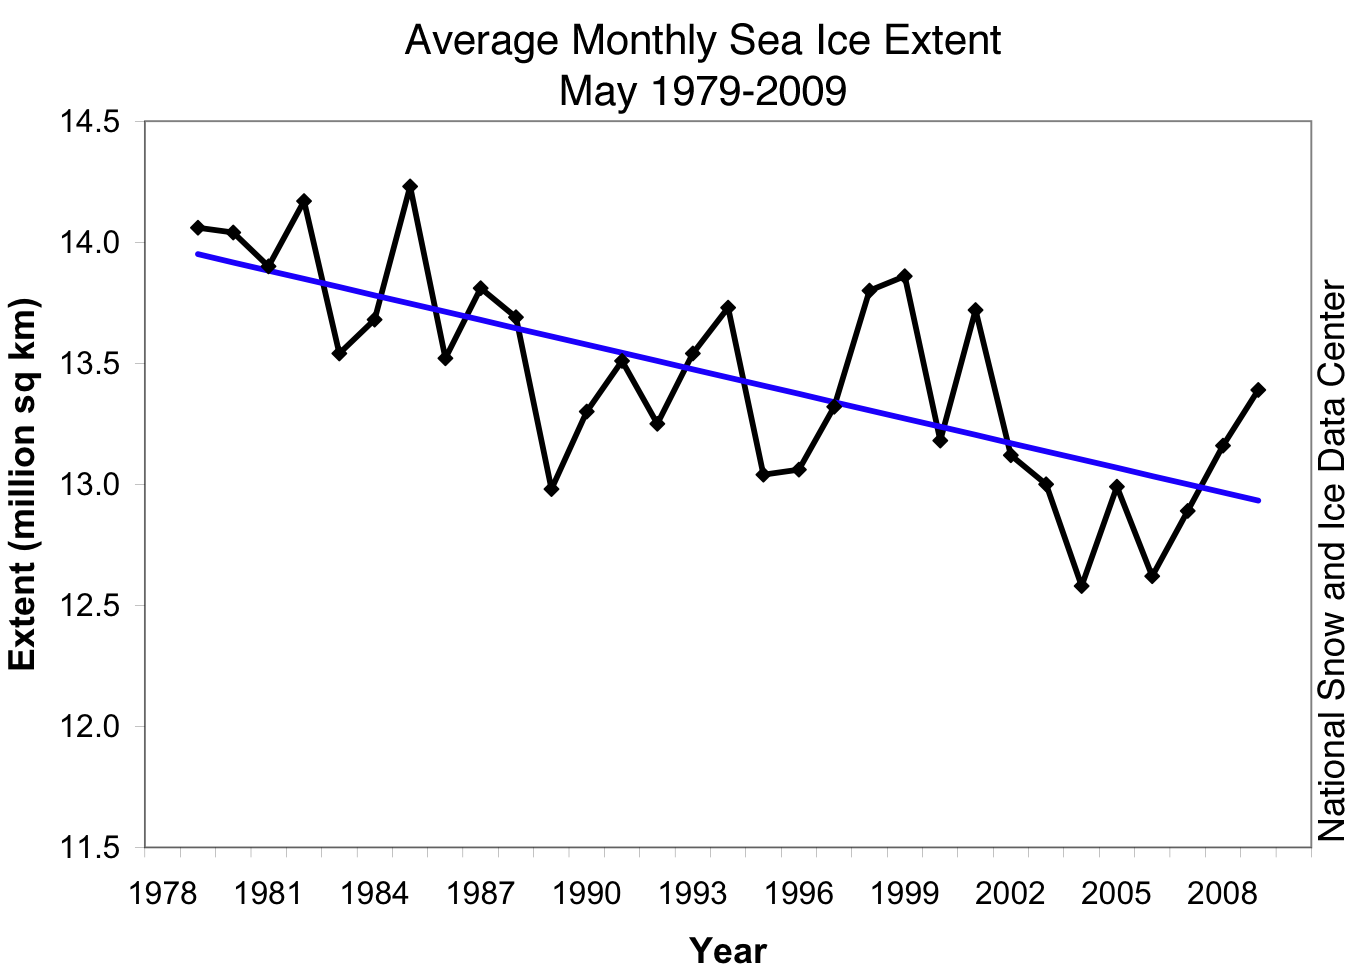 Figure 3. Monthly May ice extent for 1979 to 2009 shows a decline of 2.5% per decade. —Credit: National Snow and Ice Data Center
May 2009 compared to past Mays
Compared to previous Mays, ice extent in May 2009 is about average. Over the last four years, May ice extent has increased. The long-term trend nevertheless indicates a decline of 2.5% per decade, an average of 34,000 km² (13,000 sq. miles) of ice per year.
 Figure 4. The map of air temperature anomalies for May, 2009, at the 925 millibar level (roughly 1,000 meters [3,000 feet] above the surface), shows warmer than usual temperatures between Greenland and Svalbard and in the East Siberian and Laptev seas. Yellow areas correspond to strong positive (warm) anomalies. Areas in blue and purple correspond to negative (cool) anomalies. —Credit: National Snow and Ice Data Center courtesy NOAA/ESRL Physical Sciences Laboratory
 Winds and temperature
The Arctic saw warmer than usual temperatures between Greenland and Svalbard and in the East Siberian and Laptev seas. This is consistent with the atmospheric circulation pattern for May. Two high pressure cells, one centered over the Barents and Laptev seas and the other extending along the northern coast of Alaska into northwestern Canada, produced southerly wind patterns that promote high temperatures. The area around the Canadian Arctic Islands was cooler than normal.
 Figure 5. This satellite image of the Arctic ocean was taken on May 25, 2009, by the MODIS sensor on the NASA Terra Satellite. It shows sea ice beginning to break up in the Barents Sea and north of Novaya Zemlya. Open water areas have also begun to form at the northern end of Baffin Bay (formation of the North Water Polynya) and in the Beaufort Sea off the coast of Alaska and Canada. —Credit: From National Snow and Ice Data Center courtesy NASA/GSFC MODIS Rapid Response
 Looking towards summer
Because the 2009 melt season started out with a thin ice pack, September ice extent will likely be below average yet again. The thinning ice pack, discussed in our April post, has played a major role in the strong decline of September ice extent. Thinner ice requires less energy to melt. It also tends to be fractured, with more areas of open water. Since water absorbs more solar energy than ice, heat from the sun warms up areas of open ocean and promotes even more melt.
September extent in a given year also depends on summertime patterns of atmospheric circulation. The record low ice extent in September 2007 was caused by a combination of a thin spring ice cover and an unusual summer atmospheric circulation pattern. High pressure over the central Arctic Ocean and low pressure over Siberia blew warm air over the Arctic Ocean and compressed the ice pack into a smaller area. Whether or not Arctic sea ice reaches a new record low this summer will depend on the circulation patterns that set up over the next few months.
Sea Ice Outlook report
Sea ice scientists around the world are actively monitoring the state of Arctic sea ice cover. The Study of Environmental Arctic Change will issue their first Sea Ice Outlook report later this month.
Link to this page: http://nsidc.org/arcticseaicenews/index.html


No comments:
Post a Comment