by Stefan Rahmstorf, RealClimate, November 13, 2013
A new study by British and Canadian researchers shows that the global temperature rise of the past 15 years has been greatly underestimated. The reason is the data gaps in the weather station network, especially in the Arctic. If you fill these data gaps using satellite measurements, the warming trend is more than doubled in the widely used HadCRUT4 data, and the much-discussed “warming pause” has virtually disappeared.
Obtaining the globally averaged temperature from weather station data has a well-known problem: there are some gaps in the data, especially in the polar regions and in parts of Africa. As long as the regions not covered warm up like the rest of the world, that does not change the global temperature curve.
But errors in global temperature trends arise if these areas evolve differently from the global mean. That’s been the case over the last 15 years in the Arctic, which has warmed exceptionally fast, as shown by satellite and reanalysis data and by the massive sea ice loss there. This problem was analysed for the first time by Rasmus in 2008 at RealClimate, and it was later confirmed by other authors in the scientific literature.
The “Arctic hole” is the main reason for the difference between the NASA GISS data and the other two data sets of near-surface temperature, HadCRUT and NOAA. I have always preferred the GISS data because NASA fills the data gaps by interpolation from the edges, which is certainly better than not filling them at all.
A new gap filler
Now Kevin Cowtan (University of York) and Robert Way (University of Ottawa) have developed a new method to fill the data gaps using satellite data.
It sounds obvious and simple, but it’s not. Firstly, the satellites cannot measure the near-surface temperatures but only those overhead at a certain altitude range in the troposphere. And secondly, there are a few question marks about the long-term stability of these measurements (temporal drift).
Cowtan and Way circumvent both problems by using an established geostatistical interpolation method called kriging (or Krigen) – but they do not apply it to the temperature data itself (which would be similar to what GISS does), but to the difference between satellite and ground data. So they produce a hybrid temperature field. This consists of the surface data where they exist. But in the data gaps, it consists of satellite data that have been converted to near-surface temperatures, where the difference between the two is determined by a Kriging interpolation from the edges. As this is redone for each new month, a possible drift of the satellite data is no longer an issue.
Prerequisite for success is, of course, that this difference is sufficiently smooth, i.e. has no strong small-scale structure. This can be tested on artificially generated data gaps, in places where one knows the actual surface temperature values but holds them back in the calculation. Cowtan and Way perform extensive validation tests, which demonstrate that their hybrid method provides significantly better results than a normal interpolation on the surface data as done by GISS.
The surprising result
Cowtan and Way apply their method to the HadCRUT4 data, which are state-of-the-art except for their treatment of data gaps. For 1997-2012 these data show a relatively small warming trend of only 0.05 °C per decade – which has often been misleadingly called a “warming pause.” The new IPCC report writes:
Due to natural variability, trends based on short records are very sensitive to the beginning and end dates and do not in general reflect long-term climate trends. As one example, the rate of warming over the past 15 years (1998–2012; 0.05 [–0.05 to +0.15] °C per decade), which begins with a strong El Niño, is smaller than the rate calculated since 1951 (1951–2012; 0.12 [0.08 to 0.14] °C per decade).
But after filling the data gaps this trend is 0.12 °C per decade and thus exactly equal to the long-term trend mentioned by the IPCC.
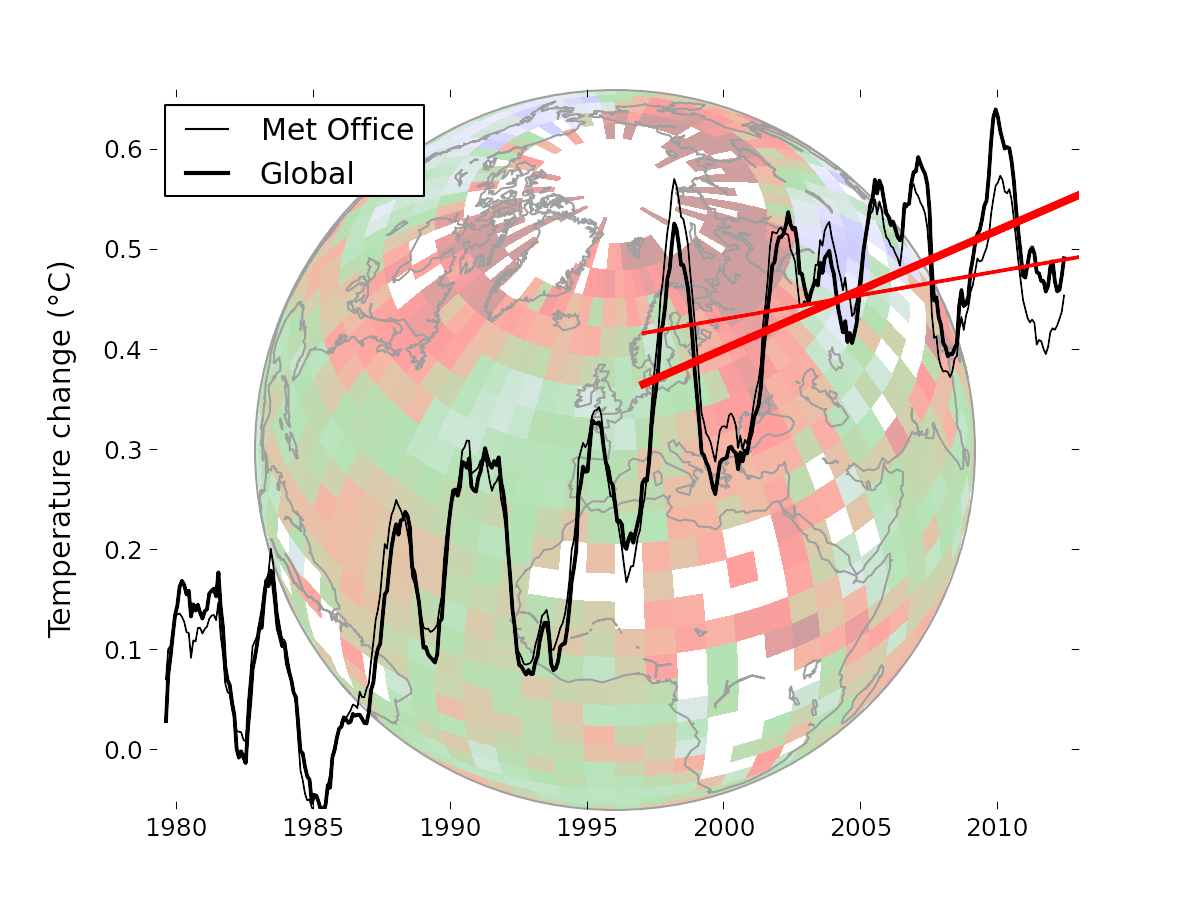
The corrected data (bold lines) are shown in the graph compared to the uncorrected ones (thin lines). The temperatures of the last three years have become a little warmer, the year 1998 a little cooler.
The trend of 0.12 °C is at first surprising, because one would have perhaps expected that the trend after gap filling has a value close to the GISS data, i.e., 0.08 °C per decade. Cowtan and Way also investigated that difference. It is due to the fact that NASA has not yet implemented an improvement of sea surface temperature data which was introduced last year in the HadCRUT data (that was the transition from the HadSST2 the HadSST3 data – the details can be found, e.g., here and here). The authors explain this in more detail in their extensive background material. Applying the correction of ocean temperatures to the NASA data, their trend becomes 0.10 °C per decade, very close to the new optimal reconstruction.
Conclusion
The authors write in their introduction:
While short term trends are generally treated with a suitable level of caution by specialists in the field, they feature significantly in the public discourse on climate change.
This is all too true. A media analysis has shown that at least in the U.S., about half of all reports about the new IPCC report mention the issue of a “warming pause,” even though it plays a very minor role in the conclusions of the IPCC. Often the tenor was that the alleged “pause” raises some doubts about global warming and the warnings of the IPCC. We knew about the study of Cowtan and Way for a long time, and in the face of such media reporting it is sometimes not easy for researchers to keep such information to themselves. But I respect the attitude of the authors to only go public with their results once they’ve been published in the scientific literature. This is a good principle that I have followed with my own work as well.
The public debate about the alleged “warming pause” was misguided from the outset, because far too much was read into a cherry-picked, short-term trend. Now this debate has become completely baseless, because the trend of the last 15 or 16 years is nothing unusual – even despite the record El Niño year at the beginning of the period. It is still a quarter less than the warming trend since 1980, which is 0.16 °C per decade. But that’s not surprising when one starts with an extreme El Niño and ends with persistent La Niña conditions and is also running through a particularly deep and prolonged solar minimum in the second half. As we often said, all this is within the usual variability around the long-term global-warming trend and no cause for excited over-interpretation.


No comments:
Post a Comment