Blog Archive

Friday, August 31, 2012

Fen Montaigne: Arctic Tipping Point: A North Pole Without Ice


Arctic Tipping Point:
A North Pole Without Ice

Scientists say this year’s record declines in Arctic sea ice extent and volume are powerful evidence that the giant cap of ice at the top of the planet is on a trajectory to largely disappear in summer within a decade or two, with profound global consequences.


by fen montaigne, yale360, August 30, 2012


As the northern summer draws to a close, two milestones have been reached in the Arctic Ocean — record-low sea ice extent, and an even more dramatic new low in Arctic sea ice volume. This extreme melting offers dramatic evidence, many scientists say, that the region’s sea ice has passed a tipping point and that sometime in the next decade or two the North Pole will be largely ice-free in summer.

NASA and U.S. ice experts announced earlier this week that the extent of Arctic sea ice has dropped to 4.1 million square kilometers (1.58 million square miles) — breaking the previous record set in 2007 — and will likely continue to fall even farther until mid-September. As the summer melt season ends, the Arctic Ocean will be covered with 45 percent less ice than the average from 1979 to 2000.

NASA
On August 26, 2012, Arctic sea ice reached a new record-low summer extent.
Even more striking is the precipitous decline in the volume of ice in the Arctic Ocean. An analysis conducted by the University of Washington’s Pan Arctic Ice Ocean Model Assimilation System (PIOMAS) estimates that sea ice volumes fell in late August to roughly 3,500 cubic kilometers — a 72-percent drop from the 1979-2010 mean.

Peter Wadhams, who heads the Polar Ocean Physics Group at the University of Cambridge and who has been measuring Arctic Ocean ice thickness from British Navy submarines, says that earlier calculations about Arctic sea ice loss have grossly underestimated how rapidly the ice is disappearing. He believes that the Arctic is likely to become ice-free before 2020 and possibly as early as 2015 or 2016 — decades ahead of projections made just a few years ago.

Mark Drinkwater, mission scientist for the European Space Agency’s CryoSat satellite and the agency’s senior advisor on polar regions, said he and his colleagues have been taken aback by the swiftness of Arctic sea ice retreat in the last 5 years. “If this rate of melting [in 2012] is sustained in 2013, we are staring down the barrel and looking at a summer Arctic which is potentially free of sea ice within this decade,” Drinkwater said in an e-mail interview.

A small number of climate scientists say that natural variability may be playing a significant role in the rapid retreat of Arctic sea ice, intensifying human-caused climate change, and they caution against predicting the imminent demise of the region’s summer sea ice. But an 
Extraordinarily low ice levels indicate the summer sea ice has passed a point of no return.
overwhelming majority of Arctic ice experts say that recent data offer powerful evidence that summer sea ice has passed a point of no return.

The dramatic ice loss is being driven by a several key factors, scientists say. Chief among them is that decades of warming have so extensively melted and thinned Arctic sea ice that rapidly expanding areas of dark, open water are absorbing ever-greater amounts of the sun’s radiation, further warming the region in a vicious cycle.

Second, swiftly warming air and ocean temperatures in the Arctic have, for now at least, altered atmospheric activity, with two consequences: Warmer air is being pulled into the Arctic, and increased storms and cyclones in summer are not only driving ice out of the Arctic basin, but also breaking up the ice pack and further exposing more dark water.

And finally there is the inescapable reality that steadily rising levels of carbon dioxide being pumped into the atmosphere by human activity are continuing to warm the Arctic and the rest of the globe, further hastening the loss of Arctic Ocean ice. Several experts say that the only thing that could slow this disappearance — and then only for a few years — would be a major volcanic eruption that reduces the amount of the sun’s energy striking the earth.

“It’s sobering to see the Arctic change so rapidly,” said Ted Scambos, senior research scientist at the National Snow & Ice Data Center in Colorado. “Simply staring at the satellite data that we’re seeing every day is awesome, but in a sad sort of way. It doesn’t look like the Arctic anymore. The summer ice used to look like a cap that nearly filled the Arctic basin. It now looks like a raft with room on every side. You can imagine what it’s going to 
‘The summer ice used to look like a cap…. It now looks like a raft with room on every side.’
look like when the North Pole is open water, when there is only a tiny amount of ice left in August and September. The planet will look a lot different.”

The loss of the great white dome of ice at the top of the world in summer will have profound effects, scientists say. These include a reduction of the amount of solar radiation reflected back into space by the ice, significant changes to the jet stream and Northern Hemispheric weather patterns, and even-more rapid warming in the far north, speeding the melting of Greenland’s massive ice sheets and increasing global sea levels.

In addition to these impacts, said Drinkwater, “Increased storminess will generate ocean wave systems which, un-damped by the presence of sea ice, will pound the circumpolar north coastlines. Current rates of coastal permafrost degradation will be accelerated, leading to significant coastal erosion and reconfiguration of the high-latitude shoreline. Meanwhile, we have also recently heard about the potential for release of sub-sea methane deposits and thereby an acceleration of the current greenhouse effect.”

The record low sea ice extent in 2007 of 4.2 million square kilometers was due to some unusual circumstances, including a sunny summer in the Arctic and higher temperatures. Summer sea ice extent rebounded somewhat in the next several years, rising to 5.3 million square kilometers in 2009, giving some hope to mainstream scientists that Arctic sea ice was not in a “death spiral.”

But Scambos and other experts say that recent data on plummeting ice extent and volume show that the Arctic has entered a “new normal” in which ice decline seems irreversible. Because of thinning ice and swiftly expanding areas of open water, the Arctic Ocean will no longer be kept frigid in summer by the reflectivity of snow and ice — the so-called ice-albedo effect, in which ice and snow reflect a high percentage of the sun’s energy back into space.

Arctic Sea Ice NASA
NASA
Melting Arctic sea ice.
Thick sea ice that formed over many years is increasingly rare in the Arctic. In the 1960s, submarines routinely encountered 12-foot-thick ice around the North Pole and 20-foot-thick ice in some other areas; now those regions often contain ice that is only three to four feet thick. Many parts of the Arctic Ocean are now covered with thin, year-old ice that melts quickly in spring and summer.

This spring, noted Scambos, extensive late winter snow cover on land melted unusually rapidly, reaching record low levels by June. Sea ice across much of the Arctic began to melt 10 to 14 days earlier than in the preceding few decades. Relatively clear skies from late May through June further hastened the melting of sea ice, but even as cloudier weather prevailed in July and August, the record sea ice retreat continued.

“The sensitivity of the Arctic to a warm summer is much higher now than it was in the 1990s or early 2000s,” said Scambos. “What we’re seeing last year and this year is that 2007 wasn’t a fluke. As we’ve gone forward a few years, we’re seeing that many different patterns of weather lead to significant sea ice loss in the Arctic.”

Scambos does not foresee summer sea ice in the Arctic largely disappearing this decade, estimating that such an event could occur around 2030, “plus or minus a decade.” He said the “endgame” of Arctic summer sea ice will probably mean that around 1 million square kilometers — about 15% of what existed in the mid-20th century — will remain in the Canadian High Arctic and some other regions, leaving the North Pole generally ice-free in August and September.

Drinkwater said that changing weather patterns, related to more heat and moisture being released into the Arctic atmosphere, have played a significant role in accelerating sea ice loss. Sea ice retreat in the past decade has been accompanied by a trend toward lower atmospheric pressure and more storms and cyclonic activity, which in turn breaks up
Changing weather patterns have played a significant role in accelerating sea ice loss.
the pack ice and exposes more open water. A powerful Arctic storm earlier this month did just that, Drinkwater noted.

He said that Arctic sea ice could conceivably rebound for some period of time if atmospheric circulation changes and a pattern known as the Arctic Oscillation — currently in a positive phase — moves into a negative phase and ushers in a period of prolonged high atmospheric pressure and fewer storms. This, said Drinkwater, would enable sea ice to remain trapped in the Arctic basin and thicken.

“However,” added Drinkwater, “this seems like blind hope in a system whose feedbacks all appear geared to getting rid of sea ice.”

Judith Curry [snip].

MORE FROM YALE e360
Linking Weird Weather to
Rapid Warming of the Arctic
The loss of Arctic summer sea ice and the rapid warming of the Far North are altering the jet stream over North America, Europe, and Russia. As Jennifer Francis writes, scientists are now just beginning to understand how these profound shifts may be increasing the likelihood of more persistent and extreme weather.
READ MORE
Jay Zwally, chief cryospheric scientist at NASA’s Goddard Space Flight Center and an observer of Arctic ice for 40 years, places little stock in the likelihood of a reversal of disappearing Arctic ice. New satellite technology has given scientists the ability to measure the height of sea ice above the water, and hence ice volume. Those measurements, he said, have vividly underscored that Arctic sea ice is in a swoon.

For example, a recent analysis of data from CryoSat and NASA’s ICESat satellite estimates that the volume of sea ice in a large area of the central Arctic Ocean has plummeted in late winter — February and March — by nearly half in just eight years, from an estimated 13,000 cubic kilometers in 2004 to 7,000 cubic kilometers in 2012.

“We’ve gone through a tipping point, and of all the things a tipping point applies to, sea ice is the most appropriate, because the idea is when it goes below a certain thickness it doesn’t go back under present conditions,” said Zwally. “People can get hung up on the specifics and lose track of the big picture, which is that it’s getting worse and it’s going to get [even] worse.”

http://e360.yale.edu/feature/tipping_point_arctic_heads_to_ice_free_summers/2567/

Jeff Masters: Some unanswered questions about Hurricane Isaac

by Dr. Jeff Masters, Ph.D., WunderBlog, August 31, 2012

The top winds of Tropical Depression Isaac have fallen to 25 mph, but the storm continues to be a potent rain-maker as it heads north-northwest at 11 mph into Missouri. Isaac has spawned up to 20 suspected tornadoes, brought storm surges as high as 13.6' to the coast (in Lake Borgne, LA), and dumped 20" of rain at one station in New Orleans. The 13.27" of rain that fell at Hattiesburg, MS, broke the record for wettest August in the city's history (previous record: 13.03" in 1987). Major flooding is occurring on seven rivers in Louisiana and Mississippi. Isaac is being blamed for at least four deaths in the U.S., 24 in Haiti, and five in the Dominican Republic.

A few notable rainfall totals from Isaac, through 11 a.m. EDT on Friday:

20.08" New Orleans, LA
15.02" Marion, MS
13.99" Pascagoula, MS
13.27" Hattiesburg, MS
10.85" Gulfport, MS
10.39" Slidell, LA
10.17" Biloxi, MS
9.85" Mobile, AL
7.38" Pine Bluff, AR
5.95" Baton Rouge, LA

A major reason for Isaac's heavy rainfall totals has been its very slow motion. This slow speed was due to the fact Isaac has been bumping into a ridge of high pressure that is unusually strong, due to the intense drought over the center of the U.S.; strong drought-amplified high pressure areas are very resistant to allowing any low pressure areas to intrude into their domain. The high pressure area was strong enough this week to allow several all-time records for heat this late in the year to be set:

112° on August 29 at Winner, SD
108° on August 29 at Valentine, NE
107° on August 29 at Corpus Christi, TX
97° on August 29 at Denver, CO (2nd highest so late in the year)


Figure 1. Nighttime view of Hurricane Isaac taken at 1:57 a.m. CDT August 29, 2012, by the Visible Infrared Imaging Radiometer Suite (VIIRS) on the Suomi-NPP satellite. The VIIRS day-night band detects light in a range of wavelengths from green to near-infrared, and uses light intensification to enable the detection of dim signals. In this case, the clouds of Isaac were lit by moonlight. Image credit: NASA.

Isaac's beneficial rains falling in drought-stricken regions
Hurricanes get a lot of attention because of the billions in damage they cost, and the lives they disrupt. AIR Worldwide estimated today that insured damage from Isaac would cost up to $2 billion. This does not include damage to infrastructure or uninsured damage, so the final price tag of Isaac's rampage will be more like $3-5 billion. However, Isaac is now dumping beneficial rains over Arkansas, Missouri, Illinois, Indiana, Ohio, and Kentucky -- regions stricken by the worst drought since the 1950s or 1930s, depending upon the exact location. These regions need 9-18 inches of rain to pull them out of drought. Isaac's 3-6 inches of rain will not end the drought, but will put a pretty good dent in it. I expect that 3-6 inches of rain for a wide swath of prime agricultural land in extreme drought is probably worth at least $5 billion, when you consider that a recent estimate by a Purdue economist put the cost of the great drought of 2012 at more than $77 billion. Only Hurricane Katrina ($146 billion) and the drought of 1988 ($78 billion) have been more expensive disasters, according to NOAA's National Climatic Data Center. Unfortunately, Isaac's arrival is poorly timed, as the storm is arriving during harvest season. The strong winds associated with the storm will flatten many crops, making it more difficult to harvest them, and Isaac's winds may cost farmers several hundred million dollars due to unharvestable crops. Still, the rains from Isaac will be highly beneficial for the success of the upcoming winter wheat season, and for next year's growing season.


Figure 2. Predicted precipitation for the five-day period ending on Tuesday evening shows that Isaac is expected to bring a large region of 3-6 inches of rain (red, orange, and brown colors) to Arkansas, Missouri, Illinois, Indiana, Ohio, and Kentucky. Image credit: NOAA/HPC.


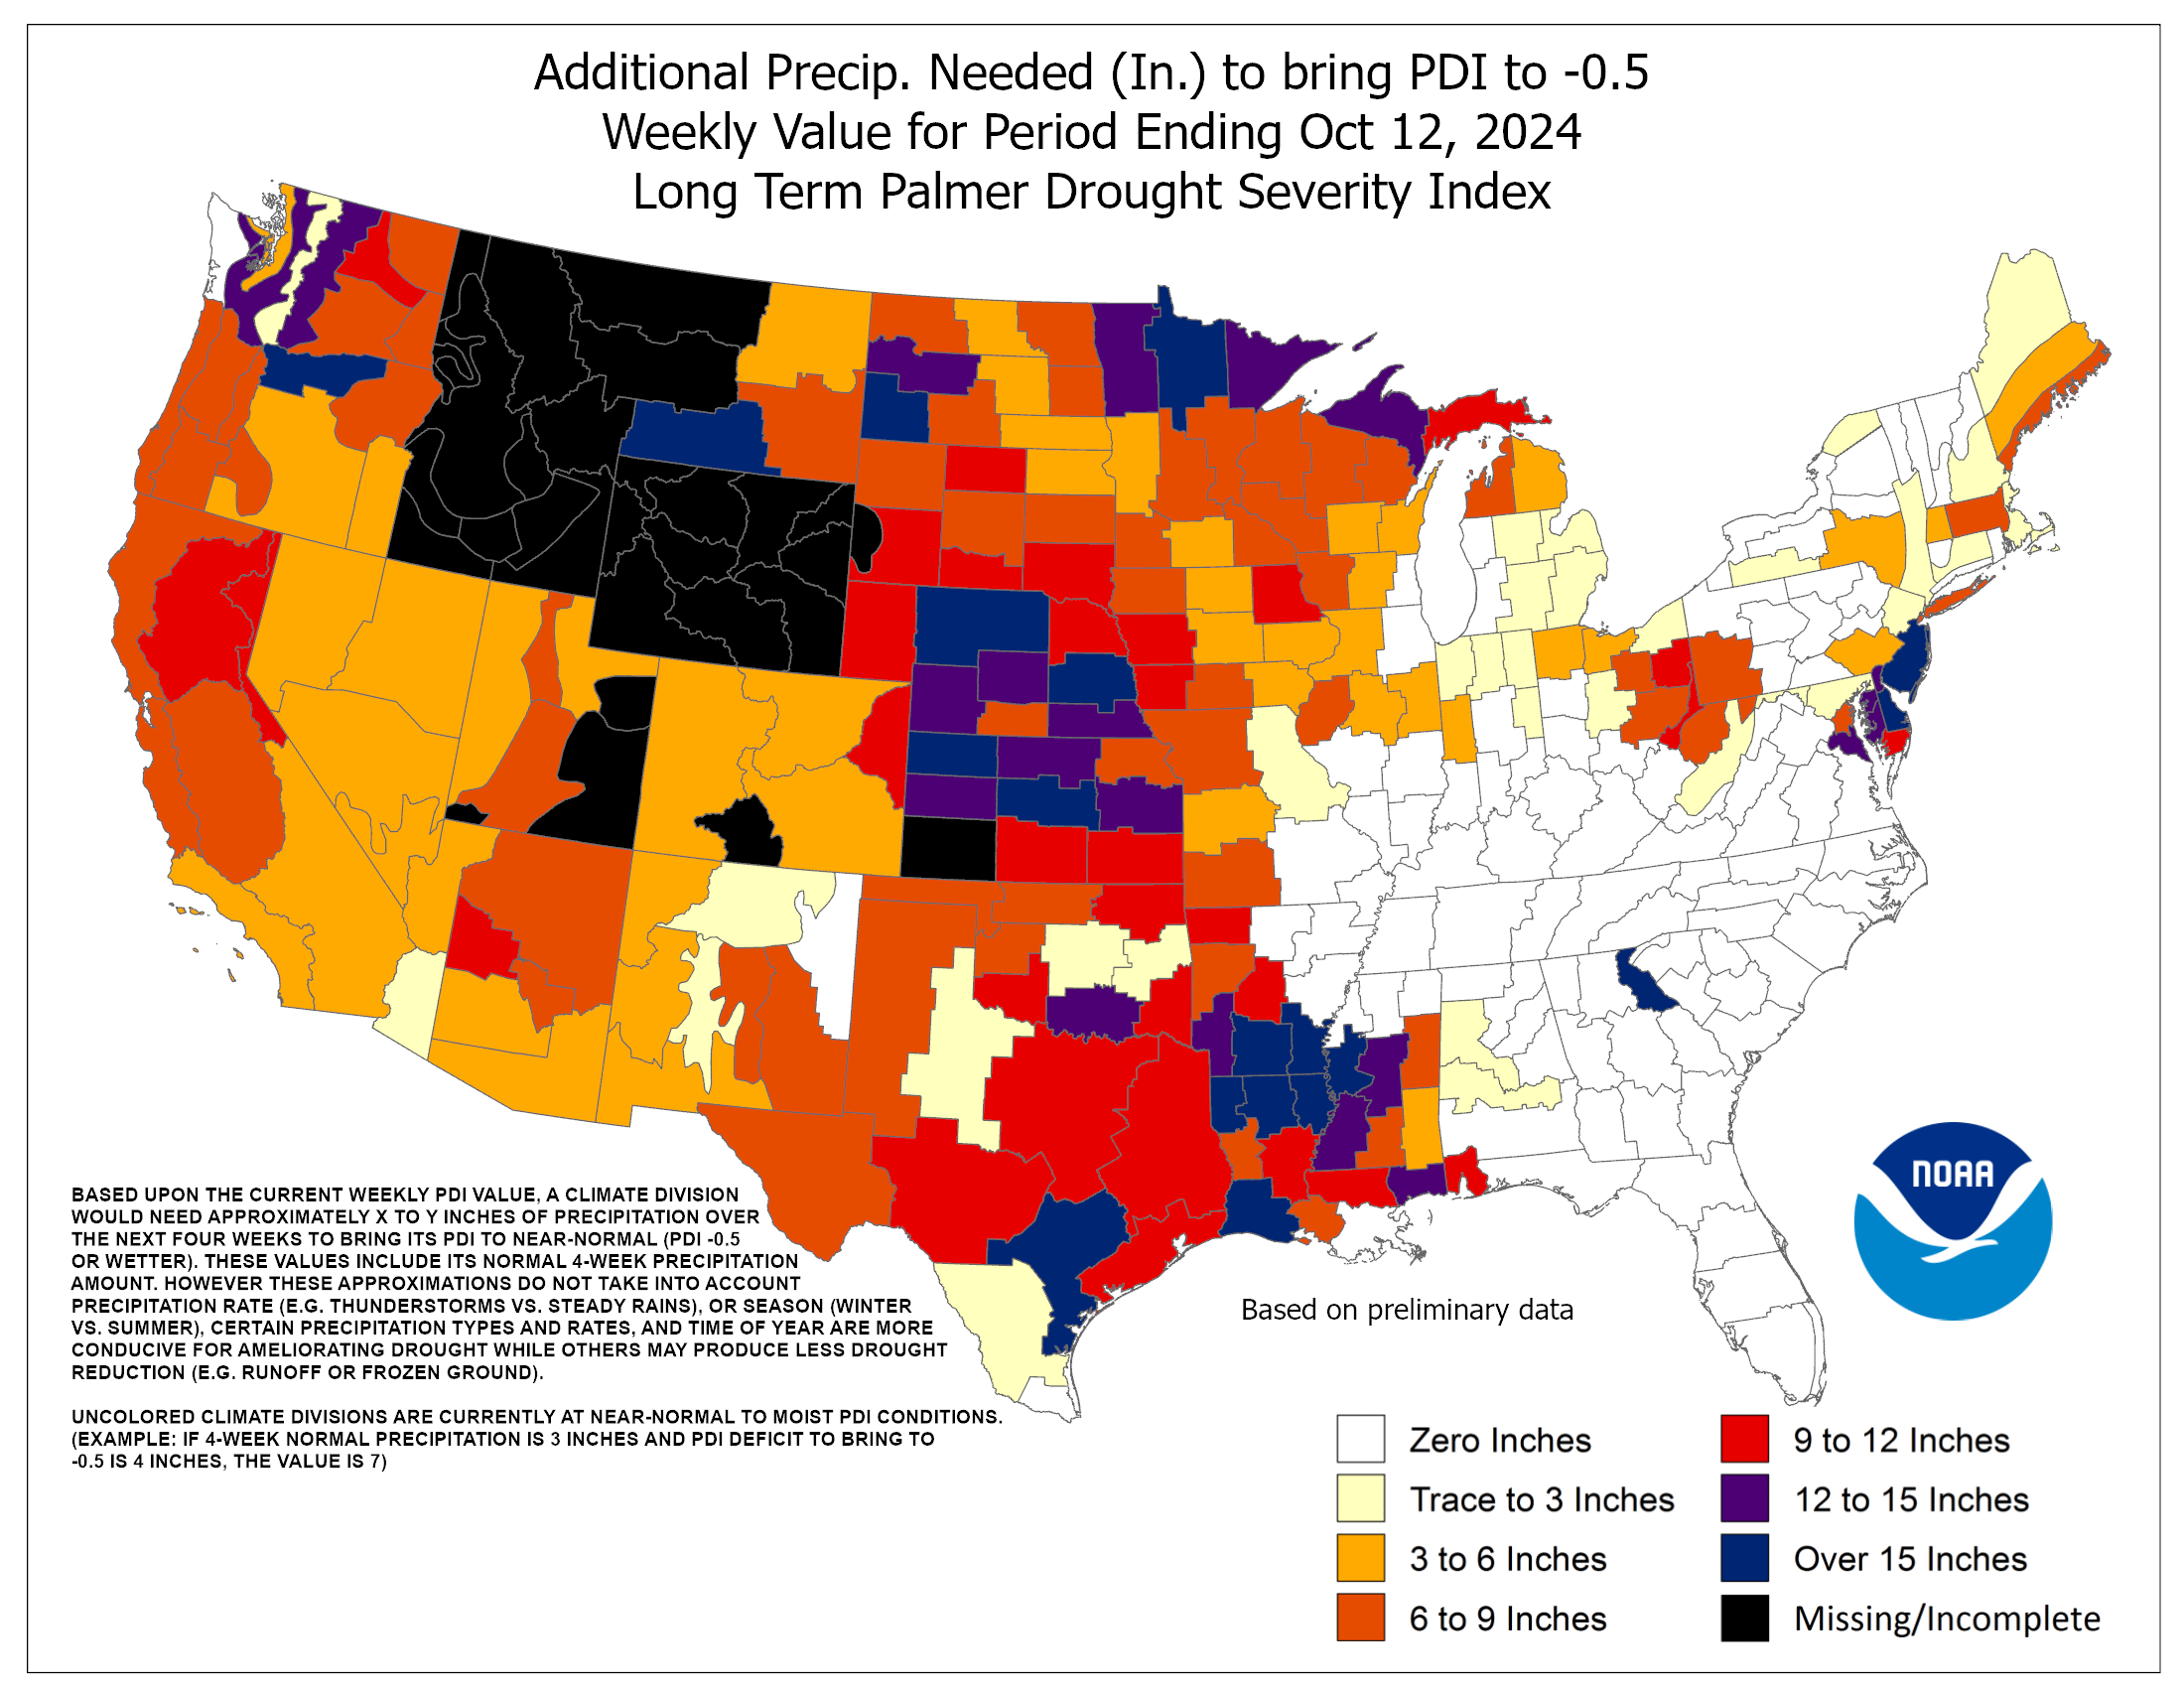
Figure 3. The great drought of 2012 has brought so little rain to the Midwest that some areas require over 15" of rain (dark purple colors) to end the drought. Image credit: NOAA/CPC.

Unanswered questions about Hurricane Isaac

1. Did the passage of Hurricane Isaac stir up oil from the Deepwater Horizon oil spill? Isaac was the first hurricane to pass over the site of the 2010 Deepwater Horizon oil spill. We know that large hurricanes are capable of creating currents in deep water at the bottom of the Gulf of Mexico; Hurricane Ivan caused upwelling currents of 0.5 cm/s at a depth of about 500 meters. In an August 28 article in the Huffington Post, Nick Shay, professor of meteorology and physical oceanography at the University of Miami, said: "Winds will push water away from the center of a storm, which causes an upwelling as the ocean tries to adjust. It brings whatever is near the bottom up higher in the water column and currents can then push it towards the coast." Up to 1 million barrels of oil from the spill are estimated to still be present in the deep water sediment, on beaches, and in the marshes of Louisiana, and it is possible some of this oil will wash up on the Gulf Coast in coming months. The storm surge of Isaac also likely flushed out oil lodged in the coastal marshes of Louisiana, but it is unknown how much of a concern this might be.

2. What's the deal with these super-sized Category 1 and 2 hurricanes that have been hitting the U.S.?The past three landfalling hurricanes in the U.S. -- Isaac (2012), Irene (2011), and Ike (2008) -- have all been exceptionally large, among the top ten on record for horizontal extent of tropical storm-force winds. Each of these storms had an unusually low pressure characteristic of a storm one full Saffir-Simpson category stronger. Is this the new normal for U.S. hurricanes? 

3. Did the new $14.5 billion upgrade to the New Orleans levee system cause worse flooding elsewhere? Whenever a new levee or flood control structure is created, you make someone else's flood problem worse, since the water has to go somewhere. Where did the water was stopped by the new $1.1 billion, 1.8-mile-long Lake Borgne flood barrier on the east side of New Orleans go? Did it flow south and contribute to the overtopping of the levees near Braithwaite? Or did it go north and contribute to the 36 hours of storm surge in excess of 5 feet observed along the Mississippi coast at Waveland? I posed this question to NHC's storm surge expert Jaime Rhome, and he said it was impossible to know without doing detailed storm surge modeling studies.

4. Can only hurricanes beginning with the letter "I" hit the U.S. now? Isaac (2012), Irene (2011), and Ike (2008) are the last three hurricanes to hit the U.S. It turns out that hurricanes that begin with the letter "I" and "C" have more names on the list of retired hurricanes than any other letter (nine each.) I'm thinking Isaac will get its name retired, letting storms beginning with "I" take over sole possession of first place on the retired storms list.

Hurricane Kirk in the Central Atlantic
Hurricane Kirk intensified into a 105-mph Category 2 hurricane this morning, becoming the 2nd strongest hurricane of the 2012 Atlantic hurricane season. Hurricane Gordon was the only stronger storm; Gordon hit sustained winds of 110 mph just before reaching the Azores Islands on August 18. Kirk has probably peaked in intensity and is about to move over colder waters and gradually decay. Kirk is not a threat to any land areas. 


Figure 4. Morning satellite image of Tropical Storm Leslie.

Tropical Storm Leslie a long-range threat to Bermuda, Canada, and the U.S. East Coast
Tropical Storm Leslie formed on Thursday in the Central Atlantic. Leslie's formation date of August 30 puts 2012 in 2nd place for earliest formation date of the season's 12th tropical storm. Only 1995 had an earlier formation date of the season's 12th storm. With records dating back to 1851, this year is only the second time 8 total storms have formed in August. The other year was 2004, when the first storm of the season formed on August 1 (Alex) and the 8th storm (Hermine) formed on August 29th. Satellite loops show that Leslie has a modest amount of heavy thunderstorm activity, and respectable low-level spiral bands and upper-level outflow. Conditions appear ripe to allow Leslie to intensify into a Category 2 hurricane by Sunday. Fortunately, Hurricane Kirk is weakening the ridge of high pressure to the north of Leslie, and Leslie is expected to turn to the northwest and miss the Lesser Antilles Islands. However, steering currents for Leslie are expected to collapse early next week, as Leslie gets stuck between two upper level lows. The storm will then slowly meander over the open ocean for many days, potentially threatening Bermuda. Leslie will stay stuck until a strong trough of low pressure approaches the U.S. East Coast around September 8. This trough should be strong enough to pull Leslie to the north and then northeast by September 9. At that time, Leslie may be close enough to the coast that the storm will make landfall in New England, Canada, or the Mid-Atlantic states. Leslie could also miss land entirely; this all depends upon the timing and strength of the September 8 trough of low pressure. Regardless, Leslie is expected to bring an extended period of high waves to the U.S. coast. According to NOAA's Wavewatch III model, large swells from Leslie will reach Bermuda by Monday and arrive along the U.S. East Coast on Tuesday. These waves will be capable of creating dangerous rip currents and beach erosion.

Portlight disaster relief charity responds to Issac
The Portlight.org disaster relief charity, founded and staffed by members of the wunderground community, are in Mississippi, helping out with Isaac relief efforts. You can check out their progress or donate to Portlight's disaster relief fund at the portlight.org website.


http://www.wunderground.com/blog/JeffMasters/comment.html?entrynum=2216

"Potential methane reservoirs beneath Antarctica" by J. L. Wadham et al., Nature 488 (2012); doi: 10.1038/nature11374

Nature, 488 (30 August 2012) 633-637; doi: 10.1038/nature11374


Potential methane reservoirs beneath Antarctica

Abstract
Once thought to be devoid of life, the ice-covered parts of Antarctica are now known to be a reservoir of metabolically active microbial cells and organic carbon1. The potential for methanogenic archaea to support the degradation of organic carbon to methane beneath the ice, however, has not yet been evaluated. Large sedimentary basins containing marine sequences up to 14kilometres thick2 and an estimated 21,000 petagrams (1Pg equals 1015g) of organic carbon are buried beneath the Antarctic Ice Sheet. No data exist for rates of methanogenesis in sub-Antarctic marine sediments. Here we present experimental data from other subglacial environments that demonstrate the potential for overridden organic matter beneath glacial systems to produce methane. We also numerically simulate the accumulation of methane in Antarctic sedimentary basins using an established one-dimensional hydrate model3 and show that pressure/temperature conditions favour methane hydrate formation down to sediment depths of about 300metres in West Antarctica and 700metres in East Antarctica. Our results demonstrate the potential for methane hydrate accumulation in Antarctic sedimentary basins, where the total inventory depends on rates of organic carbon degradation and conditions at the ice-sheet bed. We calculate that the sub-Antarctic hydrate inventory could be of the same order of magnitude as that of recent estimates made for Arctic permafrost. Our findings suggest that the Antarctic Ice Sheet may be a neglected but important component of the global methane budget, with the potential to act as a positive feedback on climate warming during ice-sheet wastage.
The production of methane (CH4) by methanogenic archaea is common across many sub-surface environments, including the deep ocean45678, permafrost9 and lake sediments101112 and is promoted by the presence of a suitable organic carbon (OC) substrate and an absence of higher-energy-yielding electron acceptors (for example, O2 and SO42−) with which to degrade organic matter. The release of this biogenic methane to the atmosphere is important in driving changes in global climate on geological, millennial and centenary timescales13. ‘Geological’ methane, produced largely via thermogenic processes in the deep sub-surface, supplements the biogenic component13. This methane may be generated via the thermal breakdown of organic matter and by inorganic synthesis and outgassing from the mantle. The recent discovery that sub-ice-sheet environments are likely to be anoxic14, are host to micro-organisms15 and may contain significant reservoirs of OC identifies them as favourable sites for methanogenesis. Research has so far focused upon the potential biological conversion of overridden OC to methane beneath the Northern Hemisphere Pleistocene ice sheets1416, where high-pressure and low-temperature conditions permit methane to accumulate as hydrate. Methane accumulation beneath the Antarctic Ice Sheet has not yet been evaluated, despite the presence of extensive and deep sedimentary basins containing viable microbial populations15 and OC available for conversion to methane.
Several factors suggest that there should be methane present beneath the Antarctic Ice Sheet. Geophysical data indicate extensive Antarctic sedimentary basins (ASBs) beneath the West and East Antarctic Ice Sheets (WAIS and EAIS), containing sedimentary drapes of up to 14km in thickness (Supplementary Table 1). Many of these basins are located around the Antarctic periphery, but penetrate several 100–1,000km into the Antarctic interior and are associated with the onset of accelerated motion in ice streams and their tributaries (Supplementary Information 1). The inferred origin of these sediments is marine, glaci-marine and crustal sedimentary sources (Supplementary Table 1). Melting conditions beneath about half of the ice sheet mean that sediments contain liquid water beneath the ice cover1718. The widespread presence of either dissolved methane or geochemical evidence for methanogenesis in marine cores, rock cores and seeps around the Antarctic margin indicates that OC is commonly cycled to methane in ocean margin basins (Supplementary Information 1). It is reasonable to expect similar processes to prevail beneath the ice. We therefore evaluated the potential for methane generation and release from sedimentary basins buried beneath the Antarctic Ice Sheet.

The Reality of Climate Change by xraymike79

Just a little doomer gloom to brighten your day:


The Reality of Climate Change


by  , Collapse of Industrial Civilization blog, August 31, 2012
The following is recent information from the National Oceanic and Atmospheric Administration (click on graphs to enlarge):
Year-to-Date Temperature Evolution

“This time series shows the 2012 year-to-date temperature through July, which was the warmest first seven months of any year on record for the lower 48. The year-to-date evolution of the contiguous U.S. temperatures for each year back to 1895 are also shown, with the five warmest and five coolest years highlighted. The January-July 2012 contiguous U.S. average temperature was 56.4 °F, 4.3 °F above average. The data for 2012 are preliminary.”

“This time series also shows the 2012 year-to-date temperature through July. Outcome scenarios based on persistence of temperature from August through December, the remaining five months of 2012, are shown. The January-July 2012 contiguous U.S. average temperature was 56.4 °F, 4.3 °F above average. The data for 2012 are preliminary.”And the following is a map of extreme global weather for July 2012 (click to enlarge):At this point, even if you don’t believe humans have anything to do with these extreme weather events which have grown progressively worse, the fact is that the climate is no longer falling within historic parameters from the records that have been kept over the last 116 years. An epic climate event is underway and there are 7 billion people in its path. Our leaders and the ‘captains’ of industry act as if they are powerless to do anything about it, much less alter our dependence on fossil fuels. In fact, we’re scrambling to the thawing Arctic to exploit more carbon-rich resources to cook. Nearly all scientists acknowledge that the release of CO2 from humankind’s burning of fossil fuels since the industrial revolution is the primary factor in today’s abnormal weather events. And recently, even former Koch-funded climate scientist deniers are changing their tune on the reality of anthropogenic climate change. It’s worth repeating the mind-blowing computation that we, the industrialized world, burn more than 100,000 tons of fossil fuel every hour. Certainly this has caused the acidification of the world’s oceans. A startling report from late last year stated:
The acidification of the world’s oceans from an excess of CO2 has already begun, as evidenced recently by the widespread mortality of oyster larvae in the Pacific Northwest. Scientists say this is just a harbinger of things to come if greenhouse gas emissions continue to soar.
And you can’t find fish from our waterways that is not contaminated with mercury:
Aug. 19 (Bloomberg) – Mercury contaminated every fish studied in 291 U.S. streams and rivers tested by scientists, and one in four had levels unsafe for people who eat average amounts of fish, a government report said today.
And in July a confrontational piece in the New York Times, written by marine ecologist Roger Bradbury, states rather bluntly:
IT’S past time to tell the truth about the state of the world’s coral reefs, the nurseries of tropical coastal fish stocks. They have become zombie ecosystems, neither dead nor truly alive in any functional sense, and on a trajectory to collapse within a human generation.
And:
Overfishing, ocean acidification and pollution have two features in common. First, they are accelerating. They are growing broadly in line with global economic growth, so they can double in size every couple of decades. Second, they have extreme inertia — there is no real prospect of changing their trajectories in less than 20 to 50 years. In short, these forces are unstoppable and irreversible.
And:
Coral reefs will be the first, but certainly not the last, major ecosystem to succumb to the Anthropocene — the new geological epoch now emerging.
As blogger it’ll-all-end-in-tears puts it, “The naming of the epoc feels like an appropriately hubristic climax to our age. The consequences of our prolonged war on the ecosystems that support (not serve…) us might well be coming around to extract their own price.”
Funny thing about the environment that we abuse and take for granted on a daily basis…Everything seems OK, until it suddenly isn’t.
I don’t know about you, but I like things to be somewhat predictable and dependable. It appears, however, that we have transgressed Mother Nature one too many times. Consider that at a one degree celsius increase, marked changes to the climate include the USA midwest becoming a desert with the remaining topsoil blowing away. The thinning polar ice caps and melting permafrost will release methane which is twenty times more potent than CO2:
Two new research papers published today improve our understanding of the planet’s methane emissions, and might raise worries about the role of the gas in warming the planet. The first suggests that there may be extensive methane deposits under the Antarctic ice sheets. Meanwhile, the second concludes that emissions of the gas from Arctic permafrost have been underestimated.
Island nations will flood. Forest fires will be more frequent. The frequency and intensity of storms will increase. Between a 1 and 2 degree increase, the albedo effect is diminished at the poles where sunlight reflects back into the atmosphere. Stressed trees from drought will also add more CO2 than O2. The world’s rivers will shrink. Countries will become destabilised and unleash waves of ecological and political refugees in search of H2O, food, and fuel. Between a 2 and 3 degrees increase, life becomes unbearable as soils emit more CO2, forests such as the Amazon burn away and release vast amounts of stored carbon, and the basic essentials of life (water, food, and fuel) become scarce. Nations wither and disappear.
And yet there will still be people who think it’s all a conspiracy.

Cartoon illustration by Horsey.

Thursday, August 30, 2012

"Activation of old carbon by erosion of coastal and subsea permafrost in Arctic Siberia" by J. E. Vonk et al., Nature, doi:10.1038/nature11392

Nature (2012) doi:10.1038/nature11392

Activation of old carbon by erosion of coastal and subsea permafrost in Arctic Siberia


Received
 
Abstract
The future trajectory of greenhouse gas concentrations depends on interactions between climate and the biogeosphere12. Thawing of Arctic permafrost could release significant amounts of carbon into the atmosphere in this century3. Ancient Ice Complex deposits outcropping along the ~7,000-kilometre-long coastline of the East Siberian Arctic Shelf (ESAS)45, and associated shallow subsea permafrost67, are two large pools of permafrost carbon8, yet their vulnerabilities towards thawing and decomposition are largely unknown91011. Recent Arctic warming is stronger than has been predicted by several degrees, and is particularly pronounced over the coastal ESAS region1213. There is thus a pressing need to improve our understanding of the links between permafrost carbon and climate in this relatively inaccessible region. Here we show that extensive release of carbon from these Ice Complex deposits dominates (57±2%) the sedimentary carbon budget of the ESAS, the world’s largest continental shelf, overwhelming the marine and topsoil terrestrial components. Inverse modelling of the dual-carbon isotope composition of organic carbon accumulating in ESAS surface sediments, using Monte Carlo simulations to account for uncertainties, suggests that 44±10 teragrams of old carbon is activated annually from Ice Complex permafrost, an order of magnitude more than has been suggested by previous studies14. We estimate that about two-thirds (66±16%) of this old carbon escapes to the atmosphere as carbon dioxide, with the remainder being re-buried in shelf sediments. Thermal collapse and erosion of these carbon-rich Pleistocene coastline and seafloor deposits may accelerate with Arctic amplification of climate warming213.

Figures at a glance