Blog Archive

Sunday, October 30, 2011

Nature News: Climate researchers warn of data crisis - Looming gaps in satellite coverage challenge sustained climate observation

Nature Newsdoi:10.1038/news.2011.616


Climate researchers warn of data crisis

Looming gaps in satellite coverage challenge sustained climate observation.

satelliteThe next generation of Earth-observing satellites will not be ready in time for a seamless transition from the current generation.NOAA

Climate scientists warn that critical gaps in climate data could open up after the current generation of Earth-observation satellites comes to the end of its life, with the next generation nowhere near ready to take over.

The problem is exacerbated by the lack of an adequate replacement for a pair of Earth-observation satellites, the Orbiting Carbon Observatory and Glory, which failed on launch in the past two years.
Earth-observation programmes will fail to provide the data continuity required for climate science unless they are more adequately managed and supported, Kevin Trenberth, a senior researcher at the US National Center for Atmospheric Sciences in Boulder, Colorado, told the World Climate Research Programme conference in Denver, Colorado, this week. "We cannot manage what we can't measure," he says.

Time gap

The US Earth Observing System run by NASA comprises polar-orbiting and low-inclination satellites that make long-term global observations of the land surface, biosphere, atmosphere and oceans. The polar-orbiting satellites Terra, Aqua and Aura will probably shut down in 2015, and the next generation of polar-orbiting satellites is unlikely to be fully deployed by then. The lack of temporal overlap will have serious consequences for the homogeneity and continuity of climate data sets, Trenberth and eight co-authors state in a white paper submitted to the meeting.

On 28 October 2011, NASA is set to launch the National Polar-orbiting Operational Environmental Satellite System Preparatory Project, a prototype of the new generation of satellites, Joint Polar Satellite System (JPSS), that will be the backbone of US space-based weather and climate observations. But owing to budgetary constraints, the first fully operational satellite of the JPSS, originally planned for launch in 2015, has been delayed until later in the decade.

As observing systems change from one generation of satellites to the next, adequate overlap between missions is required for testing, adjusting and calibrating new sensors. The possible two-year gap in coverage due to the delayed launch of the JPSS, says Trenberth, will cause critical discontinuity in observational records vital for monitoring global climate trends.

Data quality

Without the ability to calibrate the instruments on different systems, it becomes much harder to compare data between the two – something that is already a problem for many researchers, says Trenberth. Space-based climate observations are notoriously prone to bias. Trenberth points to disconcerting discrepancies and spurious variations in records, including those of precipitation and solar radiation, derived from different satellite sensors.

"You really need to know the limitations of the data you're working with," he says. "Satellite data have many merits and you can do a lot of tremendous science with them. But there are also many spurious signals in the data record which scientists must beware of treating as if they represented climate changes in the real world."

tamino: Judith Curry Opens Mouth, Inserts Foot

Judith Curry Opens Mouth, Inserts Foot

NOTE: See the UPDATE at the end of this post.
I didn’t expect Judith Curry to embarrass herself more than she did with her fawning over Murry Salby’s folly. But she’s topped (perhaps I should say “bottomed”) herself by a huge margin.
Anthony Watts was so excited he actually suspended his blog hiatus to report the story. He quotes the GWPF that “BEST Confirms Global Temperature Standstill,” and cites a story in the Daily Mail reporting that Judith Curry (a member of the Berkeley team) has roundly criticized Richard Muller (leader of the Berkeley team), on much the same basis. He quotes Curry herself, from the article:
As for the graph disseminated to the media, she said: ‘This is “hide the decline” stuff. Our data show the pause, just as the other sets of data do. Muller is hiding the decline.
With this statement, Curry reveals how little she understands the data created by the team of which she is a member, let alone the “other sets of data.” Which we might have anticipated, given that from what we’ve seen, she made little or no contribution to the actual Berkeley analysis.
Judging by her comments, it’s a good thing for the Berkeley team that she didn’t. The Daily Mail quotes her thus:

‘There is no scientific basis for saying that warming hasn’t stopped,’ she said. ‘To say that there is detracts from the credibility of the data, which is very unfortunate.’
That’s a pretty strong statement, Judith. Do you have a scientific basis to back it up? Have you actually analyzed the data from your own team? Do you even know?
Now that the Daily Mail and Anthony Watts have not only let the cat out of the bag but put it on display to make a “scandal” out of it, Curry seems to want to distance herself from her criticism. On her own blog she says:
I told Rose that I was puzzled my Muller’s statements, particularly about “end of skepticism” and also “We see no evidence of global warming slowing down.”
When asked specifically about the graph that apparently uses a 10 year running mean and ends in 2006, we discussed “hide the decline,” but I honestly can’t recall if Rose or I said it first. I agree that the way the data is presented in the graph “hides the decline.” There is NO comparison of this situation to Climategate. Muller et al. have been very transparent in their methods and in making their data publicly available, which is highly commendable.
My most important statement IMO is this: ‘To say that there is detracts from the credibility of the data, which is very unfortunate.’ My main point was that this is a very good data set, the best we currently have available for land surface temperatures. To me, this should have been the big story: a new comprehensive data set, put together by a team of physicists and statisticians with private funds. Showing preliminary results is of course fine, but overselling them at this point was a mistake IMO.
It seems to me that there are only two possibilities. Either Judith Curry hasn’t bothered to analyze the data from her own team — or she’s not competent to.
Just looking at the data isn’t enough. It’s all too easy to view some graph and get the wrong impression — in fact that what groups like GWPF exploit. Here, for instance, is the graph featured by GWPF:
The impression it gives, that global warming has stopped, is wrong. It’s the kind of easy misinterpretation based on the absence of both context and analysis which is constantly exploited by fake skeptics. I expect GWPF to disdain both context and analysis. But Judith Curry is supposed to be an actual scientist. I’m skeptical.
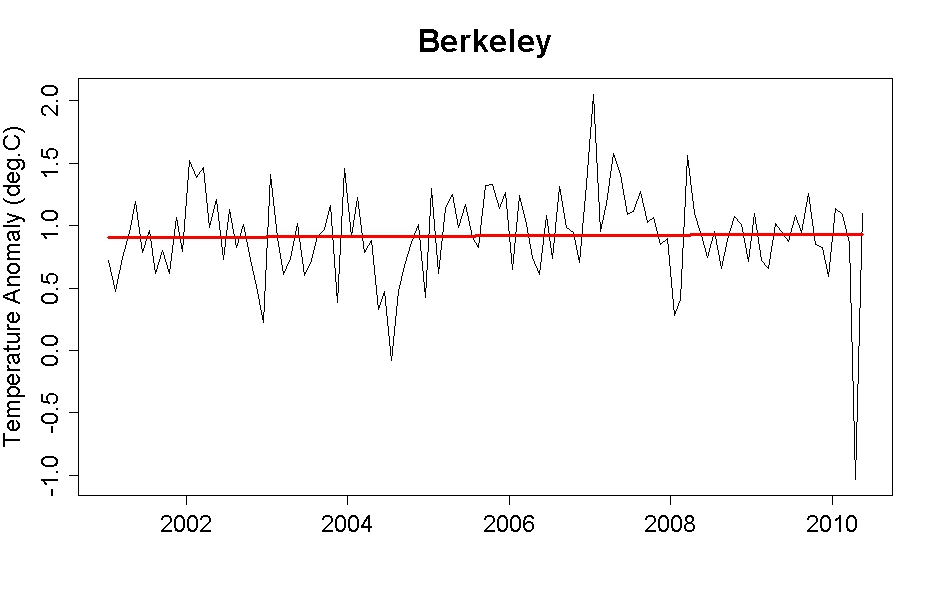
Since Judith Curry seems unwilling or unable to do the analysis, we’ll just have to do it for her. Let’s start with the data used by GWPF. Here it is with a trend line:
Please note that it starts in January 2001 and ends in May 2010, so it covers a tiny bit less than a decade! That’s a great big “red flag.”
The slope of the trend line (from ordinary least squares) is only 0.03 deg.C/decade. It’s fair to call that “flat.” But the standard error from that calculation — even if we use a white-noise model — is 0.13 deg.C/decade. So the real value could be as high as 0.29 deg.C/decade — which, curiously enough, is a tiny bit higher than the trend rate in the Berkeley data from 1975 to the present — a period for which you can only deny warming if you’re both blind and insane. And yes, it could easily be an even higher slope since we’ve used a white-noise model, which underestimates the uncertainty. Hey Judith: there’s a scientific basis for you.
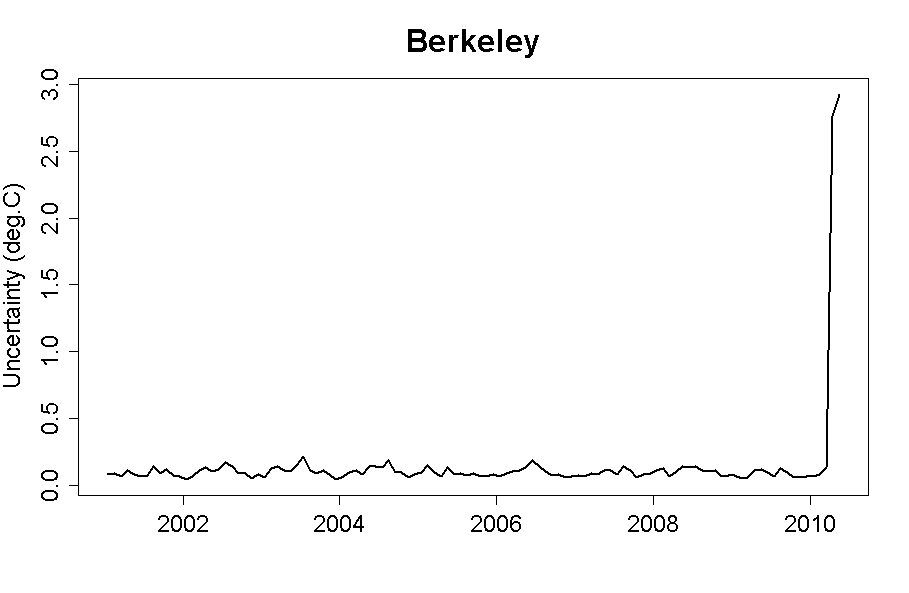
But that’s not all! The Berkeley data also include uncertainty levels for each monthly value. Let’s graph the uncertainties:
Whoa!!! What’s that huge spike at the end? It rises faster than a “hockey stick”!
The huge spike is the huge uncertainty level of the final two data points — April and May 2010. While the other data have uncertainty levels around 0.1 deg.C, those two months have uncertainty levels of 2.8 and 2.9 deg.C. Which makes them, plainly, unreliable.
And notice that one of those too-uncertain-to-be-useful data points is the deep “dip” at the end, the April 2010 value which is about 2 deg.C below the trend line. It’s called an “outlier,” in fact it’s an outlier of the first magnitude, a really big super-giant “this ain’t right” staring you in the face. And since it’s a super-giant dip it’s gonna skew the trend estimate low. The simplest correct thing to do is to omit those two data points.
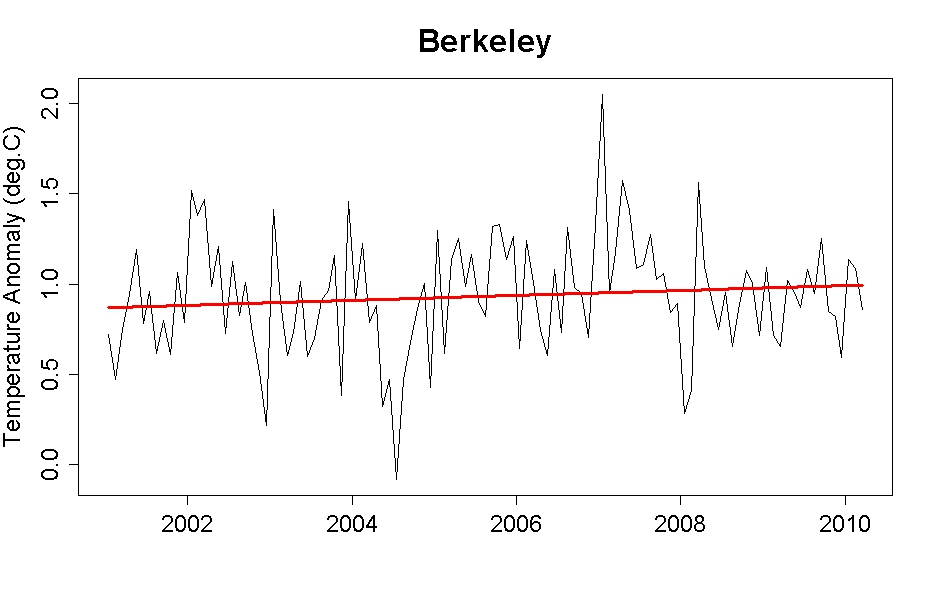
So let’s do it again, but end at March 2010 rather than include the uber-fuzzy April and May 2010 data. Here’s the trend line from 2001:
Now it’s noticeably upward. The estimated slope is 0.14 deg.C/decade — more than four times as large, just from removing two errant data points. Its standard error is 0.11 degC/decade, so the real trend rate could be as high as 0.36 deg.C/decade, quite a bit larger than the average rate since 1975. And yes, it could easily be an even higher slope since we’ve used a white-noise model, which underestimates the uncertainty. Hey Judith: there’s another scientific basis for you.
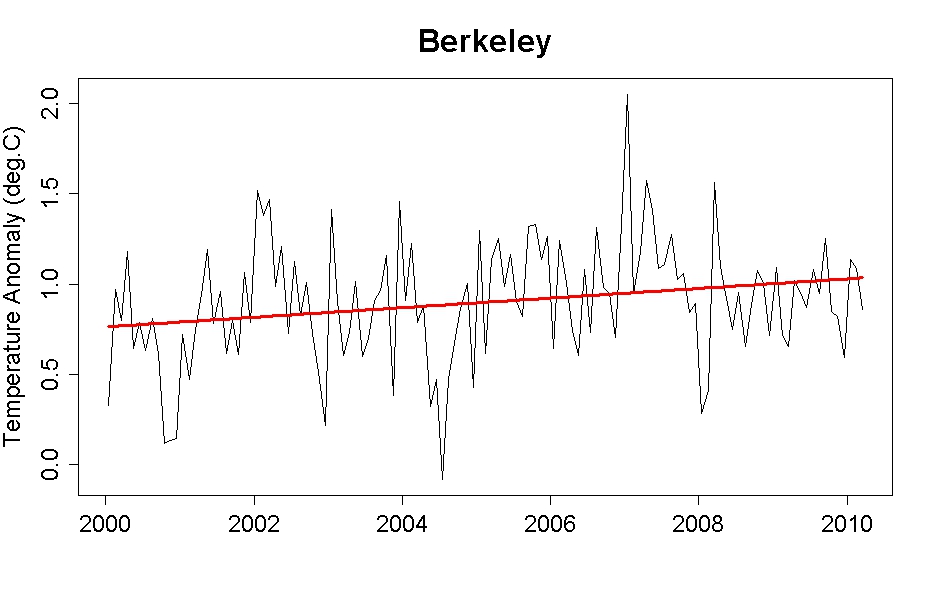
To show just how sensitive the results are to such a short time span — and how misleading it can be to make pronouncements on that basis — let’s consider a time span just one year longer, starting in 2000 rather than 2001. That gives this:
Now the trend rate is up to 0.27 deg.C/decade. That’s just about the same as the trend rate from 1975! Hey Judith: there’s another scientific basis for you.
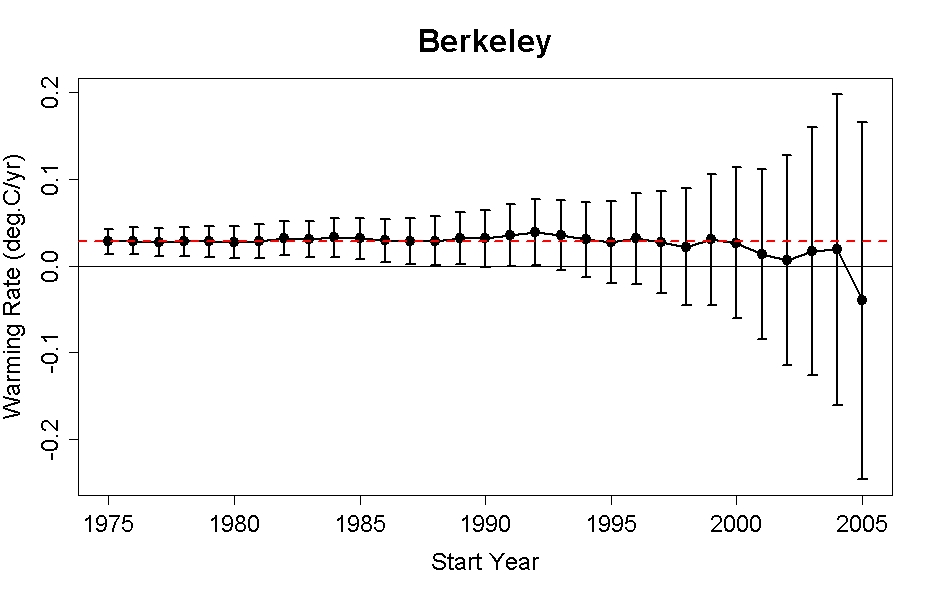
As a last bit of analysis, let’s omit the outlier data, then compute the trend for each starting year to the present, for all start years from 1975 to 2005. Let’s also estimate the confidence intervals using a more realistic error model. What would that show? This:
The red dashed line shows the trend rate from 1975. Note that not one single start year gives an estimate which contradicts that rate. That is evidence — damn strong evidence in fact — that the underlying trend rate has not changed since 1975. Hey Judith: there’s a REAL scientific basis for you.
Here’s the kicker: the uncertainty in those trend rates is probably higher, perhaps by a substantial amount, because that graph is based on an AR(1) model for the noise. Using an ARMA(1,1) model instead gives this:
That shows just how mistaken, how foolish, how downright boneheaded it is to say that “There is no scientific basis for saying that warming hasn’t stopped.”
Judith Curry’s statement is exactly the kind of ill-thought-out or not-at-all-thought-out rambling which is an embarrassment to her, and an embarrassment to science itself. To spew this kind of absolute nonsense is shameful. Judith Curry, you should be ashamed of yourself.
Richard Muller, the target of Curry’s ire, also managed to embarrass himself:
However, he admitted it was true that the BEST data suggested that world temperatures have not risen for about 13 years. But in his view, this might not be ‘statistically significant,’ although, he added, it was equally possible that it was – a statement which left other scientists mystified.
Of course we’re mystified. Didn’t you do the analysis? Don’t you know? Honestly, what kind of insane world do we live in when we get this level of discussion about one of the most crucial issues of our time, from people who are supposed to be scientists?
In my opinion, the WORST aspect of this is that Judith Curry states unequivocally that “Our data show the pause,” which utterly ignores the extreme level of uncertainty in temperature trends over periods as short as 10 years or less, after she has so often indulged in self-righteous posturing on her own blog about the “uncertainty monster.” It looks like the “uncertainty monster” decided to turn around and bite her on the ass.
Regarding Curry’s involvement with the press release, and the submission of papers, the Daily Mail reports that “Prof. Muller failed to consult her before deciding to put them on the internet earlier this month, when the peer review process had barely started, and to issue a detailed press release at the same time.” She stated, “It would have been smart to consult me.” On her blog she says:
My continued collaboration on this project will be discussed this week with Muller and Rohde.
It seems to me that what would really be smart is to find someone else to be on the Berkeley team.
UPDATEJudith Curry protests that she was misrepresented by the article in the Daily Mail, and several readers have mentioned that David Rose, the author of the article, is just the man to do such a thing. It’s easy to believe that she was indeed the victim of his malfeasance.
But even after reading this post, she still hasn’t disavowed the statement “There is no scientific basis for saying that warming hasn’t stopped.” In fact she commented on her own blog saying, “There has been a lag/slowdown/whatever you want to call it in the rate of temperature increase since 1998.” Question for Curry: What’s your scientific basis for this claim?

Joe Romm: Koch-Fueled Study Finds Recent Warming “On the High End” and Speeding Up, as Curry Frags Muller Herself

Koch-Fueled Study Finds Recent Warming “On the High End” and Speeding Up, as Curry Frags Muller Herself


We have learned two important things from the Berkeley Earth Surface Temperature Study (BEST):
  1. Denier claims that prior scientific analysis of the key land surface temperature data OVER-estimated the warming trend were not merely wrong, but the reverse was true.  Warming has been high and accelerating.
  2. The Deniers and Confusionists and their media allies can never be convinced by the facts and will twist themselves into pretzels to keep spreading disinformation.
We also learned that BEST’s Judith Curry still would rather be a confusionist than a scientist  — but that ain’t news (see “Judith Curry abandons science“). I digress.
data analysis graph
The decadal land-surface average temperature using a 10-year moving average of surface temperatures over land. Anomalies are relative to the Jan 1950–December 1979 mean. The grey band indicates 95% statistical and spatial uncertainty interval.
Recall the foundation of the phony Climategate charge.  Somehow the climate scientists at the Climatatic Research Unit (CRU) at the University of East Anglia, led by Phil Jones, were manipulating the data and the peer review process as part of a grand conspiracy to convince the public the earth has been warming faster than it really is.  A key point is that “the CRU compiles the land component of the record and the Hadley Centre provides the marine component.”
The BEST team vindicated climate science — see Koch-Funded Berkeley Temperature Study Does “Confirm the Reality of Global Warming.” Equally important, if you read the key paper, they found:
we find that the global land mean temperature has increased by 0.911 ± 0.042 C since the 1950s….  our analysis suggests a degree of global land-surface warming during the anthropogenic era that is consistent with prior work (e.g. NOAA) but on the high end of the existing range of reconstruction.
D’oh!  The BEST data shows considerably higher warming in recent years than HadCRU (the red line above).
Of course, this isn’t news to anybody who actually follows this issue.  Two years ago, the Met Office released an analysis concluding that “The global temperature rise calculated by the Met Office’s HadCRUT record is at the lower end of likely warming.”
As an aside, Muller, in a March 2010 talk (near the end) clearly states that if warming is on the high range, then humanity should be more concerned because we have “less time to react.”
What’s even more worrisome is that the study clearly shows that the warming trend is accelerating.  First, “Our analysis technique suggests that temperatures during the 19th century were approximately constant (trend 0.20 ± 0.25 C/century).”  No big surprise there.
But then as human emissions kick into overdrive, things heat up:
The trend line for the 20th century is calculated to be 0.733 ± 0.096 C/century,well below the 2.76 ± 0.16 C/century rate of global land-surface warming that we observe during the interval Jan 1970 to Aug 2011.
That is, in the past 40 years, the land has warmed nearly 4 times faster than it did in the last century.  This really kills the denier meme that the observed data suggests we will see only a small amount of warming this century.
In fact, even the warming of the past 4 decades was reduced by human and volcanic aerosol emissions and the general lags between emissions and warming.  Thus, it is now patently obvious that if we stay on our current emissions path, the acceleration of warming will continue as greenhouse gas concentrations continue rising.  That’s without even considering the amplifying carbon-cycle feedbacks.
Another mini-bombshell in the paper, which has led co-author Curry to frag team leader Muller, is this conclusion:
Though it is sometimes argued that global warming has abated since the 1998 El Nino event (e.g., Easterling & Wehner 2009, Meehl et al. 2011), we find no evidence of this in the GHCN land data.  Applying our analysis over the interval 1998 to 2010, we find the land temperature trend to be 2.84 ± 0.73 C/century, consistent with prior decades.
Still warming, after all these years.
Now, even though Curry signed her name to this submitted journal article, she apparently doesn’t believe it’s true.
The pseudo-journalist David Rose of the UK’s Telegraph got a bunch of quotes from her in a piece headlined, “Scientist who said climate change sceptics had been proved wrong [aka Muller] accused of hiding truth by colleague” [aka Curry].  It is exceedingly difficult to know what Curry is saying because:
  1. It is always difficult to know what Curry is saying (see Hockey Stick fight at the RC Corral).
  2. Rose generally isn’t reliable (see “David Rose destroys his credibility and the Daily Mail’s with error-riddled climate science reporting” and links therein).
  3. Curry has already walked back some of her comments (see here post here, but put a head vise on first, please).
But, she does say on her blog, “In David Rose’s article, the direct quotes attributed to me are correct.”
Still, neither she nor Rose appears to know what they are talking about.  Nor does Curry appear to have read the paper she put her name on.
Tamino has sorted out the statistics in his post, “Judith Curry Opens Mouth, Inserts Foot.”  He notes at the end:
Judith Curry protests that she was misrepresented by the article in the Daily Mail, and several readers have mentioned that David Rose, the author of the article, is just the man to do such a thing. It’s easy to believe that she was indeed the victim of his malfeasance.
But even after reading this post, she still hasn’t disavowed the statement “There is no scientific basis for saying that warming hasn’t stopped.” In fact, she commented on her own blog saying, “There has been a lag/slowdown/whatever you want to call it in the rate of temperature increase since 1998.” Question for Curry: What’s your scientific basis for this claim?
In his post, Tamino shows there is no scientific basis for the Curry’s claim at all:
Judith Curry’s statement is exactly the kind of ill-thought-out or not-at-all-thought-out rambling which is an embarrassment to her, and an embarrassment to science itself. To spew this kind of absolute nonsense is shameful. Judith Curry, you should be ashamed of yourself.
If I may offer an imperfect analogy, suppose your kid averages 70 in his ten math tests in 7th grade, and then averages 80 in ten tests in 8th grade and then averages 90 in ten tests in 9th grade.  Is your kid getting better in math?  What if your kid got the same exact yearly averages but had one 100 toward the end of 8th grade and one 100 toward the end of 9th grade.  Does that suddenly mean your kid didn’t get better in math in 9th grade?
The deniers and confusionists would have you believe so.  In fact, Tamino shows that the warming trend is real in the Berkeley data even if you start the trendline fairly recently:
Warming Rate vs. Start Year
That shows just how mistaken, how foolish, how downright boneheaded it is to say that “There is no scientific basis for saying that warming hasn’t stopped.”
Curry tried to frag Muller, but dropped the grenade on herself.
Related posts: