Blog Archive

Tuesday, May 10, 2011

Study by Duke Scientists in PNAS Links Flammable Drinking Water to Fracking


Scientific Study Links Flammable Drinking Water to Fracking


(Abrahm Lustgarten/ProPublica)
For the first time, a scientific study has linked natural gas drilling and hydraulic fracturing with a pattern of drinking water contamination so severe that some faucets can be lit on fire.
The peer-reviewed study, published today in the Proceedings of the National Academy of Sciences, stands to shape the contentious debate over whether drilling is safe and begins to fill an information gap that has made it difficult for lawmakers and the public tounderstand the risks.
The research was conducted by four scientists at Duke University. They found that levels of flammable methane gas in drinking water wells increased to dangerous levels when those water supplies were close to natural gas wells. They also found that the type of gas detected at high levels in the water was the same type of gas that energy companies were extracting from thousands of feet underground, strongly implying that the gas may be seeping underground through natural or manmade faults and fractures, or coming from cracks in the well structure itself.
“Our results show evidence for methane contamination of shallow drinking water systems in at least three areas of the region and suggest important environmental risks accompanying shale gas exploration worldwide,” the article states.
The group tested 68 drinking water wells in the Marcellus and Utica shale drilling areas in northeastern Pennsylvania and southern New York State. Sixty of those wells were tested for dissolved gas. While most of the wells had some methane, the water samples taken closest to the gas wells had on average 17 times the levels detected in wells further from active drilling. The group defined an active drilling area as within one kilometer, or about six tenths of a mile, from a gas well.
The average concentration of the methane detected in the water wells near drilling sites fell squarely within a range that the U.S Department of Interior says is dangerous and requires urgent “hazard mitigation” action, according to the study.
The researchers did not find evidence that the chemicals used in hydraulic fracturing had contaminated any of the wells they tested, allaying for the time being some of the greatest fears among environmentalists and drilling opponents.
But they were alarmed by what they described as a clear correlation between drilling activity and the seepage of gas contaminants underground, a danger in itself and evidence that pathways do exist for contaminants to migrate deep within the earth.
“We certainly didn’t expect to see such a strong relationship between the concentration of methane in water and the nearest gas wells. That was a real surprise,” said Robert Jackson, a biology professor at Duke and one of the report’s authors.
Methane contamination of drinking water wells has been a common complaint among people living in gas drilling areas across the country. A 2009 investigation by ProPublica revealed that methane contamination from drilling was widespread, including in Colorado, Ohio and Pennsylvania. In several cases, homes blew up after gas seeped into their basements or water supplies. In Pennsylvania a 2004 accident killed three people, including a baby.
In Dimock, Penn., where part of the Duke study was performed, some residents’ water wells exploded or their water could be lit on fire. In at least a dozen cases in Colorado, ProPublica’s investigation found, methane had infiltrated drinking water supplies that residents said were clean until hydraulic fracturing was performed nearby.
The drilling industry and some state regulators described some of these cases as “anecdotal” and said they were either unconnected to drilling activity or were an isolated problem. But the consistency of the Duke findings raises questions about how unusual and widespread such cases of methane contamination may be.
“It suggests that at least in the region we looked, this is a more general problem than people expected,” Jackson told ProPublica.
For those who live in the midst of this problem, the report serves as long-awaited vindication. “We weren’t just blowing smoke. What we were talking about was the truth,” said Ron Carter, a Dimock resident whose water went bad when drilling began there in 2008 and was later tested as part of the study. “Now I’m happy that at least something helps prove out our theory.”
Methane is not regulated in drinking water, and while research is limited, it is not currently believed to be harmful to drink. But the methane is dangerous because as it collects in enclosed spaces it can asphyxiate people nearby, or lead to an explosion.
To determine where the methane in the wells they tested came from, the researchers ran it through a molecular fingerprinting process called an isotopic analysis. Water samples furthest from gas drilling showed traces of biogenic methane—a type of methane that can naturally appear in water from biological decay. But samples taken closer to drilling had high concentrations of thermogenic methane, which comes from the same hydrocarbon layers where gas drilling is targeted. That—plus the proximity to the gas wells—told the researchers that the contamination was linked to the drilling processes.
In addition to the methane, other types of gases were also detected, providing further evidence that the gas originated with the hydrocarbon deposits miles beneath the earth and that it was unique to the active gas drilling areas. Ethane, another component of natural gas, and other hydrocarbons were detected in 81 percent of water wells near active gas drilling, but in only 9 percent of water wells further away. Propane and butane were also detected in some drilling area wells.
The report noted that as much as a mile of rock separated the bottom of the shallow drinking water wells from the deep zones fractured for gas, and identified several ways in which fluids or the gas contaminants could move underground: The substances could be displaced by the pressures underground; could travel through new fractures or connections to faults created by the hydraulic fracturing process; or could leak from the well casing itself somewhere closer to the surface.
The geology in Pennsylvania and New York, they said, is tectonically active with faults and other pathways through the rock. They noted that leaky well casings were the most likely cause of the contamination, but couldn’t rule out long-range underground migration, which they said “might be possible due to both the extensive fracture systems reported for these formations and the many older, uncased wells drilled and abandoned.”
The water was also analyzed for signs that dangerous fluids from inside the gas wells might have escaped into water supplies. The group tested for salts, radium and other chemicals that, if detected, would have signaled that the produced water or natural fluids in the well’s target zone were making it to the aquifers. But those types of fluids were not found. The group did not test for fracking chemicals or hydrocarbons like benzene, relying instead on the saline or radioactive compounds like radium as indicators.
In an interview, Jackson said that gas was more likely to migrate underground than liquid chemicals. Based on his findings, he doesn’t believe the toxic chemicals pumped into the ground during fracturing are likely to end up in water supplies the same way the methane did. “I’m not ready to use the word impossible,” he said, “but unlikely.”
In a white paper the group issued along with the journal article, Jackson and the others acknowledged the uncertainty and called for more research. “Contamination is often stated to be impossible due to the distance between the well and the drinking water,” they wrote. “Although this seems reasonable in most (and possibly all) cases, field and modeling studies should be undertaken to confirm this assumption… Understanding any cases where this assumption is incorrect will be important—when, where, and why they occur—to limit problems with hydraulic fracturing operations.”
A hydrogeologist closely affiliated with the drilling industry raised questions about the study. "It's possible, assuming their measurements are accurate, that all they have done is document the natural conditions of the aquifer," said John Conrad, president of Conrad Geosciences in Poughkeepsie, N.Y. Conrad spoke with ProPublica at the suggestion of Energy In Depth, a drilling industry advocacy group, but said that he did not work for EID.
He said that the thermogenic methane -- which many scientists say comes from the same deep gas layers where drilling occurs -- could be naturally occurring. He also said the researchers didn't test enough wells to support their conclusions, though he could not say how many wells would have been appropriate.
Conrad said the most likely cause for the contamination identified by the Duke researchers -- that the gas was leaking out of faulty well casings -- seemed implausible.
"For their assumptions to hold up there would have to be more than just the occasional bad cement job," he said. "They are implying that where you see hydraulic fracturing you should expect to see elevated methane. We are aware of faulty cement jobs. But we don't believe that it is common and we certainly don't believe that it is universal."
The Duke study precedes a national study by the Environmental Protection Agency into the dangers of hydraulic fracturing that is expected to be finished sometime next year. Last year the EPA found that some chemicals known to be used in fracturing were among the contaminants detected in 11 residential drinking water wells in Pavillion, Wy.—where more than 200 natural gas wells have been drilled in recent years—but that investigation is continuing and the scientists haven’t concluded that the contamination is linked with drilling or hydraulic fracturing.
The release of the Duke research could immediately shape the increasingly intense public debate over drilling and hydraulic fracturing, especially in some of the areas where the research was conducted. Pennsylvania, which holds drilling companies liable for drinking water contamination within 1000 feet of a gas well, might consider the fact that the Duke researchers found the contamination extended to about 3,000 feet, Jackson said. New York State has a moratorium in place for hydraulic fracturing of horizontally-drilled wells—which cover more area and require more chemicals—through the end of June to allow for more consideration of the risks. “I would extend that at least temporarily,” Jackson said.
Congress, too, is taking note.
"This study provides eye-opening scientific evidence about methane contamination and the risks that irresponsible natural gas drilling poses for drinking water supplies,” said Congressman Maurice Hinchey, D-NY. “It provides yet another reason why more study of the environmental and health risks associated with hydraulic fracturing is needed."
Hinchey is one of several Democratic members of Congress who recently re-introduced the FRAC Act, which calls for public disclosure of the chemicals used underground. The bill, which is currently languishing in the House, would remove an exemption in federal law that prohibits the EPA from regulating hydraulic fracturing.

"Hot Men of Climatology" by Deanna Duke

Hot Men of Climatology

by Deanna Duke, The Crunchy Chicken, October 21, 2009

There are plenty of lists floating around out there stating who is the hottest this or that. Who are the hottest green models and the hottest green actors and so forth. But, what about the people who really matter, the ones doing the climate research, not the celebrities?

Because of this, I wanted to write a post about the Hot Men of Climatology, but when I went a huntin' for hotties, pretty much what I found were older men sporting a lot of hair or none at all. And, the only hot thing going on was more related to warming temperatures than chiseled abs. But, I've found the up and coming (well, under 50ish) "hot" men of climatology for your review. Let me know if I missed any :)  [This post is almost two years old, so I think we have to add Jason Box, John Abraham, and Alun Hubbard from my very own "Climate Scientist Hunks of the Month" (nominees welcome!).]

Michael MannFirst up is Michael Mann a, relatively speaking, sprightly 43-year-old climatologist. Michael is an author of more than 80 peer-reviewed journal publications and has attained public prominence as lead author of a number of articles on paleoclimate and as one of the originators of a graph of temperature trends dubbed the "hockey stick graph" (not to be confused with the "hockey mom graph").

The graph received both praise and criticism after its publication in an IPCC report. In 2005 he was appointedAssociate Professor at Pennsylvania State University, in the Department of Meteorology and Earth and Environmental Systems Institute, and Director of the university's interdepartmental Earth System Science Center. If you like your men with degrees in Applied Math, Geology and Geophysics, Michael fits the bill. 

Caspar AmmannNext up is Caspar Ammann, a 40-year-old researcher from Switzerland. Caspar is a climate scientist working at the National Center for Atmospheric Research and is interested in the reconstruction of natural climate forcings, natural climate variability, coupled modeling of natural and anthropogenic climate change, and data/model intercomparison. In other words, he studies past and present climate changes.

He has a Ph.D. in Geosciences and his research centers around the climate of past centuries and millennia and how this information can help to understand what elements of future climate might be predictable as well as what potential environmental and ecological impacts are to be anticipated given various climate change scenarios.

Rasmus BenestadRasmus Benestad is a physicist by training and works as a senior scientist at the Norwegian Meteorological Institute and the Oslo Climate Group. He earned a Ph.D. in Physics from the Atmospheric, Oceanic and Planetary Physics department at Oxford University. 

Rasmus' recent work has involved research on regional climate and seasonal predictability, but his past experience also includes ocean dynamics/air-sea processes and cloud micro-physics. In addition, he is the author of the book Solar Activity and Earth's Climate.

Gavin SchmidtRounding out the list is hottie Gavin Schmidt a climatologist and climate modeller at the NASA Goddard Institute for Space Studies. In 2004 he was named as one of Scientific American's "Top 50 Research Leaders" for the year. In addition to his scientific work he is a founding member and one of the contributors to the climatology blog, RealClimate.

Gavin is a computer climate modeler who works on developing large-scale models of the atmosphere-ocean climate system. He has worked on understanding climate variability both in past climates going back as far as 55 million years ago and forward to the possible future climates. 

Whew! Now, even though it seems totally sacrilegious to do this, this post is just beggingfor a poll....

Who's the hottest climate change scientist? [go to link at bottom of this post to cast a vote]


Update: Ooh! I have a late entry. Unfortunately, I can't add him to the poll, but wanted to introduce you all to him.

Julian Sachs is a paleoclimatologist working right here at the University of Washington. He has a Ph.D. in Chemical Oceanography from MIT and his research interests include the evolution of the tropical Pacific climate and the El Niño-Southern Oscillation since the last glacial period. 

He also works on the development and application of organic geochemical and stable isotopic techniques in paleoclimatology and oceanography. I'm pretty sure he can melt a few icebergs while he's at it too.

The Pontifical Academy of Sciences has issued a new report on global warming entitled "Fate of Mountain Glaciers in the Anthropocene: A report by the working group commissioned by the Pontifical Academy of Sciences"

The Pope Weighs In: Climate Change, The Himalayas, And Everything

by M. J. Murphy, BigCityLib Strikes Back, May 7, 2011


The Vatican, more particularly the Pontifical Academy of Sciences, has issued a new report on global warming entitled: Fate of Mountain Glaciers in the Anthropocene: A Report by the Working Group Commissioned by the Pontifical Academy of Sciences.  It strikes me as rather well done. Not so much for the original scientific content--what's happening to the world's glaciers under AGW has been pretty thoroughly documented.  However, as a vehicle designed to communicate that knowledge, and to promote an action plan based on that knowledge, it is exemplary, and should be read  by anyone who has spent time engaging in the often tedious back and forth re: "How should scientists speak to the public about Climate Change?"  Well, here's how.  Look and learn.

From the introduction:

We call on all people and nations to recognise the serious and potentially irreversible impacts of global warming caused by the anthropogenic emissions of greenhouse gases and other pollutants, and by changes in forests, wetlands, grasslands, and other land uses. We appeal to all nations to develop and implement, without delay, effective and fair policies to reduce the causes and impacts of climate change on communities and ecosystems, including mountain glaciers and their watersheds, aware that we all live in the same home. By acting now, in the spirit of common but differentiated responsibility, we accept our duty to one another and to the stewardship of a planet blessed with the gift of life.

I encourage people to read the whole thing. A couple of particularly good things about it.

(1) It seems to me that the focus on mountain glaciers is a brilliant move, rhetorically.  The Alps wind their way across much of Europe; runoff from the rapidly shrinking Himalayan glaciers supply water to significant parts of Asia; North and South American glaciers are also in retreat.  And everywhere their decline is likely to bring deleterious consequences. If you are issuing a call for global collective action, and that's what the Pontifical Academy's report appears to be doing, then you want to find an effect of AGW that is truly global in nature.  For example, Tornados, Pine Beetle infestations (assuming the Vatican even has expertise in these areas) have effects too regionalized to serve the report's symbolic requirements.  Glaciers work wonderfully.  I do not think the specific subject matter of the document, upon which it hangs its more general conclusions and recommendations, was chosen randomly.

(2) The report contains beautifully written scientific prose (or at least has been translated into such).  Francis Bacon, who invented the style, would have nodded in approval.  The writing is austere, authoritative, and yet not terribly difficult to parse.  In other words, if you've got half a brain in your head, you can understand it.  This bit outlines states quite elegantly the breakdown in responsibility for the AGW  problem as it applies to developed vs. developing countries:

By acting now, in the spirit of common but differentiated responsibility, we accept our duty to one another and to the stewardship of a planet blessed with the gift of life. 

If you want to call the Pope a socialist bent on transferring first world wealth to the third world, go ahead, but you will seem diminished in the face of such fine writing.

(3)  One interesting feature of the report is the employment of the phrase "The Anthropocene Age," which is

...a recent and informal geologic chronological term that serves to mark the evidence and extent of human activities that have had a significant global impact on the Earth's ecosystems. 

Some have argued that this is a misappropriation of the vocabulary of "ages" for what is in geological terms a short-term event.  But I am more interested in the fact that the report is not afraid of this kind of openly rhetorical flourish (as noted in the wiki article above, the term is not a formal part of the geological vocabulary).  In fact, I would argue that it stomps royally all over the  framework of roles and poses, designed to separate explanations of science from science advocacy, laid out by Roger ["The Dodger"] Pielke, Jr., in his Honest Broker.  Which suggests to me that such anatomies of good vs. bad scientific discourse are pointless abstractions that are simply not relevant to any actual debate at the interface of climate science and climate policy.  In other words: feel free to ignore Roger Pielke, Jr.  The Pope does.

Saturday, May 7, 2011

Jeff Masters: Record floods on Mississippi River; Lake Champlain at highest level since 1869; record flooding in Canada; third tornado from the April 27 Super Outbreak rated an EF-5

Record floods on Mississippi River; Lake Champlain at highest level since 1869; record flooding in Canada; third tornado from the April 27 Super Outbreak rated an EF-5

by Jeff Masters, wunderblog, May 6, 2011

The Ohio River at Cairo, Illinois, continues to fall today, with a level of 59.3', 2.5' below the all-time peak of 61.8' set on Monday night. On Monday night, the Army Corps of Engineers was forced to intentionally destroy a levee at Birds Point on the west bank of the Mississippi, just downstream from Cairo, Illinois, in order to relieve pressure on the levees in Cairo and save that city from a billion-dollar levee breach. 

The destruction of the Birds Point levee also helped slow the rise of the Mississippi River just south of its confluence with the Ohio River, but the river is still rising slowly, and has now set all-time records at New Madrid, Missouri, Tiptonville, Tennessee, and Caruthersville, Missouri -- a 70-mile stretch of river downstream from Cairo. 

Currently, the Mississippi is expected to reach its 2nd highest level on record at Memphis on May 10, cresting at 48.0'. The all-time record at Memphis occurred during the great flood of 1937, when the river hit 48.7'. Downstream from Memphis, flood waters pouring in from the Arkansas River, Yazoo River, and other tributaries are expected to swell the Mississippi high enough to beat the all-time record at Vicksburg, Mississippi, by 1.3' on May 20, and smash the all-time record at Natchez, Mississippi, by six feet on May 22, and by 3.2 feet at Red River Landing on May 23. 

Red River Landing is the site of the Old River Control Structure, the Army Corps' massive engineering structure that keeps the Mississippi River from carving a new path to the Gulf of Mexico. I'll have a detailed post talking about the Old River Control Structure next week. Its failure would be a serious blow to the U.S. economy, and the great Mississippi flood of 2011 will give the Old River Control Structure its most severe test ever. 

Also of concern is the forecast for the Mississippi to crest at 19.5 feet in New Orleans on May 24. The levees in New Orleans protect the city for a flood of 20.0 feet--that is not much breathing room. Fortunately, only 0.5-1.5 inches of rain are expected over the Missouri-Illinois region over the next five days, which should not raise flood heights significantly.

Good links to follow the flood:
Summary forecast of all crests on Lower Mississippi and Ohio Rivers.
Wundermap for Cairo, IL, with USGS River overlay turned on.
National Weather Service "May 2011 Mississippi River Flood" web page.


Figure 1. Flooding of the farmland along the Birds Point-New Madrid Floodway due to the intentional destruction of a levee along the west bank of the Mississippi River in southeast Missouri is obvious in this pair of before and after photos. Image credit: NASA Earth Observatory.

Lake Champlain hits highest level since 1869; record flooding in Canada
The Governor of Vermont declared a state of emergency yesterday in Vermont due to flooding along Lake Champlain. Heavy rains over the past ten days, combined with snow melt have combined to push the lake ot three feet above flood stage, and the lake has now broken its previous record high, set in 1869. The flooding has caused numerous road closures but no evacuations in the U.S. 


The story is different in Quebec, Canada, where flood waters from Lake Champlain coursing down the Richelieu River have created a 150-year flood, forcing the evacuation of 1,000 people and the flooding of 3,000 homes and businesses in the Richelieu Valley, just south of Montreal. The lake level is expected to crest Saturday morning, then slowly fall. Lake Champlain is 120 miles long with nearly 600 miles of shoreline, making it the sixth largest natural lake in the U.S., trailing only the Great Lakes in size.


Figure 2. Five to eight inches of precipitation has fallen over much of the Lake Champlain watershed over the past two weeks. Image credit: NOAA/AHPS.

A third tornado from the April 27 Super Outbreak rated an EF-5
Yesterday, the Jackson, Mississippi, office of the NWS upgraded the violent tornado that hit Neshoba, Kemper, Winston, and Noxubee Counties in the northeast part of the state to EF-5 status, with top winds of 205 mph. This tornado continued into Alabama and had a total path length of 92.3 miles. Three people died in the tornado, which was so powerful that it dug out the ground to a depth of two feet over an area 25-50 yards wide and several hundred yards long. This is the third tornado rated EF-5 from the April 27 outbreak; tornadoes that hit Smithville, MS, and Hackleburg, AL, also received EF-5 ratings.


Figure 3. EF-5 damage from the April 27, 2011 Neshoba tornado in Mississippi. The tornado was so powerful that it dug out the ground to a depth of two feet over an area 25-50 yards wide and several hundred yards long. Image credit: NWS.

Rare EF-2 tornado hits New Zealand
A tornado ripped through New Zealand's largest city, Auckland, on Tuesday, killing one person at a shopping mall and injuring at least fourteen others. The damage was rated EF-2, making the tornado one of the strongest in New Zealand's history. Below is some footage of the twister, showing why it is dangerous to be in a car during a tornado. (Note also the clockwise rotation of the tornado -- this is the Southern Hemisphere, where storms rotate clockwise.)

http://www.liveleak.com/view?i=61d_1304621717
Figure 4. Footage of the May 3, 2011, New Zealand tornado that passed through the Auckland suburb of Albany.


http://www.wunderground.com/blog/JeffMasters/comment.html?entrynum=1797#

Tuesday, May 3, 2011

Joseph Romm: Tornadoes, extreme weather, and climate change. April sets record for tornadoes in any month and in any 24-hour period. But what caused "The Katrina of tornado outbreaks"?


April sets record for tornadoes in any month and in any 24-hour period. But what caused "The Katrina of tornado outbreaks"?

Joseph Romm's Climate Progress, May 2, 2011

Stu Ostro, Weather Channel Senior Meteorologist, “The Katrina of tornado outbreaks“:

The atmosphere was explosively unstable with summerlike heat and humidity, interacting with a classic wind shear setup as a strong jet stream and upper-level trough crashed overhead… 
The atmosphere is extraordinarily complex, and ultimately what’s happened the past month is probably a combination of influences, including La Nina, other natural variability, and anthropogenic global warming.
UPDATE:  “Persistent, heavy rains have helped swell the Mississippi and Ohio rivers to the highest levels ever recorded,” CNN reports.  And the rivers are still rising.
The Effect of Climate Change on Tornado Frequency and Magnitude:  “There is an obvious increase in tornado frequency between 1950-1999. This could be due to increased detection. Also this could be due to changing climatic conditions.”
For decades, scientists have predicted that if we kept pouring increasing amounts of heat-trapping greenhouse gases into the atmosphere, we would change the climate.   They specifically predicted that that many key aspects of the weather would become more extreme — more extreme heat waves, more intense droughts, and stronger deluges.

As far back as 1995, analysis by NOAA’s National Climatic Data Center (led by Tom Karl) showed that over the course of the 20th century, the United States had suffered a statistically significant increase in a variety of extreme weather events, the very ones you would expect from global warming, such as more — and more intense — precipitation. That analysis concluded the chances were only “5 to 10 percent” this increase was due to factors other than global warming, such as “natural climate variability.” And since 1995, the climate has gotten measurably more extreme.

Multiple scientific studies find that indeed the weather has become more extreme, as expected, and that it is extremely likely that humans are a contributing cause (see “Two seminal Nature papers join growing body of evidence that human emissions fuel extreme weather, flooding that harm humans and the environment” and links therein).

Beyond that, as Dr. Kevin Trenberth, head of the Climate Analysis Section of the National Center for Atmospheric Research, explained here last year: “There is a systematic influence on all of these weather events now-a-days because of the fact that there is this extra water vapor lurking around in the atmosphere than there used to be say 30 years ago. It’s about a 4% extra amount, it invigorates the storms, it provides plenty of moisture for these storms.”  He told theNY Times, “It’s not the right question to ask if this storm or that storm is due to global warming, or is it natural variability. Nowadays, there’s always an element of both.”

I have tended to focus on the extreme weather events for which the causal chain is clearest and which will do the most damage to the most people in the foreseeable future.  Dust-Bowlification is probably at the top of that list (see NCAR analysis warns we risk multiple, devastating global droughts even on moderate emissions path).

But tornadoes are among the most visibly and viscerally destructive events — though I do find it interesting how much media coverage these tornadoes have gotten compared to, say, Tennessee’s 1000-year deluge aka Nashville’s ‘Katrina.’   So it was inevitable that scientists would be asked the obvious question of whether the two recent remarkable outbreaks are connected to human-caused climate change — and they were indeed remarkable.

NOAA and the National Weather Service reported yesterday the astonishing statistics:

NWS’s preliminary estimate is that there have been more than 600 tornadoes thus far during the month of April 2011.
  • The previous record number of tornadoes during the month of April was 267 tornadoes set in April 1974.
  • The previous record number of tornadoes during any month was 542 tornadoes set in May 2003.
Meteorologist Dr. Jeff Masters notes that “the period from 8am April 27 – 8am April 28 during last week’s outbreak has a good chance of breaking the record for most tornadoes in a 24-hour period, which is currently 148.“  NOAA’s preliminary report says that there were “a total of 226 tornadoes” during that 24 hours!

Masters also points out “remarkably, two of the top four outbreaks in history occurred within two weeks of each other.”  Indeed, the other two were May 2003 and May 2004, which means the top 4 were in the past 8 years.


[Comparing fatalities over time is not germane for reasons that I would have thought obvious, and Peter Gleick rightly slams Roger Pielke, Jr. for "gross misuse" of that data on Pielke's website.  My thoughts are with those who suffered through these storms and lost loved ones.  As someone with a family member who lost his home during Katrina, I know it is an unimaginably traumatic event.]

Many scientists have weighed in on the climate-tornado link.  Two of the people who have done more research and publication on extreme weather and climate change than most are Trenberth and Karl, now director of NCDC.  I emailed Karl for his thoughts and here is what he wrote:
Best info we have on the relationship between a warmer world and severe convective storms that can produce tornadoes is in the 2008 Synthesis and Assessment Report of the US Global Change Research Program. Chapter three of that Weather and Climate Extremes Assessment indicates that several studies do show that environmental conditions favorable for convection are more likely with more greenhouse gases, but results are not conclusive. 
We now have improved resolution models running at our Oak Ridge Supercomputer thanks to the Stimulus funding.  We may be  able to make more definitive statements (one way or the other)after these get analyzed over the next few years. Meanwhile, we know that La Nina years tend to have a greater chance of severe outbreaks.  So as usual, there are natural factors that have to be considered, and any human made factors would be confounded within these naturally occurring events making our attribution much more difficult. 
Joe, what we can say with confidence is that heavy and extreme precipitation events often associated with thunderstorms and convection are increasing and have been linked to human induced changes in atmospheric composition.
You can find that 2008 Report here.  I wrote about it here (see Sorry, deniers & delayers, Even Bush Administration says human emissions are changing the climate).

Trenberth made clear to me a year ago in an extended interview that he was dismayed by the media coverage of extreme weather, especially extreme deluges, that made no mention whatsoever of global warming:
I find it systematically tends to get underplayed and it often gets underplayed by my fellow scientists. Because one of the opening statements, which I’m sure you’ve probably heard is “Well you can’t attribute a single event to climate change.” But there is a systematic influence on all of these weather events now-a-days because of the fact that there is this extra water vapor lurking around in the atmosphere than there used to be say 30 years ago. It’s about a 4% extra amount, it invigorates the storms, it provides plenty of moisture for these storms and it’s unfortunate that the public is not associating these with the fact that this is one manifestation of climate change. And the prospects are that these kinds of things will only get bigger and worse in the future.
I emailed Trenberth to check his quote in ThinkProgress. He stands by the quote with a little to clarification of the context:
It is irresponsible not to mention climate change in stories that presume to say something about why all these storms and tornadoes are happening. 
The environment in which all of these storms and the tornadoes are occurring has changed from human influences (global warming). Tornadoes come from thunderstorms in a wind shear environment. This occurs east of the Rockies more than anywhere else in the world. The wind shear is from southerly (SE, S or SW) flow from the Gulf overlaid by westerlies aloft that have come over the Rockies. That wind shear can be converted to rotation. The basic driver of thunderstorms is the instability in the atmosphere: warm moist air at low levels with drier air aloft. With global warming the low level air is warm and moister and there is more energy available to fuel all of these storms and increase the buoyancy of the air so that thunderstorms are strong. There is no clear research on changes in shear related to global warming. On average the low level air is 1 deg F and 4 percent moister than in the 1970s.
Just because attribution is difficult doesn’t mean that the subject of global warming should be avoided entirely when talking about tornadoes.  Equally important, when discussing extreme weather and climate, tornadoes should not be conflated with the other extreme weather events for which the connection is considerably more straightforward and better documented:

TP quotes climate scientist Gavin Schmidt, climate modeller at the NASA Goddard Institute for Space Studies, who said:
It is a truism to say that everything has been affected by climate change so far and therefore this latest outbreak must in some sense have been affected, but attribution is hard and the further down the chain the causality is supposed to go, the harder this is. For heat waves it is easier, for statistics on precipitation intensity it easier – there are multiple levels of good modelling, theory and observations to back it up. But we have much less to go on with tornadoes.
I thought the NY Times story Thursday was pretty good.  There are lots of posts on this.  Michael Tobis pointed out Judith Curry’s post, which I wouldn’t normally link to given her general abandonment of science, but she pointed out the study I cited at the top, The Effect of Climate Change on Tornado Frequency and Magnitude:
A research project by Michael Pateman and Drew Vankat found that the frequency of tornadoes had increased between 1950 and 1999 — though better detection likely played a significant role in those statistics. But if there’s strong evidence that climate change and tornadoes are connected, researchers have yet to uncover it…
The researchers themselves found:
There is an obvious increase in tornado frequency between 1950-1999. This could be due to increased detection. Also this could be due to changing climatic conditions. 
Looking at the raw data we have seen that there are generally less tornadoes in El Nino years compared to La Nina Years. But, since we were unable to get climate data, we were unable to see if the change in the frequency was due to climate factors. 
Our data has failed to show a strong correlation in increase in tornado frequency and magnitude during El Nino and La Nina events.
The jury is out.

For more data on the increase in frequency, which is certainly due in large part to better detection, here is NCDC’s State of the Climate:  Tornadoes Annual 2010:
http://www1.ncdc.noaa.gov/pub/data/cmb/images/tornado/2010/annual/2010annual_torncount.png
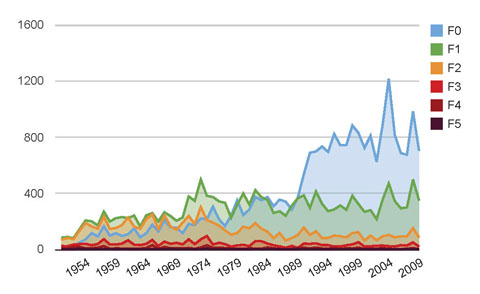
A NYT blogger directs us to this chart:
tornado trends
There is no apparent trend in the strongest tornadoes (F5 is the most destructive).  The NYT blogger quotes Harold Brooks of the National Severe Storms Laboratory:
The primary changes appear to occur ~1975, most likely as a result of the retrospective rating process that assigned ratings to tornadoes prior to the near-real-time ratings that began when the [National Weather Service] adopted the F-scale operationally in the mid-1970s, and ~2000, for reasons that aren’t completely clear, but are likely due to an increased emphasis on examining construction details and policies that changed the nature in how the ratings are created for the strongest tornadoes. Both have lead to a decrease in probability of a tornado being very strong, given that it’s strong. It’s possible that there’s a meteorological component, but the reporting practice changes are large enough that I don’t think we can pull a physical signal out, even if it’s fairly large.
So it may simply be that the data is simply is too confused by the reporting practices for analysis to draw any strong conclusions.  That doesn’t mean the question shouldn’t be asked or that scientists shouldn’t give their best answer.

In general, I do think it’s best to avoid statements like “global warming is to blame for” or “global warming caused” or “this is evidence of global warming,” especially in regards tornadoes.

Finally, while tornadoes will continue to grab the headlines wherever they flatten cities and take lives, it is virtually certain that other extreme events — and ultimately the permanently changed climate — will cause the greatest harm attributable to human emissions of greeenhouse gases:

http://climateprogress.org/2011/05/02/tornadoes-extreme-weather-and-climate-change/

Monday, May 2, 2011

Potential Temperature (K) at 2 PVU, April 2011

Check out the region where the tornadoes went through:

Jeff Masters: Two EF-5 tornadoes confirmed from last week's outbreak; record Ohio River (re: Tuscaloosa-Birmingham Tornado Outbreak, April 27, 2011)

Two EF-5 tornadoes confirmed from last week's outbreak; record Ohio River flood

by Jeff Masters, wunderblog, May 2, 2011

Damage surveys and the hunt for missing victims continues today in the areas devastated by last week's historic tornado outbreak. With the death toll in the 340-350 range, the April 25-28 tornado outbreak has surpassed the April 3-4, 1974, Super Outbreak (315 killed) as the deadliest U.S. tornado outbreak of the past 50 years. Hardest hit was Alabama, with 249 deaths; Tennessee and Mississippi had 34 deaths each, and deaths were also reported in Arkansas, Georgia, Virginia, Louisiana, and Ontario, Canada. Twenty-eight separate tornadoes killed people. According wunderground's weather historian, Christopher C. Burt, in his post The World's Deadliest Tornadoes, only the death tolls of the great Tri-State tornado outbreak of 1925 (747 killed) and the 1936 Tupelo-Gainsville tornado outbreak (454 killed) were greater. These outbreaks both occurred during an era before Doppler radar and tornado warnings. Had last week's outbreak occurred back in those days, I expect the death toll would have been in the thousands. The National Weather Service provided warning times of 15-30 minutes for all of last week's killer storms, allowing time for most people to get to safe shelters.


Figure 1. MODIS satellite image from NASA's Aqua satellite taken on Friday, April 29, 2011, showing the damage paths of three of Wednesday's tornadoes in Alabama.


Figure 2. Damage paths of Wednesday's tornadoes as compiled by the National Weather Service office in Birmingham, Alabama.

Damage surveys will continue for another week, so it is uncertain exactly how many tornadoes were spawned in last week's outbreak. The confirmed count is already at 146, which would make it the 4th largest tornado outbreak in history. The total is likely to surpass the 155 confirmed tornadoes logged during the April 14-16, 2011, tornado outbreak. According to a list of tornado outbreaks maintained by Wikipedia, only two other tornado outbreaks have had as many as 150 twisters -- the May 2004 outbreak (385) and the May 2003 outbreak (401). So, remarkably, two of the top four outbreaks in history occurred within two weeks of each other. In addition, the period from 8 a.m. April 27 to 8 a.m. April 28, during last week's outbreak, has a good chance of breaking the record for most tornadoes in a 24-hour period, which is currently 148 (set in the April 3-4, 1974, Super Outbreak).

Two EF-5 tornadoes confirmed
Damage surveys have confirmed that last week's April 25-28 outbreak spawned at least eleven violent EF-4 tornadoes (winds 166-200 mph) and two EF-5 tornadoes (winds greater than 200 mph). This is only the 5th time since tornado ratings began in 1950 that two top-end tornadoes have occurred on the same day. The last time was on March 13, 1990, in Kansas. An EF-5 with 205 mph winds hit Smithville, Mississippi, at 3:44 p.m. EDT on Wednesday. The tornado's path was only 3 miles long, but was 1/2 miles wide and did extreme damage. Fifteen were killed, 40 injured and 166 buildings destroyed. Some well-built, modern, 2-story homes that were bolted to their foundations were completely destroyed, leaving only the foundation. This type of damage is characteristic of an EF-5 tornado with 205 mph winds. The Smithville tornado is the first EF-5 tornado in Mississippi since the Candlestick Park tornado of March 3, 1966. The other EF-5 tornado of the day, the Hackleburg tornado, touched down in Northwest Alabama in Marion County at 3 p.m. CDT, and devastated the towns of Phil Campbell and Hackleburg. This tornado killed at least 25 people. Meteorologist Gary Dobbs, with WAAY-TV since 1984, spotted this tornado from his car and was unable to get to his storm shelter. While his house was destroyed around him, Dobbs was thrown 40 feet from the house. The door of the storm shelter blew off, and none of the friends therein were seriously injured. Dobbs required hospitalization. One other tornado that may get an EF-5 rating is the violent Tuscaloosa-Birmingham tornado, which killed at least 66 people and injured over 1,000. It was the deadliest tornado in the U.S. since 1955, when 80 people died in Udall, Kansas. This tornado had a path length of 80.3 miles, and has been preliminarily rated at high-end EF-4 with 190 mph winds. The Tuscaloosa-Birmingham tornado is likely to be the most expensive tornado of all-time, and damage from the April 25-28 outbreak is likely to rank as the most expensive tornado outbreak in history. Insured damages have been rated at $2-$5 billion, and uninsured losses will be several billion more. The previous most expensive tornado outbreak in history was the $3.5 billion price tag, in 2005 dollars, of the April 3-4, 1974, Super Outbreak.


Figure 3. Radar reflectivity image of the Hackleburg, Alabama, tornado of April 27, 2011, a few minutes after it devastated the town of Hackleburg, Alabama (white cross at center of image). The Hackleburg tornado was rated an EF-5 with greater than 200 mph winds.


Figure 4. Remarkable video of the tornado that hit Tuscaloosa, Alabama. Beginning at about 2:30 into the video, one can see the ominous mini-vorticies and cloud of debris that encircled the tornado.

Unprecedented flooding on Ohio River
Last week's storm system, in combination with heavy rains earlier this month and over past 24 hours, pushed the Ohio River at Cairo, Illinois, to 60.6 feet at 1 a.m. CDT, May 1. This is the highest flood in history, besting the 59.5' mark of 1937. Additional heavy rains of 2-4 inches are expected over the next five days, and the river is not expected to crest until Wednesday, at a height of 61.5 feet. As the record flood waters from the Ohio River pour into the Mississippi and are joined by melt water from the this winter's record snow pack over the Upper Mississippi, all-time flood heights are likely to be exceeded at many points along a 400-mile stretch of the Mississippi below its confluence with the Ohio. I'll have a more detailed look in my next post.