Blog Archive

Monday, May 2, 2011

Worcester Polytechnical Institute students win fight to hear Big Oil arch-nemesis Richard Heinberg, senior fellow at the Post Carbon Institute instead of ExxonMobil's Rex Tillerson


Students successfully rally to juxtapose Exxon arch-nemesis with Exxon CEO as commencement speaker


The CEO of America's largest and most profitable company is invited to be the commencement speaker at one of the country's oldest technological universities -- you would think everyone would be pumped!
But no, the students at Worcester Polytechnic Institute responded to the secret deal to bring the head of WPI mega-donor ExxonMobil to campus by launching a protest. Improbably, they won. Now, on the same day that Exxon Chief "Rex" Tillerson comes to their school, students will be allowed to hear an alternate address by Big Oil arch-nemesis Richard Heinberg, senior fellow at the Post Carbon Institute.
It must chap Rex's tan Texas hide to have to set foot on the same stage as Heinberg, who will tell anyone who listens that the end of the age of cheap oil is here and that companies like Exxon, through climate change and peak oil denial, are the latter-day equivalent of Neville Chamberlain.
Only instead of the Germans coming, it's the end of our way of life as we know it. That's the message Heinberg will deliver to the RPI class of 2011, and they invited him, so apparently they're ready to hear it. Maybe some day one of them will help dig us out of this fossil-fuel shaped hole we find ourselves in, and when she's addressing the audience at her Nobel Prize ceremony, she'll say, "It all started with a speech by Richard Heinberg…"

Glenn Hurowitz, Grist: Now that we’ve killed Osama bin Laden, let’s kill oil

Now that we’ve killed Osama bin Laden, let’s kill oil 

Default badgeavatar for Glenn Hurowitz
Osama bin LadenThe U.S. military's killing of Osama bin Laden is a huge victory in the war against terror and on behalf of a safer, freer world.
But if this is to be the beginning of the end for al Qaeda and repressive governments everywhere, we have to make it our national mission not just to hunt down terrorist leaders, but also to wipe out the single greatest source of their money and power: oil.
From the beginning, Osama bin Laden's rise was made possible by oil money. He acquired the millions of dollars that allowed him to start and finance al Qaeda from his huge family construction business, which literally paved the way for Saudi Arabia's massive oil boom. Al Qaeda continues to receive tens of millions of dollars from oil-rich sympathizers in the Gulf. But they're hardly alone in feeding their brutality with oil.
Libya's Muammar Gadaffi is able to hang on against an intense NATO campaign largely because of the billions of dollars in oil money he's stockpiled to pay African mercenaries and buy off potential opponents. Iran's Mahmoud Ahmadinejad has financed Hezbollah and Hamas and poured billions into a nuclear weapons program with profits from Iran's huge oil deposits. Further down on the repression scale, Bahrain's royal family has imported Saudi troops to crush the country's democratic reform movement, while Vladimir Putin is able to resist calls for openness and economic innovation because of the flood of oil dollars entering his country.
In contrast, Tunisia and Egypt's relative lack of oil meant that their governments didn't have the same level of resources to maintain the support of loyalists or try to temporarily buy off their people.
Indeed, not only does oil finance terror and repression, it enables it. According to an extraordinary statistical analysis by UCLA political scientist Michael Ross, a country's "reliance on either oil or mineral exports tends to make it less democratic," and "this effect is not caused by other types of primary exports; ... it is not limited to the Arabian Peninsula, to the Middle East, or sub-Saharan Africa; and ... it is not limited to small states."
When demand surges and the price of oil rises, terrorist groups are better financed and repressive governments have more resources with which to repress their people and more ability to resist pressure to respect human rights and democratize. As Thomas Friedman describes in his seminal 2006 Foreign Policy article, "The First Law of Petropolitics" (written back when $60 a barrel was a "high" price for oi):
Think about the difference between Putin when oil was in the $20-$40 range and now, when it is $40-$60. When oil was $20-$40, we had what I would call "Putin I." President Bush said after their first meeting in 2001 that he had looked into Putin's "soul" and saw in there a man he could trust. If Bush looked into Putin's soul today -- Putin II, the Putin of $60 a barrel -- it would look very black down there, black as oil. He would see that Putin has used his oil windfall to swallow (nationalize) the huge Russian oil company, Gazprom, various newspapers and television stations, and all sorts of other Russian businesses and once independent institutions.
This means that when it comes to stopping al Qaeda, Hamas, and Hezbollah, or defunding repressive petro-state governments, Obama's next big national security question is of a very different sort than the one he made to send forces into Abbottabad, but at least as consequential: It's a decision whether to raise fuel-efficiency requirements for cars and trucks to 47 or 62 miles per gallon, as outlined in a recent EPA proposal.
Going with the more ambitious option would cut U.S. expenditures on oil by $100 billion over five years, meaning a lot less money going to foreign terrorist groups and petrocracies alike (and it would cut climate pollution by 450 million tons and save drivers $7,000 per year in gas). Of course, American car companies are trotting out the old canard that they're just not competent enough to deliver, while Toyota Vice President Jim Colon had this to say (h/t Roland Hwang of NRDC):
Whatever goal [the administration] establishes, Toyota will be prepared to meet. If it's 62 miles a gallon, we'll be able to achieve that.
In addition to the direct gains, the 62 mpg goal will likely spur even more technological innovation toward cars that don't rely on oil at all, spurring a global plunge in oil demand over the next decade or two. These disruptive technologies will upend the auto industry, but they'll be most disruptive to the terrorist groups and regimes that rely on a steady stream of oil money flowing from the United States. And all Americans can do our part in the war on terror by getting out of our cars altogether, and getting on a subway or bicycle instead. Indeed, you might say that terrorists and dictators should be even more afraid of Priuses and bikeshares than drone attacks.
So three cheers for the USA, and a few more for the world's safe, free, and democratic clean energy future.  
Glenn Hurowitz is a Senior Fellow at the Center for International Policy and you can follow his Twitter feed about forests, climate, and wildlife @glennhurowitz

Sunday, May 1, 2011

Hogne Jungner et al., Geogr. Ann. A, Phys. Geogr., (2011), Paleoclimatological evidence for unprecedented recent temperature rise at the the extratropical part of the Northern Hemisphere

Geografiska Annaler: Series A, Physical Geography, 93(1) (March 2011) 17-26; DOI: 10.1111/j.1468-0459.2011.00002.x

Paleoclimatological evidence for unprecedented recent temperature rise at the the extratropical part of the Northern Hemisphere

Hogne Jungner, Samuli Helama, Markus Lindholm and Markku Oinonen

Abstract


Eight, millennial-scale proxy reconstructions of temperature of the Northern Hemisphere were compared to instrumentally measured temperatures. The effect of anomalous reduction in sensitivity over the last decades (divergence) in the tree-ring based records was taken into account. Statistical analyses showed that in the extratropical part of the Northern Hemisphere the time period 1988–2008 was the warmest two decades within the last 1,000 years and had a probability of more than 0.70. The established exceptional level of current temperature changes over those areas that were the least disturbed by local anthropogenic impact indicates that over the last two decades the climatic system was perturbed by an additional global-scale forcing factor, which had not operated in the past.

Ogurtsov M.G., Jungner H., Helama S., Lindholm M., and Oinonen M., 2011. Paleoclimatological evidence for unprecedented recent temperature rise at the extratropical part of the Northern Hemisphere. Geografiska Annaler Series A, 93, 17–26.


http://onlinelibrary.wiley.com/doi/10.1111/j.1468-0459.2011.00002.x/abstract

Skeptical Science: "Frauenfeld, Knappenberger & Michaels (2011) – Obsolescence by Design? [Or how JGR's editor Sara Pryor let infamous fossil-fuel company lacky and serial liar before Congress, Patrick Michaels, slip in a paper with obsolete results from cherry-picked data that left out the biggest melt year for Greenland in recorded history – 2010!]

Frauenfeld, Knappenberger & Michaels (2011): Obsolescence by Design?

by Daniel Bailey, Skeptical Science, May 2, 2011

We know the planet is warming from surface temperature stations and satellites measuring the temperature of the Earth's surface and lower atmosphere. We also have various tools which have measured thewarming of the Earth's oceans. Satellites have measured an energy imbalance at the top of the Earth's atmosphere. Glaciers, sea ice and ice sheets are all receding. Sea levels are rising. Spring is arriving sooner each year. There's simply no doubt – the planet is warming.
And yes, the warming is continuing. The 2000s were hotter than the 1990s, which were hotter than the 1980s, which were hotter than the 1970s. In fact, the 12-month running average global temperature broke the record 3 times in 2010; according to NASA-GISS data (2010 is tied with 2005 for the hottest year on record for GISS and tied with 1998 using HadCRUT).  Sea levels are still rising, ice is still receding, spring is still coming earlier, there's still a planetary energy imbalance, etc., etc. Contrary to what some would like us to believe, the planet has not magically stopped warming.

Humans are causing this warming

There is overwhelming evidence that humans are the dominant cause of this warming, mainly due to our greenhouse gas emissions. Based on fundamental physics and math, we can quantify the amount of warming human activity is causing, and verify that we're responsible for essentially all of the global warming over the past 3 decades.  In fact we expect human greenhouse gas emissions to cause more warming than we've thus far seen, due to the thermal inertia of the oceans (the time it takes to heat them).  Human aerosol emissions are also offsetting a significant amount of the warming by causing global dimming.

The Original Frozen Tundra

In October 2010, The National Oceanic and Atmospheric Administration (NOAA) released the Arctic Report Card. The report contains a wealth of information about the state of climate in the Arctic Circle (mostly disturbing).  Especially noteworthy is the news that in 2010, Greenland temperatures were the hottest on record. It also experienced record setting ice loss by melting. This ice loss is reflected in the latest data from the GRACE satellites which measure the change in gravity around the Greenland ice sheet (H/T to Tenney Naumer from Climate Change: The Next Generation and Dr John Wahr for granting permission to repost the latest data). 
 
Figure 1. Greenland ice mass anomaly:  deviation from the average ice mass over the 2002–2010 period. Note: this does not mean the ice sheet was gaining ice before 2006 but that ice mass was above the 2002–2010 average.
Additionally, Tedesco and Fettweiss (2011) show that the mass loss experienced in southern Greenland in 2010 was the greatest in the past 20 years (Figure 2 below).

Tedesco

Figure 2. Greenland melting index anomaly (Tedesco & Fettweiss, 2011)
The figure above shows the standardized melting index anomaly for the period 1979–2010. In simple words, each bar tells us by how many standard deviations melting in a particular year was above the average. For example, a value of ~2 for 2010 means that melting was above the average by two times the ‘variability’ of the melting signal along the period of observation. Previous record was set in 2007, and a new one was set in 2010. Negative values mean that melting was below the average. Note that highest anomaly values (high melting) occurred over the last 12 years, with the 8 highest values within the period 1998–2010. The increasing melting trend over Greenland can be observed from the figure. Over the past 30 years, the area subject to melting in Greenland has been increasing at a rate of ~17,000 km²/year.
This is equivalent to adding a melt-region the size of Washington State every 10 years. Or, in alternative, this means that an area of the size of France melted in 2010 which was not melting in 1979.

Selective Science = Pseudo-Science

Into this established landscape comes a new paper which presents a selective Greenland melt reconstruction. During the review process the paper’s authors were urged to, yet chose not to, include the record-setting warm year 2010 temperatures. Had the authors considered all available data, their conclusion that ‘Greenland climate has not changed significantly’ would have been simply insupportable.
They write:  
“We find that the recent period of high-melt extent is similar in magnitude but, thus far, shorter in duration, than a period of high melt lasting from the early 1920s through the early 1960s. The greatest melt extent over the last 2 1/4 centuries occurred in 2007; however, this value is not statistically significantly different from the reconstructed melt extent during 20 other melt seasons, primarily during 1923–1961.”

Designed Obsolescence?

Their selective ‘findings’ were obsolete at the time the paper was submitted for publication in December 2010. In the review process, the authors and journal editors were made aware that important new data were available that would change the conclusions of the study. 
Unfortunately, the paper represents not only a failure of the review process, but an intentional exclusion of data that would, if included, undermine the paper’s thesis.
Dr. Jason Box has chosen to share for the record a timeline of important events associated with this article’s publication:
  • 26 August 2010: I was invited by Dr. Guosheng Liu, Associate Editor, Journal of Geophysical Research (JGR)–Atmospheres to review the article. Sara Pryor was the JGR chief editor ultimately responsible for this paper’s review.
  • 27 August 2010: I accepted the review assignment.
  • 22 September 2010: I submitted my review, in which I wrote: “The paper may already be obsolete without considering the extreme melting in 2010. I would therefore not recommend accepting the paper without a revision that included 2010.” I post my review posted verbatim here. At this time, I indicated to the editors that I did not wish to re-review the paper if the authors chose not to include 2010 temperatures. It was clear by this date, from the readily-available instrumental temperature records from the Danish Meteorological Institute and other sources such as US National Climate Data Center and NASA-GISS that the previous melt season months were exceptionally warm.
  • 16 October 2010: a NOAA press release publicized record-setting Greenland temperatures. The press release was linked to this Greenland climate of 2010 article, live beginning 21 October 2010.
  • 27 December 2010: I was invited to re-review the paper. I again stated that I did not wish to re-review the paper if the authors chose not to include 2010 temperatures. By this date, it was more clear that 2010 temperatures were exceptionally warm.
Another very important point: the excuse that the data was not available just is not reasonable given that both the Tedesco and Fettweiss (2011) and Mernild et al. (2011) papers each managed to reference this 2010 data in publications that came out prior to that of Frauenfeld, Knappenberger and Michaels.
Dr. Box:  
"The Editor’s decision whether or not to accept the paper would have been made sometime in early 2011. This paper should not have been accepted for publication without taking into account important new data."

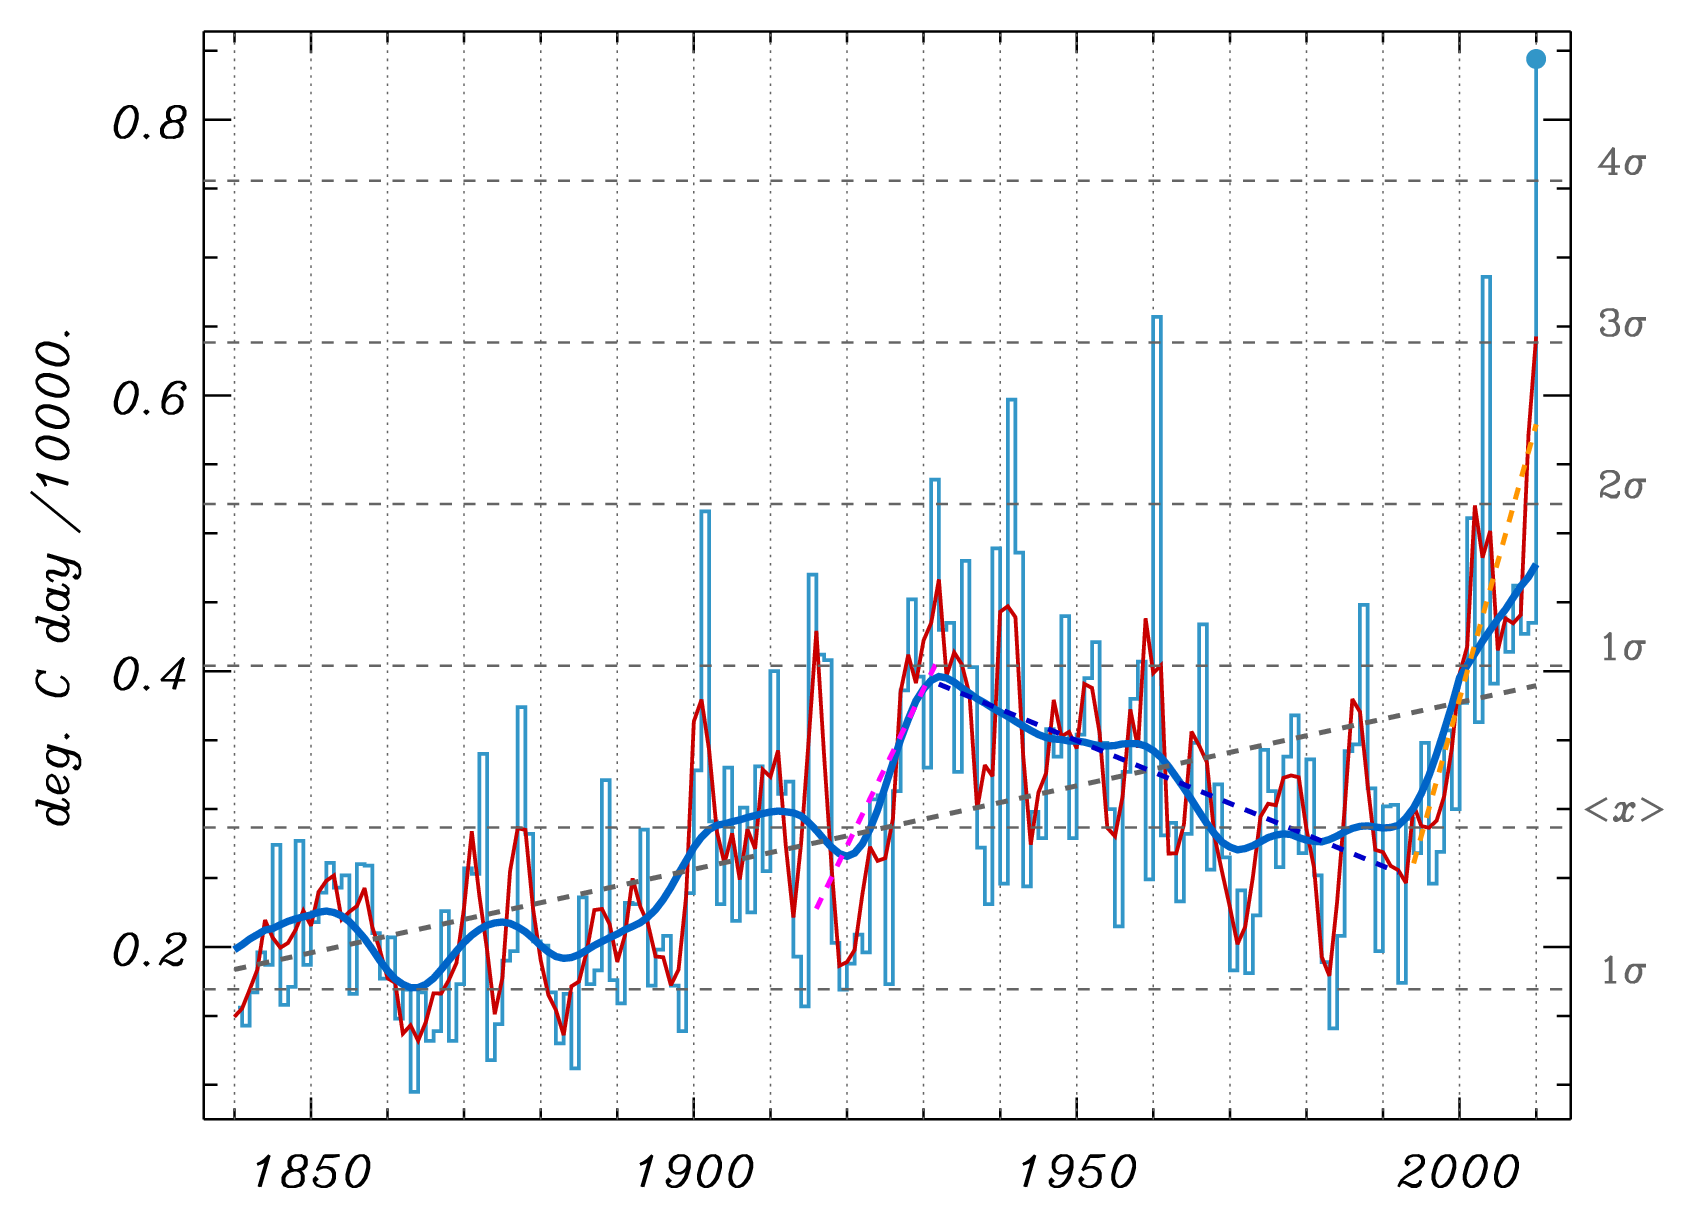
Figure 3.  Positive Degree Day reconstruction for the Greenland ice sheet after Box et al. (2009). The "regression changes" presented here are equal to the linear fit (dashed lines in the graphic) value at the end of the period minus the beginning of the period, for example, the 14-year change is the 2010 value minus the 1997 value. The blue Gaussian smoothing line is for a 29-year interval. The dark red smoothing line is for a 3-year interval.  PDDs are the sum of positive temperatures. A PDD sum of 10 has twice the melt potential as a PDD sum of 5. Note that not only is the recent melting convincingly distinguishable from that of the 20th century, but that summer and annual average temperatures in recent years are increasingly above values in the 1920s-1930s. (Courtesy Dr. Jason Box.)

Greenland’s past temperatures

Including year 2010 data reveals (as seen in Figure 5 at bottom), in contrast to the message of the Frauenfeld, Knappenberger and Michaels paper, that recent Greenland temperatures are warmer than at any time during the 20th century for the summer, autumn, and annual periods. The 1925–1935 spring season was warmer in 1930 than 2010, but not warm enough to make the corresponding annual average exceed that of the recent times.  Important for a melt reconstruction, what Frauenfeld, Knappenberger and Michaels neglected to include was that recent summer temperatures exceed those of any time during the past century.  As a result glaciers in southern Greenland have retreated far behind their meltlines from the early 20th century.  Evidence of this can be seen in Mittivakkat Glacier (Figure 4 below):
Mittivakkat Glacier
Figure 4. Mittivakkat Glacier in Southern Greenland.  Note the red line indicating the 1931 extent of the glacier relative to the yellow line depicting its position in 2010 (Mernild et al., 2011)
One thing to remember is that the regional warming that Greenland experienced in the early 20th century came at a time when the world overall was colder than it is today.  And that the warming then was a result of multiple forcings (in which GHG warming played a role) and is thus fundamentally different than the anthropogenic global warming of the most recent 30 years (in which GHG warming plays by far the predominant role).  Additionally, the global cryosphere (the parts of the world covered in ice) has experienced much greater warming (in terms of volume and global extent) in this the most recent period than in the time of supposedly similar warming (the early 20th century).
Given the thermal lags of oceans and ice, it is clear that Greenland has yet to fully respond to the warming forced upon it, so a reasonable approximation of another 1-2 °C is yet in its pipeline.  This will translate into yet greater mass losses to come, which evidence indicates may be experienced in a non-linear fashion.
2010Anomalyvs1923-1961
Figure 5. Where 2010 ranks relative to the warm period observed from 1923–1961 by Frauenfeld, Knappenberger and Michaels (Source).
Two lingering questions remain:
  1. Why did Frauenfeld, Knappenberger and Michaels not include year 2010 data when they were asked to and when the data were readily available, yet the other papers containing the 2010 data published before theirs did?
  2. Why did the journal publish this paper without the requested revisions?

Climate Warming is Real

Dr. Box:  
"Multiple lines of evidence indicate climate warming for which there is no credible dispute. No scientific body of national or international standing has maintained a dissenting opinion. I personally have found no credible science that disproves that human activity significantly influences climate.
An enormous and overwhelming body of science leads rational thinkers to the conclusion that humans influence climate in important ways. For decades, the science has indicated that human activity has become the single most influential climate forcing agent."
National and international science academies and scientific societies have assessed the current scientific opinion, in particular on recent global warming. These assessments have largely followed or endorsed the Intergovernmental Panel on Climate Change (IPCC) position of January 2001 which states:
An increasing body of observations gives a collective picture of a warming world and other changes in the climate system… There is new and stronger evidence that most of the warming observed over the last 50 years is attributable to human activities.

Acknowledgements

  • Dr. Jason Box, Assoc. Prof., Department of Geography, Byrd Polar Research Center, The Ohio State University, Columbus, Ohio, U.S.A., for his invaluable assistance, advice, knowledge and patience.
  • Dr. Mauri Pelto, Professor of Environmental Science, Science Program Chair; Director, North Cascade Glacier Climate Project, Nichols College, Dudley, MA, U.S.A., for his timely insights and suggestions
Without the expertise of these two fine climate scientists this article could not have come to pass.

Congress would rather give tax breaks to the wealthy and oil companies than to pay for the weather satellites needed to warn U.S. citizens of deadly storms and tornadoes


An aerial view of damaged homes in Alabama.
Buildings in Tuscaloosa, Alabama, lie in ruins on April 28, 2011, a day after a tornado demolished the city (via Reuters).
by Michael Conathan, Climate Progress, May 1, 2011

We reported in March that NOAA said GOP’s proposed satellite funding cuts could halve the accuracy of precipitation forecasts.  Michael Conathan, CAPAF’s Director of Ocean Programs, updates the story.

On Thursday, as the search for survivors continued in devastated communities across Alabama and other southern states pummeled this week by massive, terrifying tornadoes,  President Obama said “we can’t control when or where a terrible storm may strike, but we can control how we respond to it.” Unfortunately, thanks to the spending bill orchestrated by the GOP-controlled House of Representatives, he couldn’t say we are doing everything in our power to protect Americans from future extreme weather events. Events that are becoming ever more frequent, as CAP’s Daniel J. Weiss and Valeri Vasquez pointed out in a report and interactive map released Friday.

The Associated Press characterized the number of fatalities from these storms –more than 340 as of Saturday — as something that “seems out of a bygone era, before Doppler radar and pinpoint satellite forecasts were around to warn communities of severe weather.

Residents were told the tornadoes were coming up to 24 minutes ahead of time, but they were just too wide, too powerful and too locked onto populated areas to avoid a horrifying body count.”

It is precisely those “pinpoint satellite forecasts” that Congress, including every member of Alabama’s delegation, decided were luxuries America cannot afford when it passed the continuing resolution to keep the government operating for the remainder of the fiscal year.

As we have discussed in previous posts, this action eliminated funding to replace the environmental satellites that help make our forecasts a reality. The National Oceanic and Atmospheric Administration has stated in no uncertain terms that these aging satellites will fail, and our failure to buy new ones this year will cause at least an 18-month gap in coverage.

Clearly, Congressional Republicans were more interested in protecting the $5.5 billion in subsidies and foregone royalty payments for Big Oil—which collectively reported a total of more than $30 billion in first quarter profits this week—than they were in spending the $700 million necessary to literally save the lives of their constituents.

This week’s news stories about these disasters are full of harrowing accounts of narrow escapes made possible by timely, accurate forecasting that provided nearly half an hour’s advance warning that these massive tornadoes were on the way. And still, at least 340 people have been killed and countless others injured.

“It is sobering to us to see that tornadoes in the 21st century can still cause so many deaths,” said Joshua Wurman, the president of the Center for Severe Weather Research. “We had hoped that through increased warnings, better buildings and increased public awareness, the years of these events had passed.”

We now know that the events themselves have not passed—on the contrary, it is more likely that these events will only continue to grow more intense and more frequent. Apparently, the only thing that has passed is our willingness to pay the cost of the accurate predictions that saved innumerable lives across the south earlier this week.


http://climateprogress.org/2011/05/01/tornado-forecasting-saved-countless-lives-this-week-too-bad-congress-including-alabamas-entire-delegation-voted-against-maintaining-forecast-quality/

Climate Science Rapid Response Team asks Monckton for help with with inquiry from Abu Ali Al-Hussain of the Doric Foundation, Doha, Qatar

Climate Science Rapid Response Team Asks Monckton for Help


by Scott Mandia, "Climate Change: Man or Myth?" blog, May 1, 2011
The Climate Science Rapid Response Team is a match-making service to connect climate scientists with lawmakers and the media. The group is committed to providing rapid, high-quality information to media and government officials.  To use the service, requesters use the inquiry form to identify themselves, pose their question and provide a deadline for the response.  That information is then immediately sent to Dr. John Abraham, Dr. Ray Weymann, and me.  One of these three “matchmakers” then immediately forwards the inquiry to those scientists with the most appropriate expertise.  An authoritative response from one of the Climate Science Rapid Response Team scientists will be returned to the inquirer either directly or via one of the three matchmakers.  For more information about the Team and to read about a typical day when I am “on call” seeLisa Palmer’s story over at the Yale Forum on Climate Change & the Media.
John, Ray, and I occasionally receive “crank inquiries” from the Climate Science Rapid Response Team web site.  These emails are normally deleted.  On Friday April 29, 2011 we received an inquiry from Dr. Abu Ali-Hussain of the Doric Foundation, an organization claiming to be academic advisors to a group of Gulf States’ sovereign wealth funds.  A quick search revealed no such organization and the inquiry came from the UK.  The inquiry is strikingly like something that would have originated from the 3rd Viscount Christopher Monckton of Brenchley.  Instead of deleting the request, John, Ray, and I replied with the message below.  (The initial inquiry from Dr. Abu Ali-Hussain appears below our response.)
Esteemed Abu Ali Al-Hussain,
First of all, our heartiest congratulations on having reached your 1031st birthday.
Regarding your several inquiries about climate issues, these inquiries suggest a level of such profound mis-apprehension of fundamental statistical analysis and climate science, that, rather than send them to some of our qualified experts, we think it more appropriate to refer you to someone with an equally profound mis-apprehension of these same issues. Specifically, we suggest you contact 3rd Viscount Monckton of Brenchley.
Should you wish further material we refer you to the document “Climate Scientists Respond” where issues bearing a remarkable resemblance to the ones raised in your inquiry are dealt with at length.
Finally, if we may be so bold, would you be so kind as to intercede with your patrons at the Gulf States Sovereign Wealth funds to see if they would be willing to make a modest contribution of  1 billion $US to defray the cost of administering the CSRRT.
Your humble and obedient servants,
John Patrick Abraham
Scott A. Mandia
Ray J. Weymann
p.s. Please do not take offense, but in your next inquiry would you endeavor to be less prolix. The demands on our time are exceedingly great.

Name: Dr. Abu Ali Al-Hussain
Email: (censored)
Organization: Doric Foundation
Organization Description: Academic advisors to a group of Gulf States’ sovereign wealth funds
Response Needed By: Soonest
Enquiry: This inquiry is confidential and we must ask you not to use our name in any of your publicity. We are currently reviewing the state of climate science as presented by the Intergovernmental Panel on Climate Change. On pages 37, 104, and 253 of the Fourth Assessment Report (2007), the IPCC reproduces a graph of annual mean global surface temperature anomalies from the Hadley Center/Climatic Research Unit, overlaid by four linear-regression trend-lines starting respectively in approximately 1855, 1905, 1955 and 1980 and all ending in 2005. Our previous enquiries have established that the scientists’ final draft of the 2007 Fourth Assessment Report contained the same graph, but with only a single trend-line, from 1855-2005. Our principals are concerned that between the submission of the scientists’ final draft and publication of the official IPCC document the three additional – and, if our understanding is correct, gratuitous – trend-lines were added, without any statement to the effect that an alteration had been made, and that on each of the three pages where the graph thus altered was reproduced a conclusion was unjustifiably inserted to the effect that the rate of global warming is itself accelerating. Our enquiries have also established that the chairman of the IPCC has had this improper methodology and the consequently improper conclusion drawn to his attention, in person as well as in writing, but that he has failed to make any correction or to restore the graph as originally submitted by the scientists, or to explain why no such correction should be made. It appears to us that the IPCC’s conclusion that the rate of warming is accelerating, and that we are to blame, is central to the case being made in the IPCC’s 2007 Fourth Assessment Report. However, our principals are concerned that this conclusion is on three occasions stated on the basis of a graph which has been altered in a manner that constitutes an inappropriate statistical technique, raising questions about the reliability of the conclusion. As a heuristic, we have determined that careful selection of start-points for multiple trend-lines on a sufficiently short segment of the graph of a sine-wave, which we chose because its long-run trend is by definition zero, can suggest, falsely, either that the trend is rising at an accelerating rate or that it is falling at an accelerating rate. Our questions to you are as follows:
1. Are we correct in understanding that the graph as it appears on the three pages in question has indeed been altered from the form in which it was originally submitted?
2. If the graph was altered, by whom was it altered, and on whose order or authority?
3. If the graph was altered, what steps did the IPCC take to ensure that the alterations were peer-reviewed, and who, if anyone, peer-reviewed the graph in its altered form?
4. Are we justified in our understanding that the IPCC is incorrect in reaching its central conclusion on the basis of the relative slopes of the inserted trend-lines, and that the statistical technique upon which it seeks to rely in reaching that central conclusion is defective?
5. Irrespective of whether the IPCC used a correct statistical technique to reach its central conclusion, is that conclusion in fact correct? We have determined that the Central England Temperature Record, which our analysis of the data suggests is a respectable proxy for global temperature anomalies, inferentially because the stations are at a temperate latitude, showed a warming of approximately 2.2 K from 1695-1730, equivalent to a centennial rate of 6.5 K, an order of magnitude greater than the warming observed in the 20th century, and four times greater than the maximum supra-decadal rate of warming observed in the entire 161 years of the global instrumental record, which occurred from 1860-1880, 1910-1940, and 1976-2001, since when there has been no warming. On the face of things, it does not seem to us that a discernible human influence on the global temperature record is yet discernible. Are we right?
6. We have discovered that the scientists’ final draft of the 1995 Second Assessment Report of the IPCC contained five statements – which our own analysis of the data supports – to the effect that no discernible human influence on global temperature had yet been detected, and that it was not possible to say when such an influence would be detected. However, by the time of publication all five of these statements had been deleted and replaced with a single statement to the opposite effect. Which of the two positions is right, and why?
7. We have discovered that the scientists’ final draft of the 2007 Fourth Assessment Report was altered upon receipt by the IPCC with the insertion of a table of contributions to sea-level rise that did not sum to within a factor 2 of the correct total, and that the reason for the error was an order-of-magnitude overstatement by the IPCC of the contributions of the Greenland and Antarctic ice sheets to sea-level rise both since the 1960s and again since 1993. Our enquiries have established that the error was reported to the IPCC on the day of publication. On looking at the revised version of the 2007 Fourth Assessment Report we have verified that the table now sums correctly and that the four order-of-magnitude overstatements have been corrected, but we cannot find any acknowledgement or statement that the originally-published report has been thus altered. Are you able to point us to the relevant statement? Our principals are naturally concerned that alterations can be made n ot only to the scientists’ final drafts of the IPCC’s assessment reports but also to the published reports themselves without any explicit statement being placed on the record to the effect that the alterations have been made.
8. We note that all four of the IPCC’s assessment reports – 1990, 1995, 2001, and 2007 – are heavily based on and biased in favor of modeling as opposed to theory and observation. The IPCC has been making long-term predictions of future climate states on the basis of modeling: yet its 2001 Third Assessment Report says that the climate is a complex, non-linear, chaotic object, so that the prediction of future climate states is not possible. Our principals are concerned at this apparently serious contradiction. On reading Sir James Lighthill’s paper of 1998 on the chaoticity of a pendulum’s oscillation, and Edward Lorenz’s paper of 1963 on deterministic non-periodic flow, we conclude that there are indeed fundamental constraints on the modeling of a chaotic object such as the climate. Does the IPCC’s approach take these constraints sufficiently into account?
9. The First Assessment Report appears to predict – again on the basis of modeling – that global temperature would rise by 0.8 K in the 40 years 1990-2030, based on the assumption that a doubling of CO2 concentration would cause 2.5 K warming. Are we right in understanding that, so far, the warming rate has been <0.2 K in the 20 years since 1990, Implying that the IPCC’s original medium-term projection of future global temperature change may prove to have been excessive by a factor 2, even though the IPCC’s current central estimate is that the warming at CO2 doubling will be 3.3 K? 10. Please supply estimates of the radiative forcings from all anthropogenic influences in the 61 years since 1950, the first year in which, according to the IPCC’s 2001 report, reliable measurements of the climate-relevant species of greenhouse gases were available, and draw our attention to any clear statement in the IPCC’s 2007 Fourth Assessment Report of the appropriate interval for the 21st-century transient-climate-sensitivity parameter.
Thank you.
Abu Ali Al-Hussain Doric Foundation, Doha, Qatar