Blog Archive

Friday, January 8, 2010

AlterNet.org censors Buffalo Beast article on climate villains -- deletes Roger Pielke, Jr., under pressure from bogus think tank

Boy!  Industry-funded climate-change denial groups pack a powerful punch!

AlterNet.org has censored an article written by Mike Roddy and Ian Murphy, published in the Buffalo Beast!

http://www.alternet.org/environment/144990/the_14_most_heinous_climate_villains

The article as published in the Buffalo Beast was written about the top 15 most heinous climate villains (oops, AlterNet forgot to censor this line:

"If there’s anyone alive to write the history of corporate funded climate science denial, the following list of 15 Heinous Climate Villains will, by the sheer magnitude of death their lies wrought, make the infamous dictatorial monsters of the 20th century seem like incompetent children."

Now, why would AlterNet go and leave out the wonderful Roger Pielke, Jr., who is infamous for distorting climate science at every opportunity?

Was it pressure from the Breakthrough Institute (yet another so-called "think tank" whose sole purpose is to distort science and manipulate public opinion in favor of companies like Exxon-Mobil)?

You be be the judge!

Oh, and here is the part that was deleted from the original article  (see climate villain number 14):

http://www.buffalobeast.com/?p=1237


The BEAST 15 Most Heinous Climate Villains

Posted by admin on December 29, 2009

Some of the bastards responsible for subverting public understanding of climate change

BY MICHAEL RODDY & IAN MURPHY

THE SCIENCE OF CLIMATE CHANGE IS PRETTY BASIC: humans dig up fossilized carbon to fuel power plants and internal combustion machines, releasing CO2 into the atmosphere.  Result: greenhouse effect global heating. Around 50% of all the species on the planet are predicted to become extinct by 2100 in the CO2-as-usual model. Our own species will face drought, famine, rising tides, soaring temperatures, calamity and chaos. Hundreds of millions will become climate refugees. Billions may die from starvation, genocide and war. We have precious little time to mitigate this looming global catastrophe.

Those of us still denying the depressing facts are either tragically stupid or profoundly corrupt or both. If there’s anyone alive to write the history of corporate funded climate science denial, the following list of 15 Heinous Climate Villains will, by the sheer magnitude of death their lies wrought, make the infamous dictatorial monsters of the 20th century seem like incompetent children. Enjoy!

Don Blankenship1) Don Blankenship, CEO Massey Energy

Misdeeds: According to the EPA, Massey’s mountaintop removal coal operation is filthier than a Tiger Woods text. When a West Virginia Circuit Court fined the energy giant $50 million, it wasn’t a problem for Blankenship, because he owns the West Virginia Supreme Court. A few years earlier, he’d polluted the airwaves with $3 million in accusations that an incumbent State Supreme Court justice released sexual deviants, so that his man Brent Benjamin could be elected. The Massey-friendly court promptly heard the case and reversed the lower court’s ruling. A few months later, Blankenship was caught partying in Monte Carlo with two bimbos and Ted Maynard, another sympathetic justice. Last summer, Don held a nightmarish pro-coal rally on a leveled mountaintop with fellow retards Sean Hannity and Ted “Suck my machine gun, Obama” Nugent.


Corporate teat: Massey Energy is the fourth largest coal company in the US.

Most egregious lie: “The Greeniacs are taking over the world.”

Comeuppance: The Greeniacs do take over the world, and use Blankenship to fertilize a rooftop garden.

2) George Will, Columnist

Misdeeds: The errors Will has committed to print over the years are both more numerous and irresponsible than his bow tie collection, for which he also feels no remorse. He claimed in a February 2009 Washington Post column that “According to the University of Illinois’ Arctic Climate Research Center, global sea ice levels now equal those of 1979.” The Center responded: “We do not know where George Will is getting his information… global sea ice levels are 1.34 million sq. km less in February 2009 than in February 1979.”

Corporate teats: The Republican Party, a catchall for corporate polluters, his wife, rapacious swine in general, and anyone who cites Ronald Reagan to justify his massive carbon footprint.

Most egregious lie: “So the column accurately reported what the Center had reported.” Incredibly, the Post backed him up.

Comeuppance: Locked in a large freezer, strapped to a chair directly under a ten-foot icicle and made to write a column. The room’s climate is controlled by a computer program, which checks his column for scientific veracity. The temperature goes down when Will’s right and up when he’s wrong. He either freezes to death or the icicle falls and splits his head open. It’s up to him.

3) James Inhofe, Senator from Oklahoma

Misdeeds: Inhofe thinks that global warming is “the greatest hoax ever perpetrated on mankind,” yet somehow served as the Chairman of  the Senate Environment and Public Works Committee from ‘03 to ‘07. Once called Jurassic Park author Michael Crichton to testify as a key witness. Believes that “scientific consensus” on climate change is a conspiracy perpetrated by greedy scientists to score grant money.  Went to Copenhagen as the leader of the Climate Truth Squad, earning big laughs from overseas reporters.  Lifetime recipient of Twelve Dumbest Members of Congress award.

Corporate teats: Seven figures from Exxon Mobil, Chevron, Conoco Phillips and anyone willing to pay for his “campaign expenses.”

Most egregious lie: “You know, God’s still up there. We’re now going through a cooling spell.”

Comeuppance: Locked in an outhouse and set on fire.

Steve Milloy4) Steve Milloy, Fake Scientist

Misdeeds: Founder of the aptly named junkscience.com and featured “junk science expert” on Fox News, Milloy believes science favoring tobacco or oil companies is “sound science,” and the peer-reviewed stuff coming from nerds in lab coats is “junk science.” Steve holds a Bachelor of Arts and a law degree; you almost have to admire his chutzpah.

Corporate teats: Fox News, Competitive Enterprise Institute, Phillip Morris, Exxon Mobil and Monsanto.

Most egregious lie: “It’s time for sound science and common sense to be heard.”

Comeuppance: Forced to smoke 100 petroleum-dipped cigarettes by his mommy.

5) Fred Singer, University of Virginia

Misdeeds: For the last 60 years, Singer’s pimped his PhD credentials to any and every industry in need of phony science. He’s slithered seamlessly from denying that smoking causes cancer to saying that DDT is harmless to “raising questions about and undercutting the ‘prevailing scientific wisdom’” of climate change. Glacier data he later attributed to his wife was denounced as “complete bullshit” by the Glacier Monitoring Service.

Corporate teats: Exxon Mobil, Shell, Sun Oil, Competitive Enterprise Institute, American Petroleum Institute and the Heartland Institute.

Most egregious lie: “55% of glaciers have gained mass in the last 30 years.”

Comeuppance: While addressing yet another denier conference in 2012, the pressure created by an undetected tumor in Singer’s brain triggers an anomalous episode of schizophasia, causing his entire speech to spew forth as an incoherent word salad. Instead of the audience stopping Singer and urging him to seek the immediate medical attention he so obviously needs, they offer him a thunderous standing ovation and an invitation to speak again next year.

6) Myron Ebell,  Competitive Enterprise Institute

Misdeeds: As head of CEI, Myron admits using the money his organization solicited from the DDT, cigarette and coal industries to conduct intentionally biased research that suits their bullshit PR goals.

Corporate teats: Exxon Mobil, BP, Massey, Chevron and Southern.

Most egregious lie: “CO2 increases will lead to more plant growth and prosperity. Everyone will be more comfortable, including humans.”

Comeuppance: Forced to live in a Bedouin camp in the Arabian Desert to prepare for a warming world. The Chieftain assigns Ebell to be the wife of his favorite camel. The camel defiles him, kicks in his teeth, spits in his face and then seeks an annulment.

7) Patrick Michaels, Cato

Misdeeds: As a Senior Fellow at The Cato Institute and the Chief Editor of World Climate Report (an industry PR rag created by the evil coal trade group Western Fuels Association), Michaels is often touted as a climate expert in the mainstream media, though he has done no scientific research in 20 years. He lies about the wonders of “clean coal” so that the coal “families” can survive — you know, if black lung hasn’t killed them already.

Corporate teats: Cato, Western Fuels Association and the Kuwait Foundation for Advancement of Science.

Most egregious lie: “It has been known since 1872 that as we emit more and more carbon dioxide into our atmosphere, each increment results in less and less warming.” (He apparently forgot about feedback loops.)

Comeuppance: Admits on hidden camera that there is no such thing as “clean coal” when we secretly replace his maid’s cleaning supplies with coal; contracts black lung disease.

Sallie Baliunas8) Sallie Baliunas,  George C. Marshall Institute

Misdeeds: As an astrophysicist and ruthless GOP housewife lookalike, Baliunas lends both credibility and aesthetic reassurance to the denier movement. Claimed in a 2003 paper that “The Medieval Warming Period was hotter than today.” (Actually, it’s hotter today than it’s been for 130,000 years.) Her article in Climate Research was so riddled with errors, and so subverted the peer review process, the editor and half of the journal’s editorial board resigned. This led to celebrity status in the denier world, where if research is published that makes top scientists throw up, it must be accurate.

Corporate teats: George C. Marshall Institute, Exxon, Competitive Enterprise Institute, American Petroleum Institute and any far right group that needs a convention speaker who isn’t senile and doesn’t spit while talking.

Most egregious lie: “If scientists and researchers were coming out releasing reports that global warming has little to do with man, and more to do with just how the planet works, there wouldn’t be as much money to study it.”

Comeuppance: Made to “Wango Tango” with Ted Nugent for life.

9) Stephen McIntyre, Mathematician

Misdeeds: Despite having no training or field experience in climate science, McIntyre runs the blog ClimateAudit.org, whose mission is to use arcane statistical analyses to break the “hockey stick” reconstruction of historical climate patterns. He recently claimed victory over the Briffa tree ring data controversy, but failed to note that there are at least 15 studies that don’t need tree ring data to show the identical late 20th century hockey stick shape of rising temperatures and CO2 concentrations.

Corporate teats: McIntyre lives in tar sands besotted Canada as a “semiretired minerals consultant,” and served as President of Northwest Exploration Co Ltd before they became CGX Energy, Inc. His funding sources are hidden, since the Canadian government is legally somewhere between Texas and Saudi Arabia, and transparency is not required.

Most egregious lie: “I constructed a variation on the CRU data set, removing the 12 selected cores and replacing them with the 34 cores from the Schweingruber Yamal sample….”  The echo chamber goes wild, but neither they nor McIntyre himself have any idea what he’s talking about, since Climate Audit is all about masturbating to numbers. Even Briffa’s tree ring work was later vindicated by something McIntyre never considered: further scientific research.

Comeuppance: Sent to the Maldives, given cement shoes and used to mark the rising tide.

10) Marc Morano, Professional Douchebag

Misdeeds: Morano is possibly the most embarrassing wingnut in all of Denierdom—a dishonor earned as an Inhofe staffer and producer for the Rush Limbaugh Show. Reporting for Cybercast News Service, he was the first source of the Swift Boat Veterans for Truth lies about John Kerry in 2004 and John Murtha in 2006. It’s no surprise that his blog (climatedepot.com) is primarily a vehicle for lies, smears and character assassination aimed at credible climate scientists.

Corporate teats: Oil and coal companies, usually laundered through think tanks such as Cato, CEI, etc.

Most egregious lie: “We can’t afford action against climate change. It would damage our economy.”

Comeuppance: Sent to terraform Mars—without sufficient tools, food or oxygen.

11) Professor Roy Spencer, University of Alabama at Huntsville

Misdeeds: Professor Spencer is skeptical of widely accepted Paleoclimate data, like the kind provided by 800,000 year old ice cores, because he believes God created the earth and sculpted man out of clay approximately 6,000 years ago. Even you can do better, Alabama.

Corporate teats: Heartland Institute, George C. Marshall Institute, Republican Party, numerous lobbying
firms and NASA. (Really? This idiot works at NASA? We’re fucking doomed.)

Most egregious lie: Spencer coauthored a roundly debunked scientific paper with fellow denier John Christie that “proved” the troposphere (the lowest part of the atmosphere) was cooling, despite satellite data to the contrary. Spencer apologized for the error, but the incident added to his legendary status among deniers.

Comeuppance: The magical harp that Jesus gives him during the Rapture only plays “Wango Tango.”

Richard Lindzen12) Richard Lindzen, MIT

Misdeeds: The professor’s predilection for citing bad data to try to refute widely accepted climate science is a black eye for the state of Massachusetts and research institutes everywhere. Lindzen thinks global warming is basically a “political” issue, and yet has not provided compelling scientific evidence for his contrarian views. When not writing comedy for his peers or the Wall Street Journal, Lindzen plays keynote speaker for any loony tune denial fest that will have him. Claims that water vapor is the main cause of global warming.

Corporate teats: Heartland Institute, Cato Institute and the Annapolis Center, a think tank funded by ExxonMobil.

Most egregious lie: “Global warming has been merely a device for implementing broader agendas.”

Comeuppance: Locked in a very hot sauna with a running automobile.

13) Bjørn Lomborg, Economist

Misdeeds: A serial liar, whose books have spawned a cottage industry for scientists who debunk them, Lomborg reluctantly admits that the earth is getting hotter, but insists that we’ll like the warmer weather. He has opinions about many scientific issues, but is trained only in economics and game theory. His love of numbers and arguments does not extend to facts.

Corporate teats: Denier conference speaking fees, book sales and Lord Monckton knows what else.

Most egregious lie: “The Kangerlussuaq glacier is inconveniently growing.” (Actually, this glacier lost 55 billion tons of ice from 2000 to 2006 alone, and loses several gigatons of ice annually.)

Comeuppance: Dropped into the Sahara to do penance among climate refugees. Lomborg’s Danish skin can’t take the sun, so he’s buried entirely in sand, save for a mouth hole. Incoherent shit streams continuously from the hole, so the natives assume it’s a latrine.

14) Roger Pielke Jr., Political Scientist

Misdeeds: It’s telling that Pielke thinks his poli sci degree entitles him to have an opinion about all aspects of climate science. Specifically, it’s telling us that he thinks we’re idiots. Pielke constantly parrots fallacious claims about ice, ocean temperature and warming rates from whacked out websites like wattsupwiththat.com. Roger has been dubbed the Most Debunked Science Writer in the Blogosphere by Climate Progress, yet still appears in the media as a contrarian “expert.”

Corporate teat: The Breakthrough Institute, whose founders, like Fox News, stress “balance.”

Most egregious lie: “In the ongoing battle between climate scientists and skeptics, there will be disproportionate carnage, because the climate scientists have so much more to lose.”

Comeuppance: Having been denied access to a newly-green Siberia by the Russian Army, vultures circle Pielke as he roams aimlessly in search of food and water. Hyenas, an invasive species from drought stricken Africa, track his every move in anticipation. Too weak to continue, he collapses. As the scavengers close in, Pielke finally realizes the irony of the above quote and cries, “I get it now!” The hyenas laugh and rip him to shreds.

Lord Monckton15) Lord Christopher Monckton, Viscount of Brenchley

Misdeeds: Admired by Glenn Beck. His Lordship’s hysterical condescension and anger flashes are classic examples of dangerous Royal inbreeding. Can be found at all the big denier fests, including Blankenship’s nightmarish blasted mountaintop jamboree. Habitually confabulates his autobiography and fabricates scientific facts. Monckton recently called a gathering of activists in Copenhagen “Hitler Youth.”

Corporate teats: Heartland Institute, SPPI and Frontiers of Freedom—all recipients of oil money.

Most egregious lie: “The right response to the non-problem of global warming is to have the courage to do nothing.”

Comeuppance: Climate refugees storm his castle in 2030 and pillage everything but Monckton’s prized medieval pear of anguish, which he cleverly hides up his own ass. Unable to remove the excruciating device by himself, The Lord checks into the hospital. The doctors are brave enough to do nothing.
——————————————————————————————–
CORRECTIONS: This article previously read that Stephen McIntyre lives in Alberta, and that the earth is hotter now than it has been for 400,000 years. McIntyre actually lives in Ontario, and the earth is hotter now than it has been for 130,000 years — give or take.

Michael Roddy graduated with honors from Berkeley, and has written numerous magazine articles and Congressional testimonies on environmental and construction issues. He currently owns and operates a small hotel energy management company, with offices in Seattle, Napa, and Yucca Valley, California. Mike can be reached at mike.greenframe@gmail.com.

Thursday, January 7, 2010

D. R. Roberts et al., J. Quart. Sci., Ice stream influence on West Greenland Ice Sheet dynamics during the Last Glacial Maximum

Journal of Quarternary Science,published online 29 December 2009; DOI: 10.1002/jqs.1354

Ice stream influence on West Greenland Ice Sheet dynamics during the Last Glacial Maximum

David H. Roberts*, Antony J. Long, Bethan J. Davies (Department of Geography, Durham University, Durham, U.K.), Matthew J. R. Simpson (Department of Earth Sciences, Durham University, Durham, U.K.) and Christoph Schnabel (NERC Cosmogenic Isotope Analysis Facility, Scottish Enterprise Technology Park, East Kilbride, U.K.)

Received 22 April 2009; revised: 28 September 2009; accepted: 30 September 2009.

Abstract

This paper investigates the processes governing bedrock bedform evolution in ice sheet and ice stream areas in central West Greenland, and explores the evidence for a cross-shelf ice stream at the Last Glacial Maximum (LGM). To the east of Sisimiut the formation of streamlined bedforms with high elongation ratios and high bedform density has been controlled by geological structure and topography in slow-flowing ice sheet areas. At the coast, the effects of regional flow convergence, caused by coastal fjord orientation, routed ice into the Sisimiut/Itilleq area where it formed an ice stream onset zone. This funnelled ice into an offshore trough (Holsteinsborg Dyb), resulting in a southwesterly regional ice flow direction and the formation of a topographically routed ice stream (Holsteinsborg Isbrae). To the south of this, striae and bedform evidence show that local valley glaciers initially flowed east to west across the coast, but were later redirected by the Itilleq Fjord ice which turned southwestward due to diffluent flow and deflection by Holsteinsborg Isbrae. Roches moutonnées in this area have low elongation ratios and high bedform density, but do not provide unequivocal support for ice streaming, as they are a product of both bedrock structure and changes in ice flow direction, rather than enhanced flow velocities. Cosmogenic surface exposure ages limit maximum ice sheet surface elevation to ca. 755-810 m above sea level in this region. Such ice thickness enabled Holsteinsborg Isbrae to reach the mid/outer continental shelf during the LGM, and to contribute to the formation of a trough mouth fan and the Outer Hellefisk moraines. Initial deglaciation across this region was driven by rising sea level and increasing air temperatures prior to the Bølling Interstadial at ca. 14.5 cal. ka BP. Between 12 and 10 cal. ka BP both increased air and ocean temperatures post the Younger Dryas, and peak sea-level rise up to the marine limit, caused accelerated thinning and marginal retreat through calving, although dating evidence suggests ice streams remained along the inner shelf/coast boundary until at least ca. 10 cal. ka BP, their longevity maintained by increased ice thickness and ice discharge.

*Correspondence to David H. Roberts, Department of Geography, Durham University, Science Laboratories, South Road, Durham DH1 3LE, U.K. e-mail: d.h.roberts@durham.ac.uk

Link to abstract:  http://www3.interscience.wiley.com/journal/123224385/abstract

Arctic Oscillation Index, Surface Temperature Anomalies, Polar Vortex, Chris Mooney's "Water World"

Dear Readers,

Here is a link to an animation of the past 30 days' surface temperature anomalies (note the red color over Greenland):


http://www.esrl.noaa.gov/psd/map/images/fnl/sfctmpmer_01a_30frames.fnl.anim.html


Here is a link to NASA's Earth Observatory of how hot air was belched out into the stratosphere over the North Pole in February 2009 (the 7-Mb animation takes a very long time to load, but I guarantee you it is worth the wait and is scary to watch).


Link to NASA article:


http://earthobservatory.nasa.gov/IOTD/view.php?id=36972


Link to QuickTime animation (by way of explanation, please note that the image on the right shows temperatures at an altitude of about 30 kilometers. The temperatures begin at a low of negative 88 degrees centigrade (-88 °C).  As the heat is belched through the polar vortex, splitting it in two, temperatures rise to a positive 12 degrees centigrade (+12 °C) . Note also that the heat is coming from the southern latitudes just north of the equator.):


http://earthobservatory.nasa.gov/images/imagerecords/36000/36972/npole_gmao_200901-02.mov


Here is a link to NOAA's National Weather Service's Climate Predition Center's daily graph of the Arctic Oscillation Index:


http://www.cpc.noaa.gov/products/precip/CWlink/daily_ao_index/ao_index.html


Graph as of January 6, 2009:


Observed Daily Arctic Oscillation Index.


And, just for fun, boys and girls, a link to the Western Hemisphere and (some of the Eastern) water vapor streams over the past 24 hours:


http://cimss.ssec.wisc.edu/tropic/real-time/mosaic/movies/moswwvbbm/moswwvbbmjava.html


And, a quote from Chris Mooney's book "Storm World" (page 57) that Susan A. was so kind to send to me:


"The 'most important and obvious' positive feedback identified in the Charney report involved atmospheric water vapor. Due to a physical law known as the Clausius-Clapeyron equation, the amount of moisture that can be carried by the air increases along a steeply sloping curve as temperature rises."


Emphasis and underlining are mine.

BBC: Igor Semiletov --Methane release from the East Siberian Shelf is underway and it looks stronger than it was supposed [to be]

Methane release 'looks stronger'

by Michael Fitzpatrick, Science reporter, BBC News, January 6, 2010

Bubbles of methane ice (SPL)
Frozen depositories are giving up methane to the sea
Scientists have uncovered what appears to be a further dramatic increase in the leakage of methane gas that is seeping from the Arctic seabed.

Methane is about 20 times more potent than CO2 in trapping solar heat.
The findings come from measurements of carbon fluxes around the north of Russia, led by Igor Semiletov from the University of Alaska at Fairbanks.

"Methane release from the East Siberian Shelf is underway and it looks stronger than it was supposed [to be]," he said.

Professor Semiletov has been studying methane seepage in the region for the last few decades, and leads the International Siberian Shelf Study (ISSS), which has launched multiple expeditions to the Arctic Ocean.
The preliminary findings of ISSS 2009 are now being prepared for publication, he told BBC News.

Methane seepage recorded last summer was already the highest ever measured in the Arctic Ocean.

High seepage
Acting as a giant frozen depository of carbon such as CO2 and methane (often stored as compacted solid gas hydrates), Siberia's shallow shelf areas are increasingly subjected to warming and are now giving up greater amounts of methane to the sea and to the atmosphere than recorded in the past.

METHANE HYDRATES
Methane gas is trapped inside a crystal structure of water-ice
The gas is released when the ice melts, normally at 0 °C
At higher pressure, ie under the ocean, hydrates are stable at higher temperatures
This undersea permafrost was until recently considered to be stable.
But now scientists think the release of such a powerful greenhouse gas may accelerate global warming.

Higher concentrations of atmospheric methane are contributing to global temperature rise; this in turn is projected to cause further permafrost melting and the release of yet more methane in a feedback loop.

A worst-case scenario is one where the feedback passes a tipping point and billions of tonnes of methane are released suddenly, as has occurred at least once in the Earth's past.

Such sudden releases have been linked to rapid increases in global temperatures and could have been a factor in the mass extinction of species.

According to a report by the US National Oceanic and Atmospheric Administration (NOAA), the springtime air temperature across the region in the period 2000-2007 was an average of 4 °C higher than during 1970-1999.

That is the fastest temperature rise on the planet, claims the university.

The recent thaw over the last decade means that some of the large reserve of carbon from organic material such as dead animals and plants in sediments is now being released into the sea and into our atmosphere.
Trapped below that is the methane hydrate now warming and leaking through holes in the defrosting sediments.
Infographic (BBC)
1. Methane hydrate is stable at high pressure and low temperature
2. Nearer the surface, where water pressure is lower, hydrates break down earlier than at greater depth as temperatures rise
3. Gas rises from the sea-bed in plumes of bubbles - some of it dissolves before it reaches the surface
4. The ISSS team says it has detected methane breaking the ocean surface

Previously it was thought much of this gas was absorbed into the sea.

But according to a recent report that Professor Semiletov and his team compiled for the environmental group WWF, the shallow depth of arctic shelves means that methane is reaching the atmosphere without reacting to become CO2 dissolved in the ocean.

Professor Semiletov's fellow researcher aboard the Russian icebreaker that carries the ISSS team each year is Professor Orjan Gustafsson from Stockholm University in Sweden.

He said that methane measured in the atmosphere around the region is 100 times higher than normal background levels, and in some cases 1,000 times higher.

'No alarm'     [Readers, if you believe this, I got a couple of bridges to sell to you.]


Despite the high readings, Professor Gustafsson said that so far there was no cause for alarm, and stressed
that further studies were still necessary to determine the exact cause of the methane seepage.

"It is important now to understand how fast it is being released and how much is being released," he said.
However, there is a real fear that global warming may cause Siberia's subsea permafrost to thaw.

Some estimates put the amount of carbon trapped in shelf permafrost at 1,600 billion tonnes -- roughly twice as much carbon as in the atmosphere now.

The release of this once captive carbon from destabilised ocean sediments and permafrost would have catastrophic effect on our climate and life on Earth, warn the scientists.

Link:  http://news.bbc.co.uk/2/hi/science/nature/8437703.stm

Joseph Romm: Where on Earth is it unusually warm? Greenland and the Arctic Ocean, which is full of rotten ice


Where on Earth is it unusually warm? Greenland and the Arctic Ocean, which is full of rotten ice


New study supports finding that "the amount of [multi-year] sea ice in the northern hemisphere was the lowest on record in 2009"

by Joseph Romm, Climate Progress, January 6, 2010 Arctic warmth
Map of air temperature anomalies for December 2009, at roughly 3,000 feet above surface, Areas in orange and red are warm anomalies, areas in blue and purple are cool.
It’s cold here and in northern Eurasia, but it’s been positively toasty ar0und the Arctic circle — thanks to an extreme negative phase of the Arctic Oscillation, as the National Snow and Ice Data Center (NSIDC) explained in their online report yesterday.
The temperatures reported by NSIDC show some Arctic anomalies exceeding 7°C (13°F)!  That’s not good news for the kind of re-freezing one wants to see in the otherwise rapidly melting Greenland ice sheet (see Nature: “Dynamic thinning of Greenland and Antarctic ice-sheet ocean margins is more sensitive, pervasive, enduring and important than previously realized”).  It’s also one reason “December 2009 had the fourth-lowest average ice extent for the month since the beginning of satellite records, falling just above the extent for 2007. The linear rate of decline for December is now 3.3% per decade.”
Significantly, a new study, “Perennial pack ice in the southern Beaufort Sea was not as it appeared in the summer of 2009” by Barber et al. finds that all the crowing by the anti-science crowd about the supposed “recovery” of Arctic sea ice was quite premature:

In September 2009 we observed a much different sea icescape in the Southern Beaufort Sea than anticipated, based on remotely sensed products. Radarsat derived ice charts predicted 7 to 9 tenths multi-year (MY) or thick first-year (FY) sea ice throughout most of the Southern Beaufort Sea in the deep water of the Canada Basin. In situ observations found heavily decayed, very small remnant MY and FY floes interspersed with new ice between floes, in melt ponds, thaw holes and growing over negative freeboard older ice. This icescape contained approximately 25% open water, predominantly distributed in between floes or in thaw holes connected to the ocean below. Although this rotten ice regime was quite different that the expected MY regime in terms of ice volume and strength, their near-surface physical properties were found to be sufficiently alike that their radiometric and scattering characteristics were almost identical.
Yes, satellite (and other) measurements of Arctic sea ice extent were apparently deceived.   You might even say that an unfortunate trick of Nature helped hide the decline of Arctic ice:
This case of mistaken identity is physically explained by the factors which contribute to the return to Radarsat-1 from the two surfaces; both ice regimes had similar temperature and salinity profiles in the near-surface volume, both ice types existed with a similar amount of open water between and within the floes, and finally both ice regimes were overlain by similar, recently formed new sea ice in areas of negative freeboard and in open water areas. The fact that these two very different ice regimes could not be differentiated using Radarsat-1 data or in situ C-band scatterometer or microwave radiometer measurements, has significant implications for climate studies and for marine vessel navigation in the Canada Basin.
I had blogged on Barber’s work when it was first reported by Reuters in November (see “Arctic ice reaches historic seasonal low; “We are almost out of multiyear sea ice in the northern hemisphere”):
The multiyear ice covering the Arctic Ocean has effectively vanished….
“I would argue that, from a practical perspective, we almost have a seasonally ice-free Arctic now, because multiyear sea ice is the barrier to the use and development of the Arctic,” said Barber [Canada's Research Chair in Arctic System Science at the University of Manitoba].
Barber and his team thought they’d find “a huge multiyear ice pack that should have been in the Beaufort Sea” but
Instead, his ice breaker found hundreds of miles of what he called “rotten ice” — 50-cm (20-inch) thin layers of fresh ice covering small chunks of older ice.
“I’ve never seen anything like this in my 30 years of working in the high Arctic … it was very dramatic,” he said.
And now we have the Geophysical Research Letters paper by Barber et al., which concludes:
Our results are consistent with ice age estimates (Fowler and Maslanik, http://nsidc.org/news/press/20091005_minimumpr.html) that show the amount of MY sea ice in the northern hemisphere was the lowest on record in 2009 suggesting that MY sea ice continues to diminish rapidly in the Canada Basin even though 2009 areal extent increased over that of 2007 and 2008.
This study suggests that the Arctic continues to lose area — and, more importantly, volume — at a much more rapid pace than any major climate models had suggested.  I’ll end with this figure of mean monthly Ice Volume for the Arctic Ocean from a release by several scientific institutions:
Arctic Volume
I still like my odds on a 90% ice free Arctic by 2020 (see “Another big climate bet — Of Ice and Men“).  By then, I assume they’ll have figured out how to deal with Nature’s sea-ice-decline-hiding trick — or there will simply be too little ice for anybody to be fooled.
For more, see “Looking for Above Normal Temperatures? They are in the Arctic.
Related Posts:
Link: http://climateprogress.org/2010/01/06/science-nsidc-warm-greenland-arctic-rotten-ice-multi-year-arctic-oscillation/

Wednesday, January 6, 2010

Richard Black of the BBC: Arctic roots of 'upside-down' weather (on the unusually extremely negative Arctic Oscillation)

Arctic roots of 'upside-down' weather

Richard Black | 14:01 UK time, BBC News, Tuesday, 5 January 2010
Tartan_modelled_in_snowIt's cold in Kirkcaldy, freezing in Frankfurt and brass monkeys in Bryn Mawr... a winter spell with weather that's unusually -- well -- wintry.

But not everywhere; in fact, other places in the Northern Hemisphere are seeing weather that's unseasonably warm.

In Goose Bay in Newfoundland, it's barely getting below 0 °C -- bikini weather, relatively speaking, given that the average minimum for January is -23 °C.

The cause of what one weather service refers to as these "upside down" conditions is an extreme of the Arctic Oscillation (AO).

Essentially, air pressure is measured at various places across the Arctic and at the middle latitudes of the Northern Hemisphere -- about 45°N, roughly the latitude of Milan, Montreal or Vladivostok.

The difference between the average readings for the two latitudes gives the state of the Arctic Oscillation index.

A "positive" state is defined as relatively high pressure in mid-latitudes and relatively low pressure over the polar region. "Negative" conditions are the reverse.

And what we have at the moment is an unusually extreme negative state.

The graph below comes from the US government's Climate Prediction Center and shows the variability of the index from 1950 to 2009.
Arctic_Oscillation_indexThe text on the graph is a little unclear as I've had to shrink it a bit, but you can see at the bottom right the current negative conditions developing during December -- and here's the original.

Over at the New York Times, they've compiled a different graph that shows how extreme these few weeks are turning out to be -- unmatched since the early 1960s, a period that saw several winters in the UK featuring extended spells of cold, snowy weather.

What the negative AO conditions mean is that cold air spills out of the Arctic down to mid-latitudes, which this time round includes much of Europe, tracts of the US and China.

For the UK, this implies a higher chance of cold northerly or easterly winds.

But if you live in places that are usually cold at this time of year -- such as Goose Bay -- you'll see a concomitant rise in temperatures compared with what happens during "positive" AO conditions, when the cold air is confined to more northerly latitudes.

Ball_game_played_in_snow_in_ChinaA little more than a decade ago, I visited Yakutsk in Siberia which lies close to one of the candidates for the title of "coldest place on the planet" -- the village of Oymyakon, which has seen the mercury plummet as low as -71 °C.

I don't know how balmy it is in Oymyakon right now but in Yakutsk itself, the daily minimum is a mere -35 °C -- that's 10 °C warmer than the January average.

Despite the name "Arctic Oscillation," there's little discernible pattern to how the pressure difference varies, or what causes it -- perhaps "Arctic Random Fluctuation" would be a better name.

Some researchers have linked an apparent increase in the average state of the index from the 1960s to the 1990s to man-made global warming, but you would have to say the jury is definitely still out.
 
(The AO is linked to another naturally varying phenomenon, by the way -- the North Atlantic Oscillation (NAO), the variability in the pressure difference between Iceland and the Azores - in fact, some hold that the NAO is just a sub-set of the AO.)

So the question of how long the unusually wintry UK conditions will last is really a question of how long the Arctic Oscillation will remain in its extreme negative state -- and a week to 10 days seems to be the favoured timescale.

Link:  http://www.bbc.co.uk/blogs/thereporters/richardblack/2010/01/arctic_conditions_arctic_cause.html

Monday, January 4, 2010

D. C. Verdon-Kidd & A. S. Kiem, GRL, 36 (2009), Nature and causes of protracted droughts in southeast Australia: Comparison between the Federation, WWII, and Big Dry droughts

Geophysical Research Letters, 36 (2009) L22707; doi: 10.1029/2009GL041067. 

Nature and causes of protracted droughts in southeast Australia: Comparison between the Federation, WWII, and Big Dry droughts

Danielle C. Verdon-Kidd and Anthony S. Kiem (School of Environmental and Life Sciences, University of Newcastle, Callaghan, New South Wales, Australia)

Abstract


Three protracted droughts have occurred during the instrumental history of Southeast Australia (SEA) – the “Federation” (∼1895–1902), “World War II” (∼1937–1945) and the “Big Dry” (∼1997–present). This paper compares the nature and causes of these droughts in order to better inform drought management strategies in SEA. It is shown that the three droughts differ in terms of severity, spatial footprint, seasonality and seasonal rainfall make-up. This diversity arises due to the fact that the droughts are driven by different climatic teleconnections with the Pacific, Indian and Southern Oceans. Importantly, this study highlights potential flaws with drought forecasting and management in SEA and emphasises the need for further research into understanding and representing hydroclimatic drivers of drought.

Received 22 September 2009; accepted 30 October 2009; published 26 November 2009.

Citation: Verdon-Kidd, D. C., & Kiem, A. S. (2009), Nature and causes of protracted droughts in southeast Australia: Comparison between the Federation, WWII, and Big Dry droughts, Geophys. Res. Lett., 36, L22707; doi: 10.1029/2009GL041067.

Ummenhofer et al., What causes Southeast Australia’s worst droughts?

What causes Southeast Australia’s worst droughts?

Clarification of results of GRL paper Ummenhofer et al. (2009).

Geophysical Research Letters, 36, L04706; doi: 10.1029/2008GL036801

The implications of our work (Ummenhofer et al., 2009) have been misunderstood in some media commentary, with some reporters asserting we have discovered that south-eastern Australia’s recent “Big Dry” is not related to climate change. This is not correct.

Our research investigates iconic droughts of the 20th Century for southeastern Australia, including the Federation Drought (1895-1902) and World War II Drought (1937-1945), as well as the recent “Big Dry.” The research shifts the focus from Pacific Ocean to Indian Ocean variability, in particular the absence of negative Indian Ocean Dipole (IOD) events. Specifically, our results show that extended multi-year droughts in the Victorian region are associated with a lack of negative IOD events (see Figure 1, reproduced from Ummenhofer et al., 2009).

Negative IOD events consistently result in very wet conditions in the south-east. The prolonged absence of a negative IOD deprives the region of its normal rainfall quota. Without the occurrence of these wet negative IOD years, the south-east only experiences dry or average years for a decade or more. This is conducive to drought. When taken in the context of other historic droughts over the past 120 years, the “Big Dry” is still
exceptional in its severity. The last negative IOD event occurred in 1992. This is the longest period on record over the past 120 years without a single negative IOD event. Furthermore, the severity of the “Big Dry” has been exacerbated by recent warmer air temperatures over the past few decades (Figure 1). Warmer air temperatures lead to increased evaporation, which further reduces soil moisture and worsens the drought.

While this work does not explicitly focus on the link between changing IOD frequency and recent regional and global warming, it does send a stark message: in a warmer world, the severity of droughts would likely become far worse.

In short, our paper does not discount climate change as playing a role in this most recent drought, the “Big Dry”. In fact, there are indications that climate change has worsened this recent drought.

Refer to Abram et al. (2008), Cai et al. (2009) and Nicholls (2004) who investigate changes in IOD frequency and south-eastern Australian drought due to climate change.

Abram, N. et al. (2008) Recent intensification of tropical climate variability in the Indian Ocean, Nature Geoscience, 1, 849; doi: 10.1038/ngeo357.
Cai, W., et al. (2009). Recent unprecedented skewness towards positive Indian Ocean Dipole occurrences and their impact on Australian rainfall, Geophys. Res. Lett., doi:10.1029/2009GL037604, in press.
Nicholls, N. (2004). The changing nature of Australian droughts, Clim. Change, 63, 323-336.


Fig. 1. (Readers, please go to the link to the pdf file to view the figure -- I am unable to copy figures from pdf files:  http://www.ccrc.unsw.edu.au/PDF/Ummenhofer.etal_2009_GRL_clarification.pdf  Historical record of IOD and ENSO years and mean climatic conditions over southeast Australia. (a) Years of positive/negative IOD (red) and El Niño/La Niña (blue) years. Timeseries of anomalous (b) precipitation (mm/month), with 5-year running mean superimposed in red (c) 5-yr running mean of temperature (°C), with a 15-year running mean superimposed in green, and (d) 5-yr running mean of Palmer Drought Severity Index (PDSI) over southeastern Australia during June-October. The grey shaded bars highlight periods of below average precipitation when the 5-year running mean falls below one standard deviation. The duration of three major droughts has been indicated in (d) with horizontal black bars (taken from Ummenhofer et al., 2009).

Friday, January 1, 2010

Joseph Romm: Ken Levenson reports a mugging - New York Times has started the year with a true piece of anti-scientific crap masquerading as clever pop commentary

The NY Times starts 2010 pushing the same damn disinformation about climate science it did in 2009

by Joseph Romm, Climate Progress, January 1, 2010

A few people were critical of me for putting the NY Times third on the list of the 2009 “Citizen Kane” awards for non-excellence in climate journalism.

But now the NYT has started the year with a true piece of anti-scientific crap masquerading as clever pop commentary, “It’s Always the End of the World as We Know It,” by Denis Dutton, a man Wikipedia — but not the NY Times — explains is a “libertarian media commentator/activist.”

For the record, the science is quite clear that unrestricted greenhouse gas emissions are projected to lead to the end of the world as we know it, including “towering seas, storms, droughts and mass extinctions” — as this literature review makes clear.  It’s no surprise that a libertarian professor of philosophy would write an anti-science screed.  But what is the NYT’s excuse for publishing it?

Indeed, it was the NYT, not Dutton, which came up with the graphic above that lumps “Global warming” with “Evil Aliens” and “Nostradamus.”  Seriously.

Long-time CP commenter has saved me the trouble of a longer response on this New Year’s Day, with a letter to the editor he posted here:

To the Editor:
I want to report a mugging. I thought I was enjoying a quiet and safe New Years at home.
Re “It’s Always the End of the World as We Know It” (opinion article, Jan 1).
http://www.nytimes.com/ 2010/ 01/ 01/ opinion/ 01dutton.html?ref=opinion
Mr. Dutton, provided an entertaining and benign exposition on human fascination with Apocalypse and it’s counterproductive nature, speaking of Y2K, religion, UFO cults and “Frankenstein” – noting: “Such end-time fantasies must have a profound, persistent appeal in order to keep drawing wide-eyed crowds into movie theaters, as historically they have drawn crowds into churches, year after year.” Mr. Dutton’s theme is clear. And having read 90% of his 1,332 word article, never once encountering climate change, Mr. Dutton decides to pivot, and magically concludes in 77 words:

“This applies, in my view, to the towering seas, storms, droughts and mass extinctions of popular climate catastrophism. Such entertaining visions owe less to scientific climatology than to eschatology, and that familiar sense that modernity and its wasteful comforts are bringing us closer to a biblical day of judgment. As that headline put it for Y2K, predictions of the end of the world are often intertwined with condemnations of human “folly, greed and denial.” Repent and recycle!”

Suddenly I was no longer reading at my dining table but felt as if standing in Times Square, just conned by a Three Card Monte street hustler – and the hopes for the New Year were just sucked out of the room. I sit, mugged by the New York Times.

Yes, I realize Mr. Dutton has written an opinion piece and that he is a “controversial” libertarian figure – although the paper’s one line bio gives no hint. However, The New York Times must realize that this opinion piece does great damage to the public understanding of climate change.
Mr. Dutton does more damage than just executing an “elegent” con on The New York Times and its readership in presenting what amounts to little more than a one sided political screed masquerading as observations of the human pyche. Mr. Dutton presents the BIG LIE.

Perhaps other readers noticed as I, that in his 1,332 words, Mr. Dutton spends not a single one explaining why he thinks climate science is based on eschatology. One might expect such libelous assertions to be presented with some form of basic, sound, scientific underpinning. But no, he provides nothing to support his outrageously wrong-headed assertions about climate science. He instead leaves us to infer that “climate catastrophism” – the mainstream position of business-as-usual climate science – to be somehow deserving of categorization with the likes of Y2K, and End of Days cults and providing an almost sublime rhetorical service to climate change deniers the world over.

I don’t expect The New York Times to be an advocate of climate change energy policy but at a minimum it would be nice to get from the paper a greater understanding of climate science and the catastrophic risks facing me and my family.

Instead, on this 2010 New Years Day morning, the paper is a mule, smuggling counterfeit information into our homes.

Ken Levenson
Brooklyn, NY Jan 1, 2010
Precisely.

Related posts:

The weakening of the polar vortex in the Arctic

First, what is the polar vortex?  I will have to post what others have written:

From the National Snow and Ice Data Center:

The Polar Vortex

The polar vortex is a persistent large-scale cyclonic circulation pattern in the middle and upper troposphere and the stratosphere, centered generally in the polar regions of each hemisphere. In the Arctic, the vortex is asymmetric and typically features a trough (an elongated area of low pressure) over eastern North America. It is important to note that the polar vortex is not a surface pattern. It tends to be well expressed at upper levels of the atmosphere (that is, above about five kilometers).

And, what is the AO or Arctic oscillation?

The Arctic Oscillation

The Arctic Oscillation refers to opposing atmospheric pressure patterns in northern middle and high latitudes.

The oscillation exhibits a "negative phase" with relatively high pressure over the polar region and low pressure at midlatitudes (about 45° North), and a "positive phase" in which the pattern is reversed. In the positive phase, higher pressure at midlatitudes drives ocean storms farther north, and changes in the circulation pattern bring wetter weather to Alaska, Scotland and Scandinavia, as well as drier conditions to the western United States and the Mediterranean. In the positive phase, frigid winter air does not extend as far into the middle of North America as it would during the negative phase of the oscillation. This keeps much of the United States east of the Rocky Mountains warmer than normal, but leaves Greenland and Newfoundland colder than usual. Weather patterns in the negative phase are in general "opposite" to those of the positive phase, as illustrated below.

Over most of the past century, the Arctic Oscillation alternated between its positive and negative phases. Starting in the 1970s, however, the oscillation has tended to stay in the positive phase, causing lower than normal arctic air pressure and higher than normal temperatures in much of the United States and northern Eurasia.
Arctic Oscillation
Effects of the Positive Phase      |     Effects of the Negative Phase
of the Arctic Oscillation                    of the Arctic Oscillation
(Figures courtesy of J. Wallace, University of Washington)


Semipermanent Highs and Lows

The Arctic is characterized by "semipermanent" patterns of high and low pressure. These patterns are semipermanent because they appear in charts of long-term average surface pressure. They can be considered to largely represent the statistical signature of where transitory high and low systems that appear on synoptic charts tend to be most common.

Aleutian Low

This semipermanent low pressure center is located near the Aleutian Islands. Most intense in winter, the Aleutian Low is characterized by many strong cyclones. Traveling cyclones formed in the subpolar latitudes in the North Pacific usually slow down and reach maximum intensity in the area of the Aleutian Low.

Icelandic Low

This low pressure center is located near Iceland, usually between Iceland and southern Greenland. Most intense during winter, in summer, it weakens and splits into two centers, one near Davis Strait and the other west of Iceland. Like its counterpart the Aleutian Low, it reflects the high frequency of cyclones and the tendency for these systems to be strong. In general, migratory lows slow down and intensify in the vicinity of the Icelandic Low.

Siberian High

The Siberian High is an intense, cold anticyclone that forms over eastern Siberia in winter. Prevailing from late November to early March, it is associated with frequent cold air outbreaks over east Asia.

Beaufort High

The Beaufort High is a high pressure center or ridge over the Beaufort Sea present mainly in winter.

North American High (not the one in California on the beach, ok)

The North American High is a relatively weak area of high pressure that covers most of North America during winter. This pressure system tends to be centered over the Yukon, but is not as well-defined as its continental counterpart, the Siberian High.
From the National Weather Service's Climate Prediction Center:

The Arctic Oscillation Index


Observed Daily Arctic Oscillation Index.

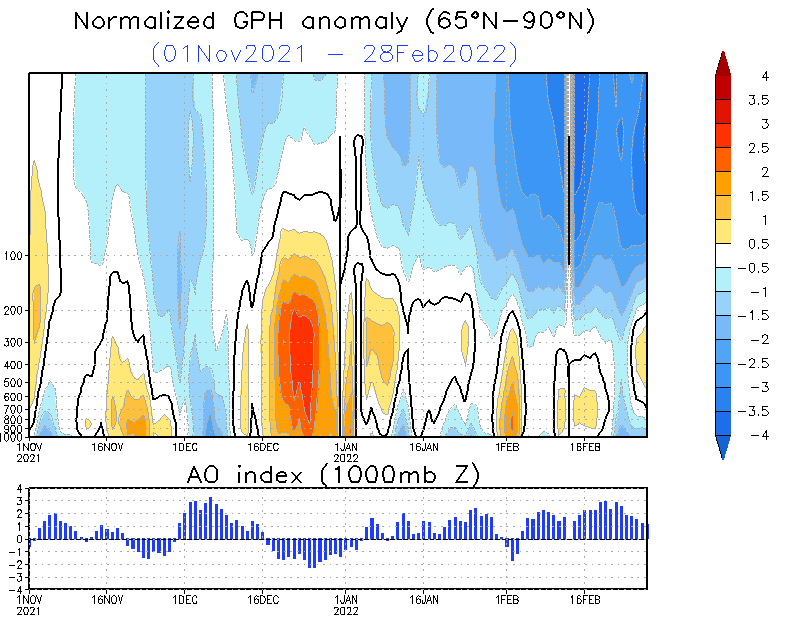
Vertical Cross section of Geopotential Height Anomalies and AO index. Click on image to enlarge.
(Click on image to enlarge)
The daily geopotential height anomalies at 17 pressure levels are shown for the previous 120 days as indicated, and they are normalized by standard deviation using 1979-2000 base period. The anomalies are calculated by subtracting 1979-2000 daily climatology, and then averaged over the polar cap poleward of 65°N.

The blue (red) colors represent a strong (weak) polar vortex. The black solid lines show the zero anomalies.


The daily AO indices are shown for the previous 120 days, and the ensemble forecasts of the daily AO index at selected lead times are appended onto the time series. The indices are standardized by standard deviation of the observed monthly AO index from 1979-2000. A 3-day running mean is applied to the forecast time series.

The values at the upper left and right corners of each figure indicate the mean value of the AO index and the correlation coefficients between the observations and the forecasts, respectively.

The first panel shows the observed AO index (black line) plus forecasted AO indices from each of the 11 GFS ensemble members starting from the last day of the observations (red lines).

The ensemble mean forecasts of the AO index are obtained by averaging the 11 GFS ensemble members (blue lines), and the observed AO index (black line) is superimposed on each panel for comparison. For the forecasted indices (lower 3 panels), the yellow shading shows the ensemble mean plus and minus one standard deviation among the ensemble members, while the upper and lower red lines show the range of the forecasted indices, respectively.

 
GFS Ensemble Arctic Oscillation Outlooks
Link:  http://www.cpc.ncep.noaa.gov/products/precip/CWlink/daily_ao_index/ao_index_ensm.shtml


From NCAR (for those with a more high-tech bend than I have:

The breakdown of the Stratospheric Polar Night Vortex is an atmospheric event that occurs once or twice each year in the polar wintertime stratosphere. As the polar vortex is formed, sharp gradients of potential vorticity at the vortex edge isolate polar air from the air at lower latitudes, producing conditions favorable for wintertime polar ozone depletion. Rossby waves propagating upward from the troposphere along the edge of the Polar Vortex grows exponentially in amplitude, eventually tearing the vortex apart.
Related Links
 
 High Resolution Simulation


The animations depict the flow of the Polar Vortex by visualizing Potential Vorticity (a variable that acts as a tracer) over the 16-day simulation. In the second and succeeding images, the height of the data has been greatly exaggerated to better show the rich vertical structure contained in the vortex. In reality, the vortex is only a few tens of kilometers thick, a pancake-thin region that can extend over much of the Northern Hemisphere.


This image shows a satellite view of the earth from space with three isosurfaces of Potential Vorticity mapped over the Northern Hemisphere from day 16 of the simulation. Brighter colors correspond to increasing Potential Vorticity. The animations at right, show the entire 16-day evolution

B. J. Peterson et al., Science, 313(5790), Trajectory shifts in the Arctic and subarctic freshwater cycle

See also:  http://climatechangepsychology.blogspot.com/search?q=Sarafanov


Science (25 August 2006), Vol. 313, No. 5790, pp. 1061-1066; DOI: 10.1126/science.1122593

Review

Trajectory shifts in the Arctic and subarctic freshwater cycle

Bruce J. Peterson1,*, James McClelland2, Ruth Curry3, Robert M. Holmes4, John E. Walsh5 and Knut Aagaard6

Abstract

Manifold changes in the freshwater cycle of high-latitude lands and oceans have been reported in the past few years. A synthesis of these changes in freshwater sources and in ocean freshwater storage illustrates the complementary and synoptic temporal pattern and magnitude of these changes over the past 50 years. Increasing river discharge anomalies and excess net precipitation on the ocean contributed ~20,000 cubic kilometers of fresh water to the Arctic and high-latitude North Atlantic oceans from lows in the 1960s to highs in the 1990s. Sea ice attrition provided another ~15,000 cubic kilometers, and glacial melt added ~2000 cubic kilometers. The sum of anomalous inputs from these freshwater sources matched the amount and rate at which fresh water accumulated in the North Atlantic during much of the period from 1965 through 1995. The changes in freshwater inputs and ocean storage occurred in conjunction with the amplifying North Atlantic Oscillation and rising air temperatures. Fresh water may now be accumulating in the Arctic Ocean and will likely be exported southward if and when the North Atlantic Oscillation enters into a new high phase.


1 Ecosystems Center, Marine Biological Laboratory, Woods Hole, MA 02543, USA.
2 Marine Science Institute, University of Texas at Austin, Port Aransas, TX 78373, USA.
3 Woods Hole Oceanographic Institution, MS 21, Woods Hole, MA 02543, USA.
4 Woods Hole Research Center, 149 Woods Hole Road, Falmouth, MA 02540, USA.
5 International Arctic Research Center, 930 Koyukuk Drive, Post Office Box 75340, Fairbanks, AK 99775, USA.
6 Applied Physics Laboratory, University of Washington, 1013 NE 40th Street, Seattle, WA 98105, USA. 

 
*Correspondence e-mail: peterson@mbl.edu


Link to abstract:  https://www.sciencemag.org/cgi/content/abstract/313/5790/1061

The failure of COP15 was China's fault -- I know because I was in the room

Dear Readers,

I have no way to vouch for the authenticity of this comment I am lifting from a discussion on another blog, but it certainly contains interesting details (if true).

Here is the comment (part of it is a quote from The Guardian article-- which I will post below -- and part of it was written by Teryn Norris -- which I boldfaced):

The comment can be found at this link (http://itsgettinghotinhere.org/2009/12/19/open-letter-to-bill-mckibben-blaming-obama-for-copenhagen-is-wrong/).

Teryn NorrisDec 23rd, 2009 at 6:18 pm
Another perspective from The Guardian worth reading, “How do I know China wrecked the Copenhagen deal? I was in the room.” I think blaming China is too simplistic (just as is blaming Obama or any single country), but based on what I’m hearing from those closest to the negotiation table, this is a much more accurate picture than what Bill McKibben and Naomi Klein are saying:
“The truth is this: China wrecked the talks, intentionally humiliated Barack Obama, and insisted on an awful “deal” so western leaders would walk away carrying the blame. How do I know this? Because I was in the room and saw it happen…"
To those who would blame Obama and rich countries in general, know this: it was China’s representative who insisted that industrialised country targets, previously agreed as an 80% cut by 2050, be taken out of the deal. “Why can’t we even mention our own targets?” demanded a furious Angela Merkel. Australia’s prime minister, Kevin Rudd, was annoyed enough to bang his microphone. Brazil’s representative too pointed out the illogicality of China’s position. Why should rich countries not announce even this unilateral cut? The Chinese delegate said no, and I watched, aghast, as Merkel threw up her hands in despair and conceded the point. Now we know why – because China bet, correctly, that Obama would get the blame for the Copenhagen accord’s lack of ambition.”
[end comment]


How do I know China wrecked the Copenhagen deal? I was in the room

As recriminations fly post-Copenhagen, one writer offers a fly-on-the-wall account of how talks failed

 Ed Miliband: China tried to hijack climate deal
 The key players and how they rated

A woman listens to Barack Obama's speech at Copenhagen climate change conference 18 December 2009
A woman listens to Barack Obama's speech at the Copenhagen climate change conference on 18 December 2009. Photograph: Axel Schmidt/AFP/Getty Images
Copenhagen was a disaster. That much is agreed. But the truth about what actually happened is in danger of being lost amid the spin and inevitable mutual recriminations. The truth is this: China wrecked the talks, intentionally humiliated Barack Obama, and insisted on an awful "deal" so western leaders would walk away carrying the blame. How do I know this? Because I was in the room and saw it happen.
China's strategy was simple: block the open negotiations for two weeks, and then ensure that the closed-door deal made it look as if the west had failed the world's poor once again. And sure enough, the aid agencies, civil society movements and environmental groups all took the bait. The failure was "the inevitable result of rich countries refusing adequately and fairly to shoulder their overwhelming responsibility", said Christian Aid. "Rich countries have bullied developing nations," fumed Friends of the Earth International.
All very predictable, but the complete opposite of the truth. Even George Monbiot, writing in yesterday's Guardian, made the mistake of singly blaming Obama. But I saw Obama fighting desperately to salvage a deal, and the Chinese delegate saying "no", over and over again. Monbiot even approvingly quoted the Sudanese delegate Lumumba Di-Aping, who denounced the Copenhagen accord as "a suicide pact, an incineration pact, in order to maintain the economic dominance of a few countries".
Sudan behaves at the talks as a puppet of China; one of a number of countries that relieves the Chinese delegation of having to fight its battles in open sessions. It was a perfect stitch-up. China gutted the deal behind the scenes, and then left its proxies to savage it in public.
Here's what actually went on late last Friday night, as heads of state from two dozen countries met behind closed doors. Obama was at the table for several hours, sitting between Gordon Brown and the Ethiopian prime minister, Meles Zenawi. The Danish prime minister chaired, and on his right sat Ban Ki-moon, secretary-general of the UN. Probably only about 50 or 60 people, including the heads of state, were in the room. I was attached to one of the delegations, whose head of state was also present for most of the time.
What I saw was profoundly shocking. The Chinese premier, Wen Jinbao, did not deign to attend the meetings personally, instead sending a second-tier official in the country's foreign ministry to sit opposite Obama himself. The diplomatic snub was obvious and brutal, as was the practical implication: several times during the session, the world's most powerful heads of state were forced to wait around as the Chinese delegate went off to make telephone calls to his "superiors".
Shifting the blame
To those who would blame Obama and rich countries in general, know this: it was China's representative who insisted that industrialised country targets, previously agreed as an 80% cut by 2050, be taken out of the deal. "Why can't we even mention our own targets?" demanded a furious Angela Merkel. Australia's prime minister, Kevin Rudd, was annoyed enough to bang his microphone. Brazil's representative too pointed out the illogicality of China's position. Why should rich countries not announce even this unilateral cut? The Chinese delegate said no, and I watched, aghast, as Merkel threw up her hands in despair and conceded the point. Now we know why – because China bet, correctly, that Obama would get the blame for the Copenhagen accord's lack of ambition.
China, backed at times by India, then proceeded to take out all the numbers that mattered. A 2020 peaking year in global emissions, essential to restrain temperatures to 2C, was removed and replaced by woolly language suggesting that emissions should peak "as soon as possible". The long-term target, of global 50% cuts by 2050, was also excised. No one else, perhaps with the exceptions of India and Saudi Arabia, wanted this to happen. I am certain that had the Chinese not been in the room, we would have left Copenhagen with a deal that had environmentalists popping champagne corks popping in every corner of the world.
Strong position
So how did China manage to pull off this coup? First, it was in an extremely strong negotiating position. China didn't need a deal. As one developing country foreign minister said to me: "The Athenians had nothing to offer to the Spartans." On the other hand, western leaders in particular – but also presidents Lula of Brazil, Zuma of South Africa, Calderón of Mexico and many others – were desperate for a positive outcome. Obama needed a strong deal perhaps more than anyone. The US had confirmed the offer of $100bn to developing countries for adaptation, put serious cuts on the table for the first time (17% below 2005 levels by 2020), and was obviously prepared to up its offer.
Above all, Obama needed to be able to demonstrate to the Senate that he could deliver China in any global climate regulation framework, so conservative senators could not argue that US carbon cuts would further advantage Chinese industry. With midterm elections looming, Obama and his staff also knew that Copenhagen would be probably their only opportunity to go to climate change talks with a strong mandate. This further strengthened China's negotiating hand, as did the complete lack of civil society political pressure on either China or India. Campaign groups never blame developing countries for failure; this is an iron rule that is never broken. The Indians, in particular, have become past masters at co-opting the language of equity ("equal rights to the atmosphere") in the service of planetary suicide – and leftish campaigners and commentators are hoist with their own petard.
With the deal gutted, the heads of state session concluded with a final battle as the Chinese delegate insisted on removing the 1.5C target so beloved of the small island states and low-lying nations who have most to lose from rising seas. President Nasheed of the Maldives, supported by Brown, fought valiantly to save this crucial number. "How can you ask my country to go extinct?" demanded Nasheed. The Chinese delegate feigned great offence – and the number stayed, but surrounded by language which makes it all but meaningless. The deed was done.
China's game
All this raises the question: what is China's game? Why did China, in the words of a UK-based analyst who also spent hours in heads of state meetings, "not only reject targets for itself, but also refuse to allow any other country to take on binding targets?" The analyst, who has attended climate conferences for more than 15 years, concludes that China wants to weaken the climate regulation regime now "in order to avoid the risk that it might be called on to be more ambitious in a few years' time".
This does not mean China is not serious about global warming. It is strong in both the wind and solar industries. But China's growth, and growing global political and economic dominance, is based largely on cheap coal. China knows it is becoming an uncontested superpower; indeed its newfound muscular confidence was on striking display in Copenhagen. Its coal-based economy doubles every decade, and its power increases commensurately. Its leadership will not alter this magic formula unless they absolutely have to.
Copenhagen was much worse than just another bad deal, because it illustrated a profound shift in global geopolitics. This is fast becoming China's century, yet its leadership has displayed that multilateral environmental governance is not only not a priority, but is viewed as a hindrance to the new superpower's freedom of action. I left Copenhagen more despondent than I have felt in a long time. After all the hope and all the hype, the mobilisation of thousands, a wave of optimism crashed against the rock of global power politics, fell back, and drained away.