Blog Archive

Saturday, May 27, 2017

"Mass transport waves amplified by intense Greenland melt and detected in solid Earth deformation," GRL,

Geophysical Research Letters, (26 May 2017); doi: 10.1002/2017GL073478

Mass transport waves amplified by intense Greenland melt and detected in solid Earth deformation


S. Adhikari, E. R. Ivins and E. Larour

Abstract

The annual cycle and secular trend of Greenland mass loading are well recorded in measurements of solid Earth deformation. Horizontal crustal displacements can potentially track the spatiotemporal detail of mass changes with great fidelity. Our analysis of Greenland crustal motion data reveals that a significant excitation of horizontal amplitudes occurs during the intense melt years. We discover that solitary seasonal waves of substantial mass transport (1.67 ± 0.54 Gt/month) traveled at an average speed of 7.1 km/month through Rink Glacier in 2012. We deduce that intense surface melting enhanced either basal lubrication or softening of shear margins, or both, causing the glacier to thin dynamically in summer. The newly routed upstream subglacial water was likely to be both retarded and inefficient, thus providing a causal mechanism for the prolonged ice transport to continue well into the winter months. As the climate continues to produce increasingly warmer spring and summer, amplified seasonal waves of mass transport may become ever more present with important ramifications for the future sea level rise.

Plain Language Summary

It has become well known that seasonal ice flow variability of Greenland outlet glaciers may often be associated with the drainage of supraglacial lakes that accumulate meltwater during summer. However, tracking the details is inevitably limited due to the fact that the mechanisms and rates of meltwater transfer are hidden from view, and theoretical models are fraught with a number of difficulties. Here we use a previously unrecognized source of data that constrain the mass transport during a season of intense Greenland melting and document the evolution of a mass transport wave as it passes down glacier. The breakthrough is twofold: demonstration of the power of the new technique and the first measurement of the mass amplitude. The technique is effectively using the measurement of the deformed solid Earth elastic response as a filter that uniquely responds to neighboring glacier mass changes. We quantify that the wave through Rink Glacier is enormous in terms of its mass transport, amounting to about half of the average annual discharge during 2000–2005, and travels at an average speed of 7.1 km/month. Our mass transport wave measurement is the first of its kind, on any of the major outlet glaciers of either Greenland or Antarctica.

1. Introduction


Three-dimensional (3-D) crustal motions caused by the redistribution of mass on Earth's surface are captured in bedrock Global Navigational Satellite System (GNSS) data. The Greenland GNSS Network (GNET) consists of more than 50 bedrock stations (Figure 1a) having many geophysical applications. A fundamental goal has been to weigh the contemporary mass changes in the Greenland Ice Sheet (GrIS) and to assess the rate of ongoing viscoelastic solid Earth response to past changes in ice mass [Khan et al.20072016Bevis et al.2012]. This mainly requires an analysis of vertical component of the crustal motion. In this paper, we analyze the horizontal displacement data set and show for the first time that these geodetic stations are capable of mapping the magnitude and location of seasonal mass transport waves that travel downstream through GrIS outlet glaciers [Sharp1988Hewitt and Fowler2008]. The breakthrough is twofold: demonstrating the power of the new (geodetic) technique to detect solitary seasonal waves of ice mass transport and the first quantitative measurement of wave amplitude and speed.

Figure 1.

Figure 1. Sensitivity of GNET data to land mass changes. (a) Locations of 54 permanent geodetic stations (circles) around the coastal Greenland. The mapped ice surface velocity [Rignot and Mouginot2009] highlights GNET locations relative to fast ice discharge. The boundary of a JPL-GRACE mascon encompassing the RINK station is also shown. (b) A sensitivity gradient map of vertical displacement dU1/dH, shown within the mascon boundary, for the RINK station. Units reflect a measure of vertical displacement (up positive) at RINK caused by a unit ice load over a unit area placed anywhere in the region. (Note: 1.0 μm/m/km2≈1.1 mm/Gt) (c) Same as Figure 1b but for the north-south component of horizontal displacement dU2/dH(north positive). The dipole shape of the sensitivity gradient is caused by the opposing signs of the displacements for loads placed on either side of the station. (Sensitivity gradient map for the east-west component dU3/dH is not shown.) (d) The ZOI of ice loading on crustal displacement at RINK station. Red zone quadruples, for example, represent the high sensitivity zones for all three components of math formulaat RINK.. These are essentially the derivatives of the displacements at a specified geodetic station with respect to changes in load at any arbitrary location on the Earth's surface: math formula.

Complete, free, open-access article here:  http://onlinelibrary.wiley.com/doi/10.1002/2017GL073478/full

Friday, May 26, 2017

WaPo: So much water pulsed through a melting glacier that it warped the Earth’s crust

by Chris Mooney, The Washington Post, May 25, 2017

NASA scientists detected a pulse of melting  ice and water traveling through a major glacier in Greenland that was so big that it warped the solid Earth — a surge equivalent in mass to 18,000 Empire State Buildings.
The pulse — which occurred during the 2012 record melt year — traveled nearly 15 miles through the Rink Glacier in western Greenland over four months before reaching the sea, the researchers said.
“It’s a gigantic mass,” said Eric Larour, one of the study’s authors and a researcher at NASA’s Jet Propulsion Laboratory. “It is able to bend the bedrock around it.”
Such a “wave” has never before been detected in a Greenland or Antarctic glacier. The total amount of mass carried in the wave — in the form of either water, ice or some combination of both — was 1.67 billion tons per month, or 6.68 billion tons over four months, according to the study, which was published in Geophysical Research Letters.
The study was led by the lab’s Surendra Adhikari and co-authored by Erik Ivins.
“These solitary waves, they’re fairly well known in rivers,” said Ivins, also a researcher at the Jet Propulsion Laboratory. “Rivers can have inundations upstream where a lot of water is collected, and the water gets bunched up as it’s going downstream and doesn’t ever really flatten out. It just remains as this wave and continues down a river.”
However, the scientists don’t know what the wave actually looked like or precisely what caused it — much of it was occurring below the surface of the glacier. They also don’t know precisely what it was made of. “We are losing a combination of water and ice. We don’t know what fraction,” said Adhikari.
The researchers were able to detect the wave only because a GPS sensor, located in a rocky inland area a little over 12 miles, moved 15 millimeters as the wave went by, pushing down on the Earth’s crust and causing a deep indentation.
“The GPS can sense that,” Larour explained.
Richard Alley, a glaciologist at Penn State University who was not involved in the study, explained it this way:
“Find a bed,” Alley said by email. “Put a little piece of tape on the sheet.  Put your fist right next to the tape and push down, while watching the tape.  The tape will move down as you push down, and also will move horizontally toward your fist just a little. Put your fist farther away, and the tape won’t move as much.  Push harder, and it will move more. While pushing down, slide your fist past the tape, and you’ll see a pattern of vertical and horizontal motions of the tape.”
“A bed isn’t exactly the elastic Earth, but that’s sort of what this team did,” Alley continued. “They saw a ‘fist’ of mass sliding down the glacier past their GPS station, caused by extra meltwater.”
Adhikari provided this animation showing the direction of the GPS device’s movement (and therefore that of the bedrock or solid Earth) as the bulk of mass went by:
The wave occurred in the wake of a 2012 summer melting event that saw most of the surface of Greenland become covered with liquid water, and that still has not been surpassed by subsequent warm years.  The researchers suspect that some of that meltwater flooded beneath the ice sheet and then pulsed outward through Rink Glacier.
“It’s really related to the deep interior of Greenland that’s full of melt, and it’s trying to get rid of that melt through gravitational processes,” said Ivins.
The study also documented another, smaller “wave” at Rink Glacier in 2010, another major melt year.
Rink is far from the largest glacier in Greenland. It is about 3.4 miles wide at its front where it touches the ocean and a little over half a mile deep in the same location. Researchers have also shown that pulses of meltwater flow out from beneath the glacier in colorful silt-filled plumes, presumably through subterranean channels, which could be how some of this mass exited to the ocean in 2012.
The scale of the pulse, 6.68 billion tons, or gigatons, is still only a fraction of what Greenland contributes to the ocean every year in the form of water and ice. NASA has estimated that Greenland loses 287 billion tons annually at present (though it lost far more than that in the banner melt year of 2012).
Still, the research gives a sense of the tremendous magnitude of the changes occurring on Greenland, which is covered by enough ice to raise sea levels by over 20 feet if it were all to slide into the ocean.
And it pairs with other studies showing that the breaking off of large pieces from Greenland glaciers causes major earthquakes and that enormous lakes atop the Greenland ice sheet can vanish within hours into its depths.
The study also raises questions about whether more huge ice and water pulses will be seen as the Arctic continues to warm and Greenland to melt — and thus whether this is how a melting ice sheet exports its mass to the ocean.
But mostly, it’s just staggering to contemplate.
If the analogy of 18,000 Empire State Buildings isn’t striking enough, the researchers offered another: The mass loss through Rink Glacier from the wave, they say, was equivalent to “150 million fully loaded 18-wheelers.”
https://www.washingtonpost.com/news/energy-environment/wp/2017/05/25/so-much-water-pulsed-through-a-melting-glacier-that-it-warped-the-earths-crust/

WaPo: Scientists find more reasons that Greenland will melt faster

by Chris Mooney, The Washington Post, April 30, 2016

So much about the planet’s future will depend on processes that humans today cannot directly observe — because they are occurring hundreds of meters below the sea surface where enormous marine glaciers, in Greenland and Antarctica, simultaneously touch the ocean and the seafloor.
The more we learn about this crucial yet inscrutable place, the more worrying it seems.
The latest exhibit: New research out of Greenland conducted by Dartmouth earth sciences Ph.D. student Kristin Schild and two university colleagues — work that has just been published in the Annals of Glaciology. The study examined the 5.5-kilometer-wide Rink Glacier of West Greenland, with particular focus on how meltwater on the ice sheet’s surface actually finds its way underneath Rink, pours out in the key undersea area described above and speeds up the glacier’s melt.
It’s a feedback process that, if it plays out across many other similarly situated glaciers, could greatly worsen Greenland’s overall ice loss. “These big tidewater outlet glaciers are the ones that are contributing these huge icebergs, they’re the ones that have rapidly, rapidly sped up in the last decade,” Schild said. This makes it critically important to learn “what are the main factors…that are leading to all these fast changes,” she added.
Greenland is an enormous sheet of ice, capable of raising sea levels by some 20 feet if it were somehow to melt entirely and its waters were to pour into the ocean. Fortunately, it can’t just do that all of a sudden — the vast ice sheet only reaches the ocean at relatively narrow, finger-like glaciers that stretch out into fjords, or underwater canyons that lead out to the sea.
There are nearly 200 of these large outlet glaciers overall — and as Greenland goes, Rink is fairly large in size but far from the largest. It’s less than 1 kilometer tall as it extends from the seafloor deep in a west Greenland fjord up above the surface of the water, Schild said.
That’s hardly as massive as the nearby Jakobshavn Glacier, which has a base submerged well over a kilometer below sea level — and which is sending ice out into the ocean faster than any other in Greenland. But Rink, like Jakobshavn, touches the ocean across a wide, icy front, and is grounded deep below the surface of the fjord’s waters. Here is where all the action is — including spectacular calving events, in which enormous icebergs break off, tumble into the water and eventually float out of the fjords.
There’s growing concern that warming ocean waters are snaking into these fjords at depth and lapping at the glacier bases, making such breakups more likely. It doesn’t help matters that scientists studiously mapping the fjords are finding, over and over again, that they’re deeper than previously believed, creating more opportunities for the warm ocean to trigger melting.
But the situation is even more dynamic: Amid warmer atmospheric temperatures, Greenland is also melting on its surface, a process that forms vanishing lakes, ice-banked rivers and downward channels, called moulins, that carry meltwater deep beneath the ice sheet. This water then makes its way to the bases of outlet glaciers and, after traveling through complex passageways and, perhaps, being held up or stored in icy caverns, eventually flows out from beneath them and enters the sea.
It’s the net consequence of all of these processes that will ultimately govern how quickly Greenland loses mass and causes the seas to rise. And that’s what the new study gets at: It attempts to measure the mysterious process by which Greenland’s surface meltwater eventually makes its way beneath the ice sheet and then out into fjords, by flowing to glacier fronts and escaping from underneath them.
To do so, the Dartmouth researchers used satellite imagery, as well as time lapse photography, to observe the seafront in the fjord where water touches Rink Glacier. They were searching for what they call “sediment plumes”: When water rushes out from the glacier base and into the fjord, it’s filled with sediments from the bedrock below. These pulses of water then ascend hundreds of meters to the surface and create an often colorful emergence there, as you can see in the NASA image below:
The study resulted in three separate new findings about how meltwater from Greenland’s surface is making its way under Rink Glacier and speeding its ice loss — each of which suggests that not only Rink, but other glaciers like it, could lose their ice faster than previously thought.
First of all, the satellite and time-lapse images revealed that meltwater is pouring out from beneath Rink Glacier in not just one but four separate locations. That’s bad news, because it means more overall melting of the glacier is possible. “Previously that has not been observed, to have more than one ocean location for a plume,” Schild said.

Each individual plume could be causing additional melting, Schild said. Here’s how it works: As the cold, fresh water rushes out from beneath the glacier, it cascades into ocean water that is saltier and warmer. So the cold water, being lighter, rises toward the surface hundreds of meters away — pulling the salty, warm water inward to fill the void that it leaves behind as it rises.
This doesn’t just bring more warm water toward the glacier — it does so in a turbulent way. “As it’s going up the front of the glacier, it kind of goes up in a corkscrew fashion,” Schild says. “It kind of creates a tornado as it goes up the front of this glacier, it’s bringing in that warm ocean water that then is hitting the terminus of the glacier.” This creates much more melting than would occur if the warm ocean water simply pressed steadily against the glacier front.
And that’s just one effect. The study also found that these meltwater plumes destabilize glacier fronts in another way. Over the winter in Greenland, the waters in front of glaciers develop a thick covering made up of sea ice and chunks of icebergs. This ice “melange,” as the researchers put it, freezes against the front of the glacier and acts to stabilize it.
But the meltwater plumes, the study showed, rise up early in the Greenland melt season and take chunks out of the ice melange. And no wonder — they mix with warm water as they rise to the surface, and so both their velocity and also their temperature help break up the ice and set the stage for the glacier to start calving new icebergs.
And as if that’s not enough, the plume observations also led to yet another conclusion: There appear to be significant pockets of liquid water stored beneath Rink Glacier — water that does not freeze because of the incredible pressure that it’s under. And these pockets should also speed the glacier’s flow toward the sea — glaciers move much more rapidly atop water than they do when grinding against bedrock.
The scientists were able to infer the existence of these subglacial storage chambers based on the timing of the plumes, which continued to form more than 20 days after Greenland’s surface melting itself had ceased as summer came to a close. “As soon as it stops melting on the surface, we still see plumes up to almost a month later, coming out of the glacier,” Schild said. “And so that water is getting stuck, and it’s getting trapped underneath the glacier.”

The presumption, of course, is that while every glacier is different, similar processes could be playing out at many other glaciers besides Rink — including monsters like Jakobshavn.
If you put all these pieces together, then, you can begin to see why global warming can be so devastating to Greenland. It warms the ocean, allowing warmer seas to come visit marine glaciers — but it also warms the atmosphere, leading to melting high atop Greenland’s surface.
Each of these elements, on its own, is bad enough. But their combination is even more dastardly. In fjords at the base of glaciers, the cold water actually acts in concert with the warm to speed up total glacial loss. They’re kind of a dynamic duo.
And in the future, as climate change proceeds, there will be more of both of them.

Thursday, May 25, 2017

WaPo: Scientists just published an entire study refuting Scott Pruitt on climate change


Environmental Protection Agency Administrator Scott Pruitt speaks with coal miners in Sycamore, Pa., in April. (Justin Merriman/Getty Images)

by Chris Mooney, The Washington Post, May 24, 2017

In a sign of growing tensions between scientists and the Trump administration, researchers published a scientific paper Wednesday that was conceived and written as an explicit refutation to an assertion by Environmental Protection Agency Administrator Scott Pruitt about climate change.
The study, in the journal Nature Scientific Reports, sets up a direct test of a claim by Pruitt, made in written Senate comments following his confirmation hearing, that “over the past two decades satellite data indicates there has been a leveling off of warming.”
After reviewing temperature trends contained in three satellite data sets going back to 1979, the paper concludes that the data sets show a global warming trend — and that Pruitt was incorrect.
“Satellite temperature measurements do not support the claim of a ‘leveling off of warming’ over the past two decades,” write the authors, led by Benjamin Santer of Lawrence Livermore National Laboratory. Santer co-authored the study with three Livermore colleagues and scientists from MIT, the University of Washington in Seattle, and Remote Sensing Systems, which keeps one of the three satellite temperature data sets.
“In my opinion, when incorrect science is elevated to the level of formal congressional testimony and makes its way into the official congressional record, climate scientists have some responsibility to test specific claims that were made, determine whether those claims are correct or not, and publish their results,” said Santer in an interview, when asked about the framing of the research.
The study wades into an ongoing and highly fraught debate over how to interpret the temperature records of the planet’s lower atmosphere, or troposphere, provided by polar orbiting satellites.
Such data have often been cited by climate change doubters so as to suggest that there is no global warming trend, or that global warming has recently slowed down, and therefore to contradict thermometer-based measurements taken at the planet’s surface (which show a clear warming trend).
But the new study finds that all of the three satellite data sets — kept by Remote Sensing Systems, the Center for Satellite Applications and Research at the National Oceanic and Atmospheric Administration, and the University of Alabama at Huntsville — show a long-term warming trend in the middle-to-upper part of the troposphere. After correcting for a cooling-down of the stratosphere (the layer above the troposphere), the paper finds that the trend is roughly 0.36 degrees Fahrenheit per decade for the first two data sets, and 0.26 degrees Fahrenheit per decade for the third.
The study further examined whether any shorter temperature trend in these data sets could be described as a “leveling off,” as Pruitt had put it. It did so by examining 20-year periods in the data sets and comparing those with the predictions of climate simulations that reflected the natural variations of the climate but excluded human-caused greenhouse gas emissions. These models were thus meant to represent what the climate would do on its own if humans were not altering it.
The study finds warming trends for all the 20-year periods, including the “last two decades” referred to by Pruitt, although it acknowledges that the trend is somewhat lower over these later periods. But it attributes this to natural climate variations, including a very strong El Nino event in 1997 and 1998 that caused dramatic warmth around the beginning of the 20-year window that ends in the present.
Even in these periods that saw somewhat less warming, the study finds that it was still far more warming than would be without human perturbations of the climate. “The probability that internal variability could produce warming exceeding that observed over the last 20 years is only 1.6 %, 3.1 %, and 6.3% (respectively)” in the three data sets, the authors find.
“Pruitt is not correct in saying that warming has leveled off,” Santer said. “It hasn’t in any of the satellite data sets, and indeed, in older and newer versions of the three satellite data sets, we judge the most recent warming to be statistically significant — to be larger than the warming that our current model-based estimates tells us that we should see due to internal variability alone.”
The EPA did not immediately respond to a request for comment.
“Another solid piece of work by Santer et al. that demonstrates multi-decadal satellite-derived global tropospheric temperatures are increasing far more than we would expect from natural causes,” said Thomas Karl, a longtime climate researcher who formerly headed NOAA’s National Centers for Environmental Information.  “Other satellite instruments, which measure temperatures closer to where we live, work, and grow our food show at least as much, or more warming, in recent decades.”
Gavin Schmidt, who heads the Goddard Institute for Space Studies at NASA, said by email that when it comes to measurements of the Earth’s troposphere by satellite, “the trends over the whole period are clear.”
“This doesn’t however imply that (a) there aren’t still issues with the satellite retrievals (there may well be), and (b) that models did a perfect job over this time period,” Schmidt cautioned.
John Christy, a researcher at the University of Alabama at Huntsville who keeps that data set and whose work has been often cited by climate change “skeptics,” agreed there is a warming trend in the satellite data overall but said that climate models predict that it should be larger. “The datasets are still significantly cooler than the model average,” he said by email.
Christy also argued that the other two data sets, which are warmer than his, are “outliers regarding the magnitude.”
“I wouldn’t get too excited about this study,” Christy said.
But it is not as though a scientific study refuting one of his statements to the Senate holds much risk for Pruitt, said Sarah Binder, a senior fellow at the Brookings Institution and a political scientist at George Washington University.
“It’s significant in the sense that it shows the limits of the confirmation process, especially when the president’s party controls the Senate and senators can no longer filibuster nominees. In other words, it’s possible to float factually inaccurate statements and yet not ding your chances of confirmation,” Binder said. “Of course, the climate change issue is highly partisan: Republicans tend to disagree with a general scientific consensus that the earth is warming. So the idea that a Republican EPA nominee might give [a] factually contested statement on climate change and not pay a price is not terribly surprising.”
In the end, Santer argued, scientists should fact-check politicians even if they’re at a disadvantage when it comes to how long it takes to do so.
“These claims were made in the U.S. Senate, in a confirmation,” said Santer. “It takes time however to set the record straight, to do due diligence, to do the research necessary to address the claims. And one would hope that the scientific response receives at least some token amount of attention, and that the original incorrect claim does not dominate the public discourse on these critically important issues.”

Tuesday, May 23, 2017

Exxon Loses Appeal to Keep PwC Auditor Records Secret in Climate Fraud Investigation

The documents, held by PriceWaterhouseCoopers, could provide a glimpse into the oil giant's calculations of the business risks posed by climate change.

by David Hasemyer, InsideClimate News, May 23, 2017

Exxon is under investigation by the New York attorney general
The New York attorney general is investigating whether oil giant ExxonMobil misled shareholders and the public about the risks of climate change. Credit: Scott Olson/Getty Images
ExxonMobil lost its appeal on Tuesday to keep records held by its auditors away from the New York attorney general's climate fraud probe.
The documents could afford a candid—and perhaps damaging—glimpse into Exxon's private calculations of the business risks posed by climate change. They could contain anything from a smoking gun email to plodding, yet revealing, discussions related to Exxon's posture on global warming, including whether the company was adequately calculating climate change risks for investors. Exxon still has another opportunity to appeal.
Investigators for state Attorney General Eric Schneiderman subpoenaed PricewaterhouseCoopers records pertaining to Exxon's assessment of climate change as part of an investigation into Exxon that was opened in 2015.
Exxon fought to have the subpoena voided, arguing the records were privileged communications with its auditor and should be kept from the eyes of investigators. The oil giant, headquartered in Dallas, based its argument on a Texas law that grants a privilege to auditors and clients much like that between a lawyer and client.
A state court judge agreed with Schneiderman's office that there was no such protection afforded Exxon under New York law and ordered the documents handed over last year. Exxon appealed that decision.
The appeals court, which had been considering the case since a hearing in March, rejected Exxon's argument.
"In light of our conclusion that New York law applies, we need not decide how this issue would be decided under Texas law," the two-page decision said.
Exxon did not respond to a request for comment.
Caroline Nolan, a spokeswoman for PwC, said the company had no comment.
The accounting firm, which has expertise in climate-related risks faced by fossil fuel companies, has remained neutral in the legal fight but has honored Exxon's request not to turn over documents pending the outcome of the litigation.
Exxon has been fighting investigations by Schneiderman and Massachusetts Attorney General Maura Healey both in federal court and state courts.
Schneiderman opened his financial fraud investigation of Exxon in November 2015 by subpoenaing decades of records related to Exxon's history of research into and knowledge of climate change. The investigation revolves around whether the company misled shareholders and the public about the risks of climate change.
The attorney general followed up with a subpoena to PwC nine months later seeking documents related to the auditors' work for the oil giant. Records sought under the subpoena include documents about accounting and reporting of oil and gas reserves, evaluation of assets for potential impairment charges or write-downs, energy price projections, and projected cost estimates of complying with carbon regulations.
Attorneys for Exxon argued that the judge's ruling in October to force PwC to surrender documents "eviscerates" the accountant-client privilege afforded by the laws of Texas, where Exxon is headquartered.  
New York investigators disagreed and argued that PwC should feel a moral obligation to cooperate. "As a certified public accountant, PwC 'owes ultimate allegiance to [a] corporation's creditors and stockholders, as well as to the investing public,' " the attorney general's office responded.
Exxon could file additional appeals up to the New York Supreme Court or allow PwC to comply with the subpoena.
While it is unclear what Exxon's next move may be related to the PwC documents, the company is also asking a judge to seal five subpoenas issued by Schneiderman's office in connection with its investigation, which has grown to include missing emails from former Exxon CEO Rex Tillerson, now U.S. secretary of state.
The attorney general's office disclosed last week that it has expanded its probe to determine whether Exxon may have destroyed emails from Tillerson's "Wayne Tracker" email alias. Investigators are trying to determine why several weeks of emails from that account are now missing. As part of that widening investigation, the attorney general's office revealed that it has subpoenaed a number of Exxon officials.
Exxon offered few clues in its request to the New York judge overseeing the case as to why the documents and the arguments by company lawyers justifying the sealing must remain secret.

Monday, May 22, 2017

USGS: In Next Decades, Frequency of Coastal Flooding Will Double Globally

from USGS, May 18, 2017

The frequency and severity of coastal flooding throughout the world will increase rapidly and eventually double in frequency over the coming decades even with only moderate amounts of sea level rise, according to a new study released today in “Nature Scientific Reports.”
[Readers, note that this press release does not mention the cause of sea level rise, i.e., atmospheric carbon dioxide pollution, and it only mentions, at the very end, "climate adaptation."  Nothing is stated about how sea level rise is expected to be 2 meters (over 6 feet) by 2100.]
This increase in flooding will be greatest and most damaging in tropical regions, impairing the economies of coastal cities and the habitability of low-lying Pacific island nations. Many of the world's largest populated low-lying deltas (such as the Ganges, Indus, Yangtze, Mekong and Irrawaddy Rivers), also fall in or near this affected tropical region.
The new report from scientists at the U.S. Geological Survey, the University of Illinois at Chicago, and the University of Hawaii shows that with just 10-20 cm (4-8 inches) of sea level rise expected no later than 2050, coastal flooding will more than double. This dramatic increase in coastal flooding results from rising sea levels combined with storm-driven flooding, including the effects of waves and storm surge.
idealizedcross-section diagram of waves running up the beach, Terms such as swash, run up, sea-level rise are indictated.
Water-level components that contribute to coastal flooding.(Public domain.)
lone road lined by palm trees on a small flat island, with water from the sea washing over the road
Wave-driven flooding and overwash on Roi-Namur Atoll, Republic of the Marshall Islands (Credit: Peter Swarzenski , U.S. Geological Survey. Public domain.)
coastal road and palm trees on a small flat island, with water waves from the sea washing over the road
Wave-driven flooding and overwash on Roi-Namur Atoll, Republic of the Marshall Islands (Credit: Peter Swarzenski, U.S. Geological Survey. Public domain.)
In most coastal regions, the amount of sea level rise occurring over years to decades is small, yet even gradual sea level rise can rapidly increase the frequency and severity of coastal flooding. Until now, global-scale estimates of increased coastal flooding due to sea level rise have not considered elevated water levels due to waves, and thus have underestimated the potential impact.
The researchers combined sea level projections with wave, tide and storm surge models to estimate increases in coastal flooding around the globe. They found that regions with smaller variations in ocean water levels due to tides, waves and storm surge, common in the tropics, will experience the largest increases in flooding frequency.
“Although it is commonly understood that sea level rise will increase the frequency of coastal flooding, most of that previous scientific work has focused on analyzing tide gauges which capture extreme tides and storm surge, but not wave-driven water levels. Tide gauge data exist only for a limited number of locations around the world. Using models rather than individual tide gauges provides a comprehensive picture of the widespread vulnerability rather than at sparse points where observed data exist,” said lead author of the study, Sean Vitousek, who was a post-doctoral fellow at the USGS when he began this study. Vitousek is now a professor in the Department of Civil & Materials Engineering at the University of Illinois at Chicago.
“The key findings are that areas with limited water-level variability, due to small tidal ranges (for example, the Tropics), and more limited ranges in storm water levels (such as the North American West Coast), will experience the largest increases in flooding frequency. In the Tropics, today’s 50-year water level event will occur every 5 years with just 10 cm of sea level rise,” said USGS geologist and coauthor, Patrick Barnard.
Most previous research has started with expected scenarios of sea level rise and attempted to find the flooding frequency increase. In this new study, the scientists took the opposite approach, finding the amount of sea level rise needed to double the frequency of flooding, while accounting for the uncertainty and year-to-year variability of storm patterns. One of the surprising findings was that it does not take much sea level rise to double the frequency of flooding (particularly in the Tropics). Using this analysis, Vitousek and his coauthors demonstrate that the 10 cm or less of sea level rise expected within the next few decades can more than double the frequency of coastal flooding for many locations across the globe. The areas with smaller increases in flood frequency include areas with very large tidal ranges and those along typical tropical storm paths.
“Most of the world's tropical atoll islands are on average only 1 to 2 meters above present sea level, and even in the high tropical islands such as Hawaii, Guam, American Samoa, U.S. Virgin Islands, Indonesia, and others, the majority of the population and critical infrastructure is located on a narrow coastal fringe at low elevations (1-2 m above present sea level) and thus susceptible to this increased flood frequency,” said USGS geologist and coauthor, Curt Storlazzi.
“These important findings will inform our climate adaptation efforts at all levels of government in Hawaii and other U.S. affiliated Pacific islands,” said coauthor Chip Fletcher, Associate Dean and Professor at the School of Ocean and Earth Science and Technology at the University of Hawaii.
The full report, “Doubling of coastal flooding frequency within decades due to sea-level rise,” is published online in Nature Science Reports.

Funky music video (I kid you not!): Debris flow from a retrogressive thaw slump


https://www.youtube.com/watch?v=FSdb-T_9f-I

Monday, May 8, 2017

Joe Romm: Carbon pollution is suffocating ocean life and speeding up the next mass extinction

Oxygen levels ‘falling 2 to 3 times faster than predicted’ in our warming oceans, study finds


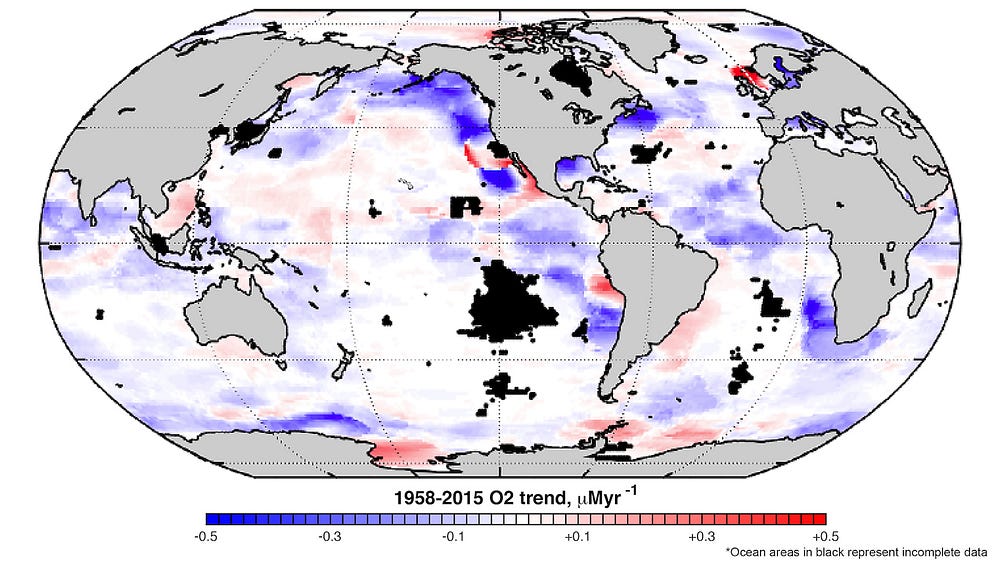
Much of the ocean is seeing sharp drops in oxygen levels (purple). CREDIT: Georgia Tech.

by Joe Romm, Climate Progress, May 8, 2017
Depletion of dissolved oxygen in our oceans, which can cause dead zones, is occurring much faster than expected, a new study finds.
And by combining oxygen loss with ever-worsening ocean warming and acidification, humans are re-creating the conditions that led to the worst-ever extinction, which killed over 90% of marine life 252 million years ago.
Researchers at Georgia Institute of Technology reviewed ocean data going back to 1958 and “found that oxygen levels started dropping in the 1980s as ocean temperatures began to climb.”
Scientists have long predicted that as carbon pollution warms the globe, the amount of oxygen in our oceans would drop, since warmer water can’t hold as much dissolved gas as colder water. And, Georgia Tech researchers point out, falling oxygen levels have recently led to more frequent low-oxygen events that “killed or displaced populations of fish, crabs and many other organisms.”
But what is especially worrisome about this new research is how quickly it is happening. “The trend of oxygen falling is about two to three times faster than what we predicted from the decrease of solubility associated with the ocean warming,” said lead researcher Prof. Taka Ito. “This is most likely due to the changes in ocean circulation and mixing associated with the heating of the near-surface waters and melting of polar ice.”
Global warming drives ocean stratification — the separation of the ocean into relatively distinct layers. This in turn speeds up oxygen loss, as explained in this 2015 video.


2011 study, “Rapid expansion of oceanic anoxia immediately before the end-Permian mass extinction,” found that rapid and widespread anoxia (absence of oxygen) preceded “the largest mass extinction in Earth history, with the demise of an estimated 90 percent of all marine species.”
As National Geographic reported in 2015, we’re already starting to see the impacts of anoxia. “The waters of the Pacific Northwest, starting in 2002, intermittently have gotten so low in oxygen that at times they’ve smothered sea cucumbers, sea stars, anemones, and Dungeness crabs,” the magazine reported.
Finally, a 2015 study found there is no techno-fix to prevent a catastrophic collapse of ocean life for centuries if not millennia if we continue current CO2 emissions trends through 2050.
If we don’t start slashing carbon pollution, then, as co-author John Schellnhuber put it, “we will not be able to preserve ocean life as we know it.”
Thanks to Samantha Page.