Blog Archive

Saturday, April 18, 2015

Why This New Study On Arctic Permafrost Is So Scary


Greenland's permafrost could be melting faster than expected due to active microbes, according to new research.
Greenland’s permafrost could be melting faster than expected due to active microbes, according to new research. CREDIT: SHUTTERSTOCK
by Emily Atkin, ClimateProgress, April 8, 2015
Scientists might have to change their projected timelines for when Greenland’s permafrost will completely melt due to man-made climate change, now that new research from Denmark has shown it could be thawing faster than expected.
Published Monday in the journal Nature Climate Changethe research shows that tiny microbes trapped in Greenland’s permafrost are becoming active as the climate warms and the permafrost begins to thaw. As those microbes become active, they are feeding on previously frozen organic matter, producing heat, and threatening to thaw the permafrost even further.
In other words, according to the research, permafrost thaw could be accelerating permafrost thaw to a “potentially critical” level.
“The accompanying heat production from microbial metabolism of organic material has been recognized as a potential positive-feedback mechanism that would enhance permafrost thawing and the release of carbon,” the study, conducted by researchers at the University of Copenhagen’s Center for Permafrost, said. “This internal heat production is poorly understood, however, and the strength of this effect remains unclear.”
The big worry climate scientists have about thawing permafrost is that the frozen soil ischock-full of carbon. That carbon is supposed to be strongly trapped inside the soil, precisely because it’s supposed to be permanently frozen — hence, “permafrost.”
However, as temperatures in the Arctic have risen due to human-caused climate change, permafrost is thawing, and therefore releasing some of that trapped carbon into the atmosphere. It’s yet another feedback loop manifesting itself in Arctic permafrost regions — as climate change causes it to thaw, the thawing causes more climate change, which causes more thawing, et cetera, et cetera.
What makes this new research so important is that it adds to the urgency of stemming permafrost thaw. Because even without this new discovery of heat-producing microbes, estimates for carbon releases from thawing permafrost have been alarmingly large. According to the National Snow & Ice Data Center, there are about 1,700 gigatons of carbon currently frozen in permafrost — more than the total amount in the atmosphere now (Earth’s atmosphere contains about 850 gigatons of carbon, according to the Center).
Without considering microbes, the average estimate is that 120 gigatons of carbon will be released from thawing permafrost by 2100, which would raise the average global temperature 0.29 degrees. After 2100, if climate change worsens, total permafrost emissions roughly double. That’s confirmed by National Snow and Ice Data Center research scientist Kevin Schaefer’s research, which took the average of 15 peer-reviewed estimates of future carbon releases from thawing permafrost.
Schaefer, who was also one of the reviewers of the microbe study, told ThinkProgress that this is particularly alarming because emissions from permafrost are “completely irreversible.”
“These are permanent emissions,” he said. “Once you thaw out that material, there’s no way to put that organic matter back into the permafrost … you can’t re-freeze the permafrost.”
It’s also unclear whether the carbon that gets released once permafrost thaws will manifest itself as carbon dioxide or methane, which has a much greater impact on climate change — specifically, for each pound emitted compared with carbon dioxide, methane has a 20 times greater impact on atmospheric warming over a 100-year period, according to the Environmental Protection Agency. The New Scientist reports that if the Arctic gets warmer and drier, the microbes trapped within the permafrost can be expected to produce carbon dioxide. But if the environment gets warmer and wetter, the microbes that thrive will tend to produce methane.
The discovery of heat-producing microbes only threatens to add more uncertainty to permafrost emissions projections. Because even though we do know they can accelerate thaw, we don’t know how much.
“One of the biggest uncertainties is how much heat do the microbes generate as they eat the organic material,” Schaefer said. “It will accelerate thaw, but the question is how much. I don’t think that has been answered yet.”
So, that’s a lot of bad news when it comes to global climate change. But the good news, Schaefer said, is that accelerated thawing of Arctic permafrost can be prevented if warming is limited to a global average of 2 degrees Celsius. That 2 degree limit is, incidentally, the objective of international climate negotiations scheduled to take place at the end of this year.

“If we limit the warming to 2 degrees, it will also limit the emissions from thawing permafrost,” Schaefer said. “But the more we dump into the atmosphere, the greater the emissions from permafrost will be.”
Joe Romm: Florida’s Climate Denial Could Cause Catastrophic Recession

Miami Beach flooding
Miami streets see heavy flooding from rain in September 2014. Some neighborhoods flood regularly during deluges or extreme high tides. CREDIT: AP PHOTO/LYNNE SLADKY
by Joe Romm, Climate Progress, March 30, 2015
Governor Rick Scott (R-FL) has made Florida the punchline for countless jokes since we learned in early March he barred state officials from using the term “climate change.” As Jon Stewart joked last week holding a copy of “Roget’s Denial Thesaurus,” Florida is headed toward “statewide jacuzzification,” and “It appears by 2020, Miami will be involved in a surprise pool party.”
But the joke is on all of us: Florida has led the way in all but ignoring the growing twin threats created by human-caused climate change — sea level rise and superstorm surge — thereby creating a trillion-dollar real-estate bubble in coastal property. When the next superstorm like Katrina or Sandy makes its target Florida and bursts that bubble, the state can declare bankruptcy. So too could some insurance companies. But taxpayers — you and I — will get the several hundred billion dollar bailout bill.
And a bailout will be the best-case scenario for all of us. When the coastal property real estate bubble bursts, what measures do we have in place to stop another catastrophic recession like the most recent one, which was also driven by a real estate bubble bursting?
Let’s do the math. There is now at least $1.4 trillion in property within 660 feet of the U.S. coast, a detailed analysis of the data by Reuters found. Worse, “incomplete data for some areas means the actual total is probably much higher.”
While Florida is denying the very existence of climate change, astrophysicist Neil deGrasse Tyson is here to remind us that, “The good thing about science is that it’s true whether or not you believe in it.” And what science told us in the last 12 months about likely sea level rise has been shocking. It’s the kind of news that should have stopped coastal development cold.
Last May, we learned that the West Antarctic Ice Sheet (WAIS) appears close to, if not past, the point of irreversible collapse. Relatedly, “Greenland’s icy reaches are far more vulnerable to warm ocean waters from climate change than had been thought.”
We also learned in August that Greenland and the WAIS more than doubled their rate of ice loss in the last five years.
Already this year, we learned two more stunners. First, a large glacier in the East Antarctic Ice Sheet turns out to be as unstable and as vulnerable to melting from underneath as WAIS is. This alone could “could lead to an extreme thaw increases sea levels by about 11.5 feet (3.5 meters) worldwide if the glacier vanishes.”
Second, two new studies find that global warming is weakening a crucial ocean circulation pathway in the North Atlantic, the Gulf Stream system, to a level “apparently unique in the last thousand years.” And if that circulation continues to weaken, it would also add another few feet of sea level rise to the East Coast. Indeed, this weakening is maybe one reason why large parts of the East Coast are already experiencing much faster sea level rise than the rest of the world.
A January study found that global sea level rise since 1990 has been speeding up even faster than we knew. “The sea-level acceleration over the past century has been greater than had been estimated by others,” explained lead writer Eric Morrow. “It’s a larger problem than we initially thought.”
The recent findings have led top climatologists to conclude we are headed toward what used to be the high end of projected global sea level rise this century: four to six feet or more. A 2013 NOAA study found that, under such sea level rise, the areas that received the very worst storm surges from Superstorm Sandy — such as devastated places like Sandy Hook and The Battery — will be inundated by such storm surges every year or two. In fact, in that scenario, the New Jersey shore from Atlantic City south would see Sandy level storm surges almost every year by mid-century
Worse, as discussed above, the East Coast of the United States is very likely headed toward considerably higher sea level rise over the next century than the planet as a whole. If we don’t take very aggressive action to slash carbon pollution, we could be facing a rise upwards of 10 feet. And considerably more than that after 2100 — sea level rise exceeding a foot per decade.
And so we are in a major coastal real estate bubble.
How big is the bubble, and who will pay when it bursts? The excellent Reuters series, “The crisis of rising sea levels: Water’s Edge,” has a sobering chart:
Insurance
It’s a trillion-dollar bubble. And it looks like American taxpayers are on the hook for much of it.
Florida is ground-zero for this bubble for several reasons. First, as the chart shows, Florida’s $484 billion leads the country in “the value of property covered by the National Flood Insurance Program, often at below market rates.” Indeed, its covered property is three times as much as the next state, Texas.
Second, Florida’s topology makes some of its urban coastal areas especially vulnerable to warming-driven sea level rise and storm surge. Tampa Bay has unique geography that puts it atop Climate Central’s list of U.S. cities most vulnerable to a direct hit from a major hurricane. And Miami is second on the list!
The Miami area is so flat that even with a mere three feet of sea-level rise, “more than a third of southern Florida will vanish; at six feet, more than half will be gone.”
Third, Miami-Dade County by itself has some $94 billion worth of property along coastal waters — and the city can’t protect itself the way many coastal cities can. “Conventional sea walls and barriers are not effective here,” explained Robert Daoust, who works at a Dutch firm specializing in designing responses to rising sea levels. Why? As Jeff Goodell noted in Rolling Stone:
South Florida sits above a vast and porous limestone plateau. “Imagine Swiss cheese, and you’ll have a pretty good idea what the rock under southern Florida looks like,” says Glenn Landers, a senior engineer at the U.S. Army Corps of Engineers. This means water moves around easily – it seeps into yards at high tide, bubbles up on golf courses, flows through underground caverns, corrodes building foundations from below.
For all these reasons, Harold Wanless, chair of University of Miami’s Geological Sciences Department, told National Geographic in 2013, “I cannot envision southeastern Florida having many people at the end of this century.” In 2014, he said, “Miami, as we know it today, is doomed. It’s not a question of if. It’s a question of when.”
Under these dire circumstances, a rational statewide response might be to stop all new coastal development, have insurance priced according to risk, and start doing some intense planning. Instead we have Rick Scott’s complete denial, and sharp cuts in the budget for the South Florida Water Management District. Chuck Watson, a disaster ­impact analyst with a great deal of Florida experience, has warned, “There is no serious thinking, no serious planning, about any of this going on at the state level.
“The view is, ‘Well, if it gets real bad, the federal government will bail us out,’  he said. “It is beyond denial; it is flat-out delusional.”
The state level denial, while easy to milk for laughs, is thus epicly tragic — and not just for Floridians, but for all of us.
Significantly, the planning going on at the local level, while better informed, is still relatively blind to what’s coming and what the response needs to be. That is clear from a very recent article by WLRN, South Florida Public Radio, “An Idea To Mitigate Rising Seas In Miami Beach: Lift The Entire City.”
KLRN interviewed public works director for the City of Miami Beach, Eric Carpenter, who asserted “The only tried and true solution to combating rising sea levels is to raise with it.” Seriously.
KLRN asked Carpenter about the sea-level rise projections Miami uses:
“All we can really count on are the projections that are made by the people that do this for a living. The Army Corps of Engineers are a great source of information. They’re projecting anywhere between seven and 24 inches of sea-level rise over the next 50 to 75 years. … We’re kind of picking numbers that are in the mid to upper portion of that range to be on the conservative side.”
Two feet by 2090 is not conservative. As KLRN points out, South Florida task forces “projected seas to rise anywhere from two to six feet by the end of the century” — last decade. The new findings discussed above make clear that the worst-case scenarios for sea level rise from the last decade have now become simply the “business-as-usual” scenario. Generally people prepare for the plausible worst-case — buying catastrophic health insurance, for instance — since the consequences of underestimating what’s to come can be so ruinous.
Miami should be planning for sea level rise of 6 to 10 feet by century’s end and a foot per decade rise after that. And it’s hard to see how “raising the city” is the optimal response. Is the plan to turn Miami into Venice? Will the valuable parts of Miami simply keep elevating themselves until the place becomes an island disconnected from the rest of South Florida, which will be underwater?
And what about storm surge? What happens when the new island fortress of “Miami Beachless” gets devastated by a major hurricane post-2050, with a storm surge of 10 to 20 feet?

There is a trillion-dollar bill on its way, with no one stepping up to pay it.

Sea levels along the Northeast rose 4-5 inches in just 2 years

NEW YORK SHORE

by James Gerken, Huffington Post, February 27, 2015

Sea levels across the Northeast coast of the United States rose nearly 3.9 inches between 2009 and 2010, according to a new study from researchers at the University of Arizona and the National Oceanic and Atmospheric Administration. The waters near Portland, Maine, saw an even greater rise -- 5 inches -- over the two-year period.
While scientists have been observing higher sea levels across the globe in recent decades, the study found a much more extreme rise than previous averages. Such an event is "unprecedented" in the history of the tide gauge record, according to the researchers, and represents a 1-in-850 year event.
"Unlike storm surge, this event caused persistent and widespread coastal flooding even without apparent weather processes," the study's authors wrote. "In terms of beach erosion, the impact of the 2009-2010 [sea level rise] event is almost as significant as some hurricane events."
The analysis relied on data from dozens of tide gauges along the eastern seaboard. The nearly 4-inch rise for the Northeast represents the average of 14 tide gauges located between New York and Canada. Tide gauges farther south in the Mid-Atlantic and Southeast indicated a sea level rise far less extreme in 2009 and closer to average in some areas. The jump occurred most quickly between April 2009 and March 2010.
The study found that the increase in the Northeast was caused by a 30% slowdown in a major ocean current system known as the Atlantic meridional overturning circulation (AMOC) and a fluctuation in atmospheric pressure at sea level. The Gulf Steam is one component of the AMOC, which moves warm water northward in the upper levels of the Atlantic.
2014 study of the AMOC over that period found the slowdown also contributed to severe winter conditions in northwestern Europe and the intensity of the 2010 Atlantic hurricane season, which was the third-most active on record.
The U.N.'s Intergovernmental Panel on Climate wrote in its latest report that AMOC currents are "very likely" to weaken in the 21st century. Models project that unusual rises in sea level, like that observed in the study, will be bigger and more frequent along the Northeastern seaboard this century, study coauthor Jianjun Yin told The Huffington Post.
And events like the one observed in the study, combined with ongoing global sea level rise, "will pose an even higher coastal flooding risk," Yin told Mashable.
A 2012 study determined that sea levels between North Carolina and Boston are rising at a rate three to four times faster than the global average. Yet this only represents a rise of 2-3.7 mm/yr year since 1980, far less than the 100 millimeters observed in the Northeast between 2009 and 2010.
This week's study, published in Nature Communications, follows a new report from the New York City Panel on Climate Change that warns of significant sea level rise and coastal flooding threats for the city in coming decades. Sea levels in New York City have already risen more than a foot since 1900, and the trend is very likely to accelerate: If greenhouse gas emissions from human activities are not curtailed, the panel projects seas to rise by an additional 11-21 inches by the middle of the century, by 18-39 inches by the 2080s, and by as much as 6 feet by the end of the century.

Warm Atlantic waters are bringing heat deep into the Arctic Ocean, mixing with colder waters above

Tides stir up deep Atlantic heat in the Arctic Ocean

Sea ice photographed by Bangor student, Joshua Griffiths.

from phys.org, February 17, 2015

Researchers have identified how warm Atlantic water that is flowing deep into the Arctic Ocean is mixing with colder waters above to contribute to sea-ice loss in the Arctic. The results, published this week in the journal Nature Geoscience, show that tidal flows in the Arctic are causing deep, warm water (originating from the Gulf Stream) to mix with cold, fresh water lying above, in turn contributing to melting the floating sea ice.

Past research on how warm layers of ocean water mix with cold layers lying above has focused on turbulence driven by winds and waves, rather than on tidal mixing, since tidal flows around the Arctic Ocean are generally weak. However, direct measurements of turbulence from across the seasonally ice-free Arctic Ocean show that tidal motions interacting with steep  slopes are in fact a major cause of vertical mixing.

Lead author, Tom Rippeth from Bangor University explains, "Our oceans are not made up of one body of water, but contain waters of different temperatures and salinity, lying in different 'layers,' so the Arctic Ocean is a bit like a jam sandwich, where the 'bread' is the cold water layers above and below the 'jam,' which is the warm, salty water that enters the Arctic from the Atlantic. Sea-ice floating on the surface of the ocean is insulated from the heat of the Atlantic layer by the 'top slice' of cold polar water.
"We studied the warm body of water from the Atlantic that represents the largest oceanic input of heat into the Arctic – it is four degrees Celsius warmer than the surrounding water, and it is the warmest it has been in nearly two thousand years. The top of the warm layer sits at depths between 40 and 200 m, and its heat slowly diffuses upwards into the cold, fresher  above, but sometimes this movement of heat can be greatly accelerated by turbulence which drives mixing. We have found that tides are producing significant amounts of turbulence over steep sea bed topography, and so are greatly enhancing the upward movement of heat in these regions. In areas where tidal currents interact with steep sea bed slopes, this process causes mixing of the warmer waters with the over-lying colder waters, and this in turn can generate 'hot spots' for sea-ice melt or thinning."
Sheldon Bacon, from the National Oceanography Centre, says, "Arctic sea ice is likely to retreat further in coming decades, and if it does, interactions between the wind and ocean currents may strengthen. These mixing hot spots may then grow into other areas of the Arctic Ocean with steep sea bed slopes, resulting in further sea-ice retreat. We know that the Arctic is already warming faster than the rest of the planet, and other research conducted in the past few years is pointing to the impact of Arctic warming on mid-latitude weather, so the Arctic may have had a role in recent weather extremes in the US, UK and Europe. Therefore the importance of the discovery of this new mechanism for moving heat up towards the Arctic ocean surface lies in its potential to further enhance Arctic warming."
Bangor University, the Norwegian Polar Institute (NPI) and the National Oceanography Centre (NOC) collaborated on four extensive Arctic research cruises covering the Arctic Ocean north of Svalbard, north of eastern and western Siberia, and in the Canada Basin. This was done by directly measuring turbulence around the Arctic Ocean and showing its direct correlation with tidal energy dissipation estimates made using satellite data.
More information: "Tide-mediated warming of Arctic halocline by Atlantic heat fluxes over rough topography." Nature Geoscience (2015) DOI: 10.1038/ngeo2350
http://phys.org/news/2015-02-tides-deep-atlantic-arctic-ocean.html

Submarine data used to investigate turbulence beneath Arctic ice

Submarine data used to investigate turbulence beneath Arctic ice

from phys.org, February 27, 2015

Using recently released Royal Navy submarine data, researchers at the National Oceanography Centre (NOC) have investigated the nature of turbulence in the ocean beneath the Arctic sea ice.

Recent decreases in Arctic  may have a big impact on the circulation, chemistry and biology of the Arctic Ocean, due to ice-free waters becoming more turbulent. By revealing more about how these turbulent motions distribute energy within the ocean, the findings from this study provide information important for accurate predictions of the future of the Arctic Ocean.


NOC scientist and lead author of this research, Charlotte Marcinko, said "By investigating the nature of  under sea ice, we can begin to understand how the circulation of the Arctic Ocean is likely to change as it becomes more ice-free during the summer."
The melting of Arctic sea ice is expected to be accelerated as the cold, fresh layer of water just beneath the ice mixes with a relatively warm, salty layer below it. This mixing is caused by turbulent motions, such as internal waves and eddy currents, which are likely to increase as the sea-ice thins and breaks up, causing a positive feedback effect.
Turbulence also plays a key role in the ocean circulation, linking currents spanning ocean basins to others spanning just millimetres. The wind is a major factor in driving these ocean currents, but in the Arctic sea ice can shield the ocean from it. However, this lid of sea ice also makes it difficult for scientists to investigate what is happening in the ocean currents beneath. As a result currently little is known about turbulence in oceans covered in sea ice, and how these processes might change in future.
Submarines are equipped with sensors that collect various ocean measurements, including temperature and salt content.  Due to the sensitive nature of submarine environmental data collection, MoD approval for access to a relevant dataset has only recently been given to the scientists at the NOC.
The study, published in the Journal of Geophysical Research: Oceans, shows that there are differences in the way energy is distributed by turbulent motions in the Arctic when compared to open, ice-free seas. Findings showed that the nature of turbulence was very similar in Arctic regions with high and low amounts of sea ice. This suggests that the nature of turbulence in the Arctic is altered by the way sea ice affects the structure and stability of the water column, rather than just by the ice acting as a lid protecting the ocean from the wind.
This research was conducted by a team of scientists at the National Oceanography Centre and the University of Portsmouth. It forms part of the Arctic Research Programme, a £15m programme to enhance the UK's research effort in the Arctic, funded by the Natural Environment Research Council (NERC).
More information: Arctic Ocean halocline (2015). Journal of Geophysical Research: Oceans, Vol. 120 Issue 1.
http://phys.org/news/2015-02-submarine-turbulence-beneath-arctic-ice.html

Combined Arctic ice observations show decades of loss

Combined Arctic ice observations show decades of loss
Locations of Arctic Ocean sea ice thickness measurements from aircraft (AIR-EM and IceBridge), fixed points (other panels on the left), satellite (ICESAT) and under-ice submarines. Credit: R. Lindsay / Univ. of Washington.

from phys.org, March 5, 2015


It's no surprise that Arctic sea ice is thinning. What is new is just how long, how steadily, and how much it has declined. University of Washington researchers compiled modern and historic measurements to get a full picture of how Arctic sea ice thickness has changed.

The results, published this month in The Cryosphere, show a thinning in the central Arctic Ocean of 65% between 1975 and 2012. September , when the ice cover is at a minimum, is 85% thinner for the same 37-year stretch.
"The ice is thinning dramatically," said lead author Ron Lindsay, a climatologist at the UW Applied Physics Laboratory. "We knew the ice was thinning, but we now have additional confirmation on how fast, and we can see that it's not slowing down."
The study helps gauge how much the climate has changed in recent decades, and helps better predict an Arctic Ocean that may soon be ice-free for parts of the year.
The project is the first to combine all the available observations of Arctic  thickness. The earlier period from 1975 to 1990 relies mostly on under-ice submarines. Those records are less common since 2000, but have been replaced by a host of airborne and satellite measurements, as well as other methods for gathering data directly on or under the ice.
"A number of researchers were lamenting the fact that there were many thickness observations of sea ice, but they were scattered in different databases and were in many different formats," Lindsay said. The U.S. National Oceanic and Atmospheric Administration funded the effort to compile the various records and match them up for comparison.
Combined Arctic ice observations show decades of loss
The average annual sea ice thickness, in meters, for the central Arctic Ocean. Red dots are submarine records. The green line is the long-term trend. Credit: R. Lindsay / Univ. of Washington.
The data also includes the NASA IceSat satellite that operated from 2003 to 2008, IceBridge aircraft-based measurements that NASA is conducting until its next satellite launches, long-term under-ice moored observations in the Beaufort Sea from the Woods Hole Oceanographic Institution, and other measures from aircraft and instruments anchored to the seafloor.
The older submarine records were unearthed for science by former UW professor Drew Rothrock, who used the U.S. Navy submarine measures of ice thickness to first establish the thinning of the ice pack through the 1990s. [Dr. Peter Wadhams of Cambridge University was using upward looking radar aboard submarines back in the 1970s to do this.  The article should have mentioned his work.] Vessels carried upward-looking sonar to measure the ice draft so they knew where they could safely surface. Further analysis of those records found a 36% reduction in the average thickness in the quarter century between 1975 and 2000.
"This confirms and extends that study," Lindsay said. The broader dataset and longer time frame show that what had looked like a leveling off in the late 1990s was only temporary. Instead, adding another 12 years of data almost doubles the amount of ice loss.
The observations included in the paper all have been entered in the Unified Sea Ice Thickness Climate Data Record that now includes around 50,000 monthly measurements standardized for location and time. The archive is curated by scientists at the UW Applied Physics Laboratory and stored at the U.S. National Snow and Ice Data Center.
Lindsay also is part of a UW group that produces a widely cited calculation of monthly sea-ice volume that combines weather data, sea-surface temperatures and satellite measurements of sea ice concentration to generate ice thickness maps. Critics have said those estimates of sea ice losses seemed too rapid and questioned their base in a numerical model. But the reality may be changing even faster than the calculations suggest.
"At least for the central Arctic basin, even our most drastic thinning estimate was slower than measured by these observations," said co-author Axel Schweiger, a polar scientist at the UW Applied Physics Laboratory.
The new study, he said, also helps confirm the methods that use physical processes to calculate the volume of ice each month.
"Using all these different observations that have been collected over time, it pretty much verifies the trend that we have from the model for the past 13 years, though our estimate of thinning compared to previous decades may have been a little slow," Schweiger said.
The new paper only looks at observations up to the year 2012, when the summer sea ice level reached a record low. The two years since then have had slightly more sea ice in the Arctic Ocean, but the authors say they are not surprised.
"What we see now is a little above the trend, but it's not inconsistent with it in any way," Lindsay said. "It's well within the natural variability around the long-term trend."
http://phys.org/news/2015-03-combined-arctic-ice-decades-loss.html

Rapid reduction of West Antarctica’s ice shelves could have serious implications for global sea levels in a warming world

by Tim Radford, Climate News Network, March 29, 2015

LONDON – Scientists in the US report that the volume of Antarctic shelf ice is diminishing, and that there has been an 18% shrinkage in the mass of some ice floating on coastal waters over the last 18 years.

And because much of the loss has been off West Antarctica, where shelf ice helps to keep the ice sheet stable, it could mean that global sea levels will rise even faster as a result of increased glacial flow into the ocean.

The findings once again raise concern about the link between man-made emissions of greenhouse gases and the dangerous new world of global warming, climate change and sea level rise.

Fernando Paolo, a researcher at the Scripps Institution of Oceanography at the University of California, San Diego, and colleagues report in the journal Science that they used continuous radar altimetry measurements − taken from three European Space Agency satellites between 1994 and 2012 − to compose a high-resolution record of shelf ice thickness.

Declined swiftly

They found that the total volume of shelf ice – the thickness multiplied by the shelf area – around Antarctica stayed more or less the same from 1994 to 2003, but then declined very swiftly.

The ice shelves of West Antarctica lost ice during the entire period, and although East Antarctica had been gaining shelf ice, these gains ceased after 2003. Some shelves had lost 18% of their volume.

“Eighteen per cent over the course of 18 years really is a substantial change,” Paolo says. “Overall, we show not only that the total ice shelf volume is decreasing, but we see an acceleration in the last decade.”

Shelf ice is frozen sea, so when it melts, it makes no difference to sea levels. But there could be an indirect effect.

“The ice shelves buttress the flow from grounded ice into the ocean, and that flow impacts sea levels rise, so that’s a key concern from our new study,” says co-author Helen Fricker, a glaciologist at the Scripps Institution.

In climate science, one such study is never enough: such conclusions need support from other studies. But the ice volume measurements are likely to add to growing concern about West Antarctica.

One earlier study looked at the potential loss of ice from West Antarctica by examining the “grounding lines” of the terrestrial glaciers, and found evidence of continuous and accelerating retreat. In effect, the West Antarctic ice sheet could be approaching a point of no return, scientists reported.

And a second group used other satellite measurements to calculate that ice was being lost from the southern continent at an increasing rate – around 150 cubic kilometres a year from West Antarctica.

So the Scripps study indirectly backs up earlier findings. It calculates that most mass has been lost from ice shelves in the Amundsen and Bellingshausen seas, off the coast of West Antarctica. These account for less than 20% of the total West Antarctic ice-shelf area, but contribute more than 85% of the total ice-shelf volume loss from West Antarctica.

Slow process

Were the West Antarctic ice sheet to melt completely – a long, slow process at almost any temperatures – sea levels would rise by more than three metres worldwide.

At current rates, a couple of the ice shelves off the western coast of the continent could disappear completely within 100 years, the Scripps team says.

Although the Arctic is one of the fastest-warming places on the planet, and although this warming has been directly linked to man-made climate change, the pattern of temperature shifts in the southern hemisphere has been more ambiguous.

The Scripps team have now begun to think about possible reasons for the loss of shelf ice in the far south, and one factor might be the cycle of El Niño events – natural and periodic bubbles of Pacific ocean warmth that have waxed and waned at intervals and changed the prevailing weather patterns worldwide through history.

“We’re looking into connections between El Niño events in the tropical Pacific and changes in the Antarctic ice sheet,” Paolo says. “It’s very far apart, but we know these teleconnections exist. That may ultimately allow us to improve our models for predicting future ice loss.” 

Friday, April 17, 2015

Robert Scribbler: When April is the New July: Siberia’s Epic Wildfires Come Far Too Early

NOTE: THIS IS FROM LAST YEAR

by Robert Scribbler, April 28, 2014

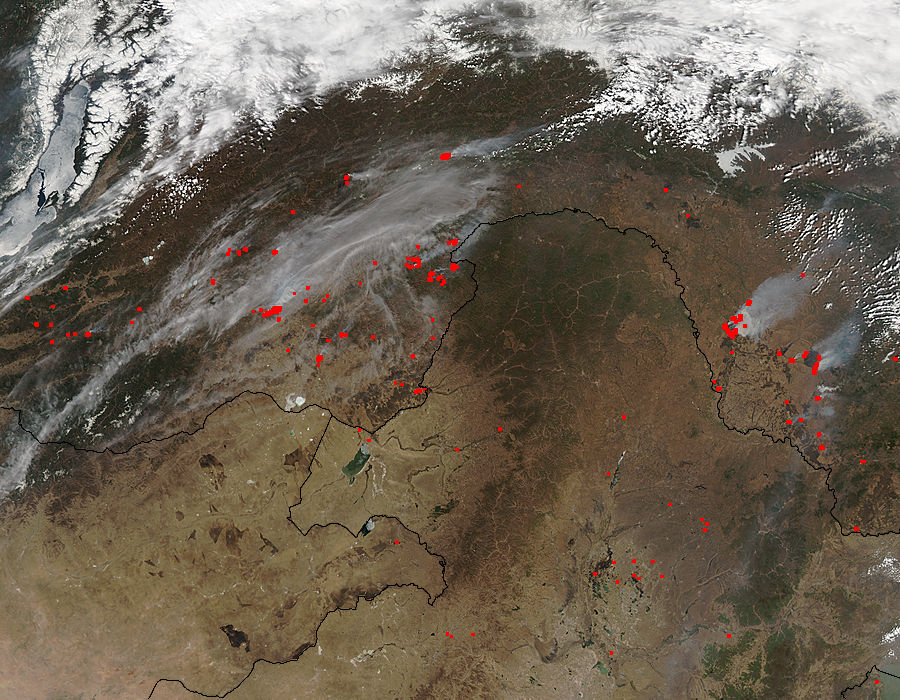
Rapidfire hotspot analysis
(NASA LANCE MODIS Rapid Fire hotspot analysis of extreme fire outbreak in the Amur region of Russia on April 28, 2014. In this shot, the Amur runs west to east through the frame. To the right is the Pacific Ocean [off frame] to the left is a corner of Russia’s massive Lake Baikal. The red spots indicate currently active fires. Image source: LANCE-MODIS)
What we are currently witnessing is something that should never happen — an outbreak of fires with summer intensity during late April at a time when Siberia should still be frigid and frozen.
*    *    *    *    *
The floods promoted strong growth in the region, penetrating permafrost zones to enhance melt, providing major fuel sources for fires should they re-emerge. Come winter, a persistent warm ridge pattern in the Jet Stream transported hotter than usual air over this region. The winter was far, far warmer than it should have been. And when spring came, it came like the onset of summer.
But last night’s LANCE-MODIS satellite pass brought with it unexpected new horrors:
Massive Burn Scars
(Two massive wildfires in excess of 200 square miles burning in the Amur region of Russia on April 28, 2014. Image source: LANCE-MODIS.)
Two massive burn scars devouring huge sections of land in the Amur region of Russia.
For scale, the ribbon of blue traveling north to south beneath the first massive fire is a mile-wide tributary to the Amur river called the Zeya. Using the scale provided by LANCE MODIS, we see that the fire at upper left is currently about 15 x 18 miles (270 square miles) in area and that the fire at lower right is about 23 x 20 miles (460 square miles) in area.
Even during Russia’s recent global warming-spurred epic fire seasons of 2010 to 2013 fires of this scope and obvious visible intensity didn’t come up in the satellite imagery until the most intense periods of summer heating during late June through early August. Today, we have monster fires comparable to those which burned during Russia’s worst ever recorded fire seasons, at their height, burning next to snow covered regions in late April.
As a last reference, look at the ice covered river in the far lower right corner of the above image. That swatch of crystalline white — yes, it’s a large estuary apparently being dwarfed by the massive fire burning just above it. Beneath wide body of still frozen water is what appears to be a ‘small’ plume of smoke. It’s worth noting that this smoke plume issues from a recently burned region covering fully 15 square miles. By comparison, the fires above each cover areas comparable to Guam, half of Rhode Island, or the massive ice island recently broken off from the now doomed Pine Island Glacier (PIG) — B31.
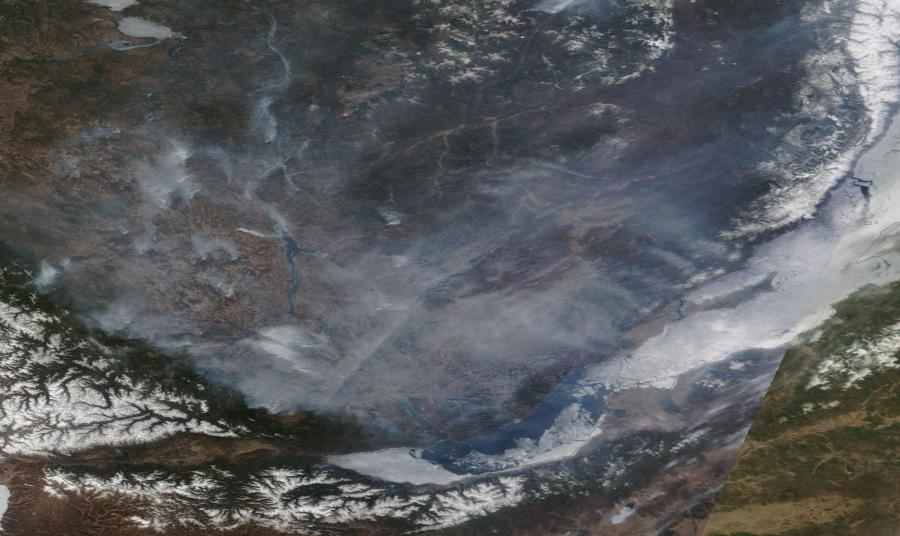
Unfortunately, these massive fires aren’t the only blazes covering extraordinary swaths of Russian land during late April. Moving west to the shores of the still partly frozen Lake Baikal, we find numerous fires burning beneath a sea of smoke in the lowlands between two, still snow-capped highlands.
Lake Baikal Fires April 28
(Sea of Smoke and Fire north and west of Lake Baikal on April 28, 2014. Image source:LANCE-MODIS.)
The entire roughly 200 x 200 mile (40,000 square mile) region is covered by the steely gray smoke of previous and ongoing blazes.  Peering down through the dense shroud, we see numerous thick smoke plumes issuing from still out of control fires. The freakish prematurity of these blazes is readily apparent in the visible ice still covering much of Lake Baikal and also in the snow still doggedly clinging to the nearby mountainous highlands.
A vicious combination of thawing permafrost, a rapid increase in average temperatures throughout Siberia and driven by human warming, and the vulnerability of the active soil layer and related vegetation to rapid drying appears to be turning this region into an ever more explosive fire trap. Risk of wildfire is dependent on both heat and fuel. But with the permafrost containing an almost inexhaustible layer of either drying peat or venting methane and with temperatures now rising at twice the already rapid global rate, the potential for burning in or near the violatile permafrost thaw zone may well be practically unlimited.
These extraordinary and anomalous conditions, combined with a very intense early season warming, what appears to be a persistent and developing heat dome over Eastern Russia and adjacent Arctic Siberia, a very rapidly receding snow line, and, potentially, an amplifying effect from an emerging El Nino in the Pacific, results in a very high continued risk for both extreme and record fires throughout the spring and summer of 2014.